
Value Stream Mapping (VSM) (PowerPoint PPTX Slide Deck)
PowerPoint (PPTX) 32 Slides
BENEFITS OF THIS POWERPOINT DOCUMENT
- Easy to follow, step-by-step template for documenting a Value Stream analysis and implementation plan.
- A powerful tool in identifying waste, so it can be eliminated, contributing to shorter lead times and lower costs.
- Captures your Value Stream Mapping (VSM) "story" from the current state to the future state.
VALUE STREAM MAPPING PPT DESCRIPTION
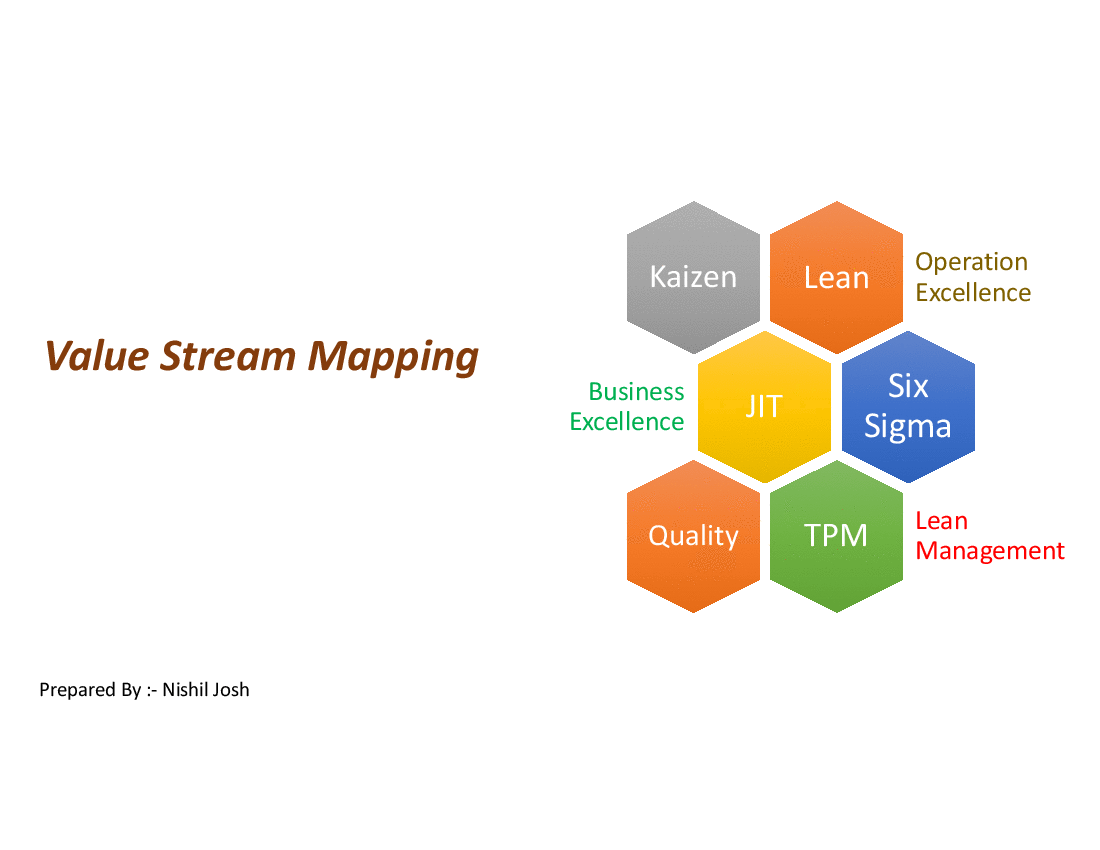
Value Stream Mapping (VSM) is a Lean Management technique used to analyze the flow of materials and information currently required to bring a product or service to the customer.
In this PowerPoint Presentation, you will learn the meaning and benefits of value stream mapping, prepare for a value stream mapping activity, Document a current state value stream map, analyze value and waste, design the future state value stream, and finally create an implementation plan.
Learning Objective :-
To understand the concept of Value stream mapping
Understand how to read a Current State Map,
Understand how to read a future state map
Understand how to Identify projects
Content ;-
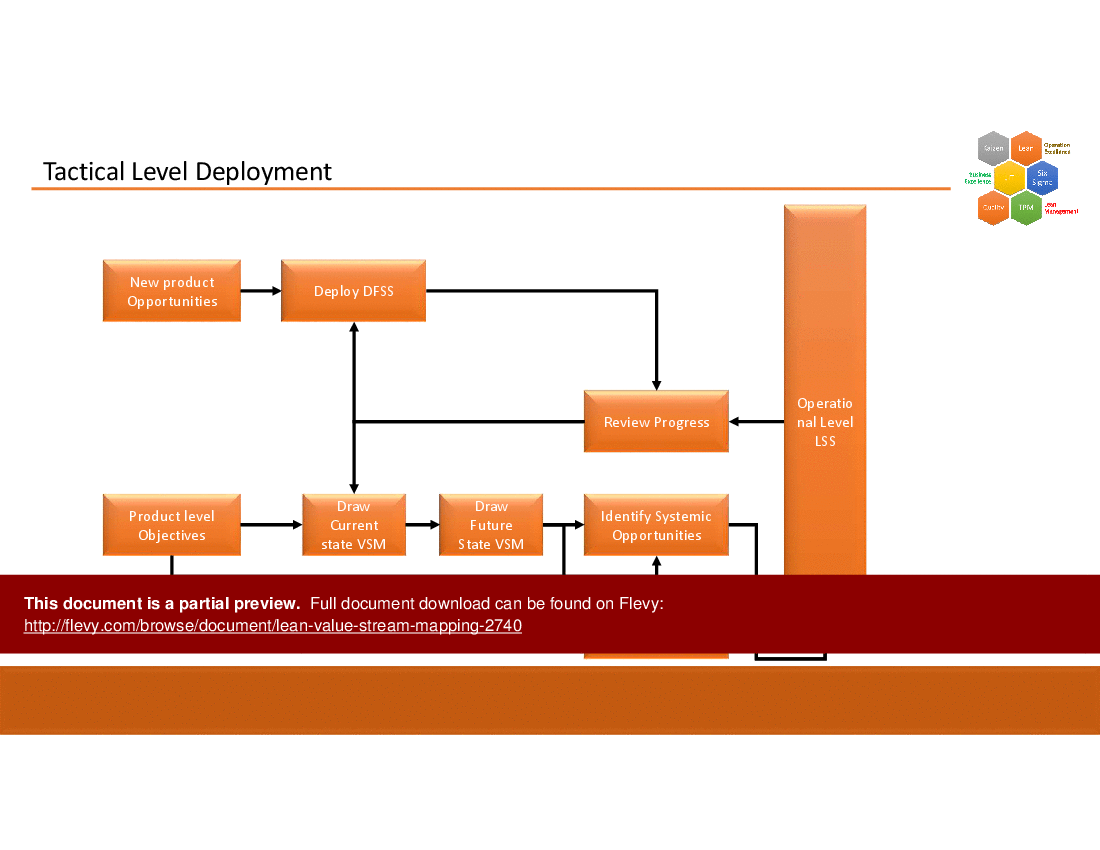
Tactical Level Deployment
Lean Six Sigma Program Planning
What Is a Value Stream?
Lean Guiding Principles
Value Stream Mapping Definitions
Purpose of Value Stream Mapping & Analysis
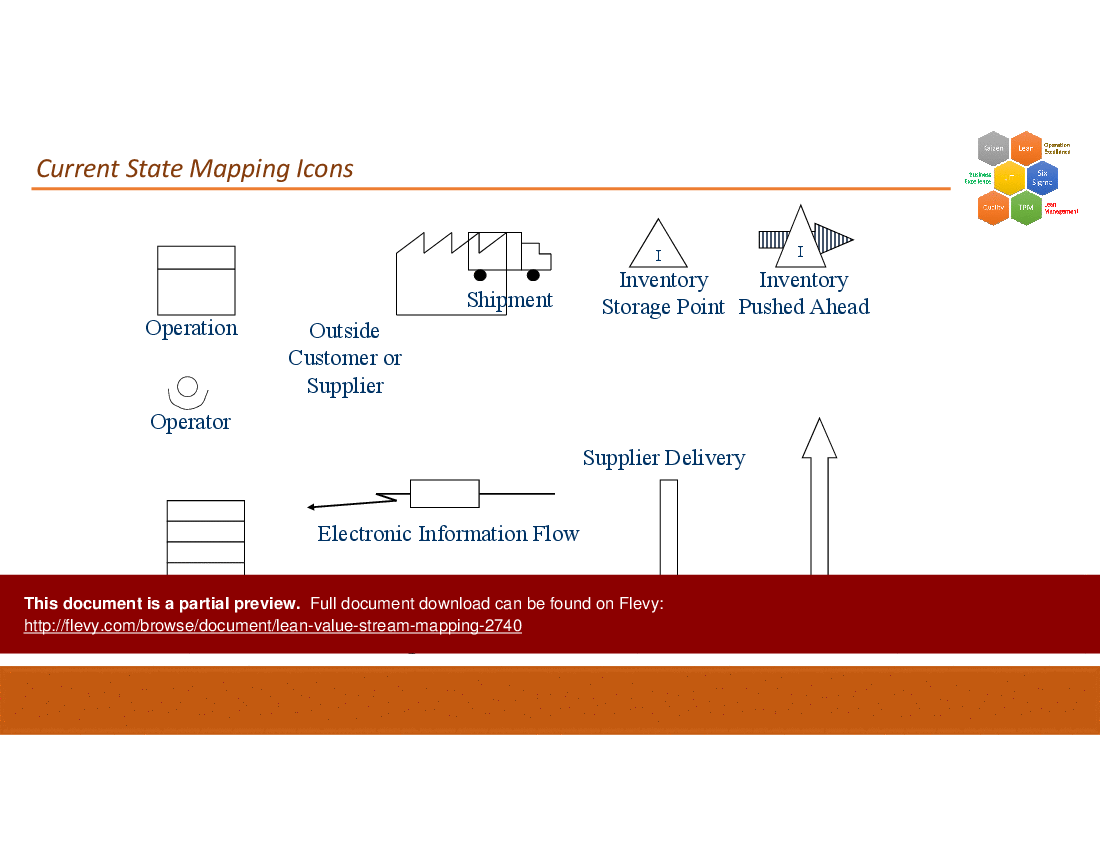
Current State Mapping Icons
Future State Icons
Action Plan Template
Current State – VSM
Future State – VSM
This presentation delves into the tactical level deployment of Lean Six Sigma, guiding you through the process of identifying systemic opportunities and reviewing progress. It emphasizes the importance of mapping both the current and future states, ensuring that all stakeholders are aligned on objectives and methodologies. The PPT also includes detailed icons and symbols used in value stream mapping, making it easier to visualize and communicate complex processes.
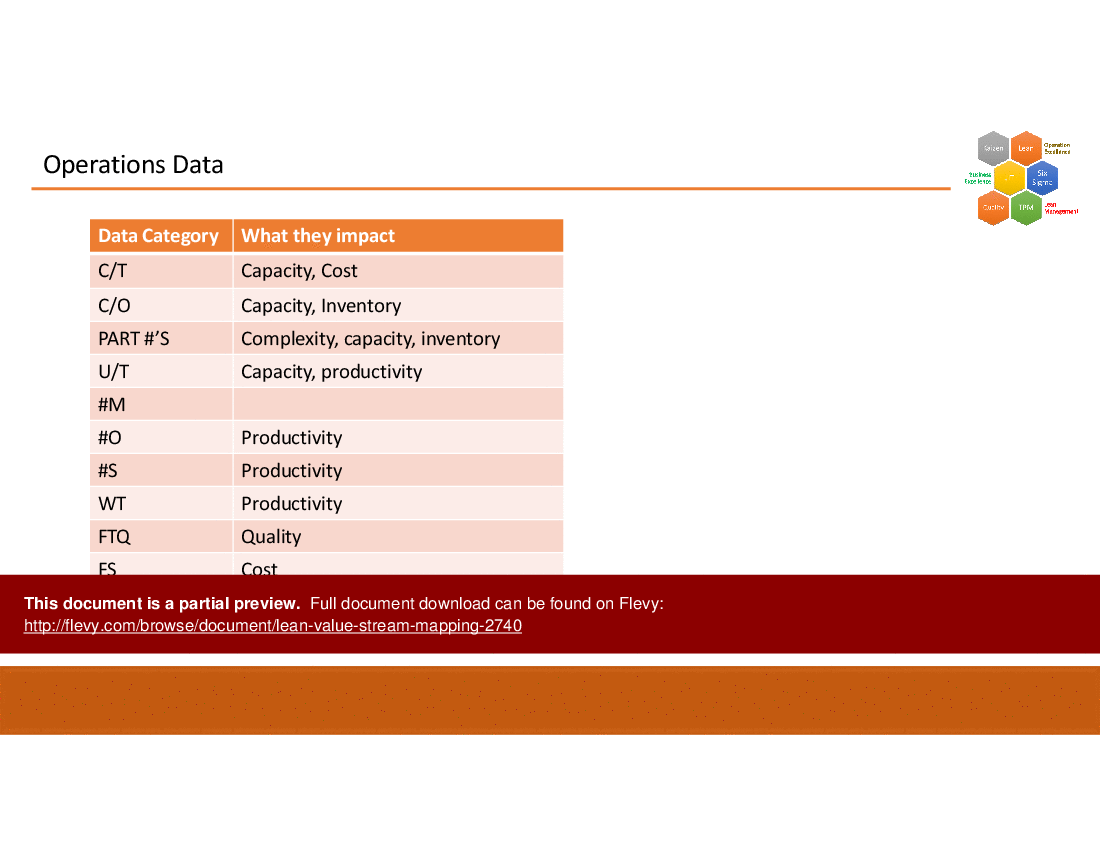
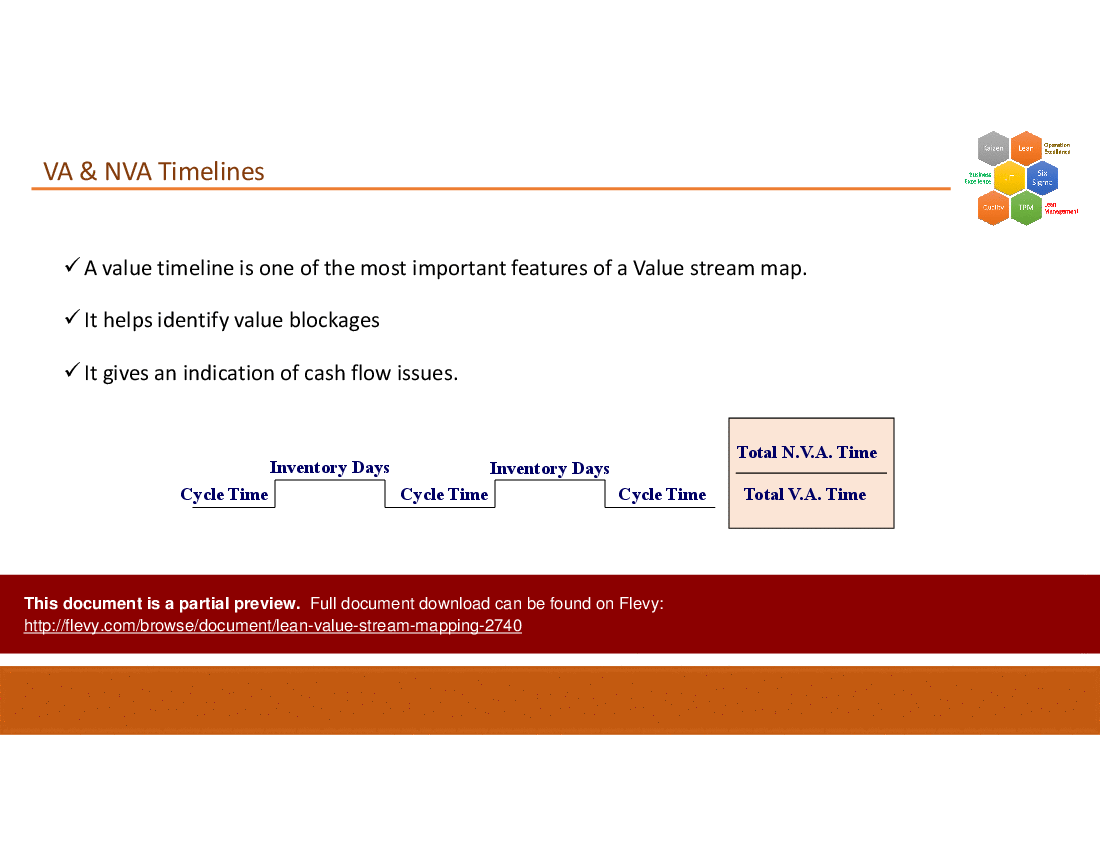
The content covers essential data categories impacting capacity, cost, and productivity, providing a comprehensive overview of operations data. It also highlights the significance of value and non-value-added timelines, helping you identify and address bottlenecks in your processes. This resource is designed to equip you with the tools and knowledge needed to drive continuous improvement and achieve your value stream objectives.
Got a question about the product? Email us at support@flevy.com or ask the author directly by using the "Ask the Author a Question" form. If you cannot view the preview above this document description, go here to view the large preview instead.
MARCUS OVERVIEW
This synopsis was written by Marcus [?] based on the analysis of the full 32-slide presentation.
Executive Summary
The Value Stream Mapping (VSM) PowerPoint presentation provides a comprehensive overview of the VSM methodology, essential for visualizing processes and enhancing operational efficiency. This deck equips corporate executives, integration leaders, and consultants with the knowledge to create Current and Future State Maps, identify improvement projects, and implement Lean Six Sigma principles. By utilizing this presentation, users can effectively assess process efficiency, streamline workflows, and drive continuous improvement initiatives within their organizations.
Who This Is For and When to Use
• Corporate executives seeking to enhance operational efficiency through process mapping
• Integration leaders responsible for implementing Lean Six Sigma methodologies
• Consultants guiding organizations in process improvement initiatives
• Project managers looking to identify and prioritize improvement projects
Best-fit moments to use this deck:
• During strategic planning sessions focused on operational improvements
• In workshops aimed at training teams on VSM techniques
• When assessing current processes and identifying areas for enhancement
• To facilitate discussions on future state visions and project prioritization
Learning Objectives
• Define the concept of Value Stream Mapping and its significance in process improvement
• Create and interpret Current State and Future State Maps
• Identify systemic opportunities for improvement within value streams
• Develop actionable project plans based on VSM analysis
• Evaluate progress towards achieving the desired future state
• Implement continuous improvement strategies using Lean Six Sigma principles
Table of Contents
• Introduction to Value Stream Mapping (page 1)
• Objectives of VSM (page 2)
• Lean Six Sigma at Tactical Level (page 3)
• Value Stream Process Steps (page 20)
• Current State Mapping Icons (page 13)
• Future State Mapping Icons (page 14)
• Action Plan Template (page 24)
• Summary and Next Steps (page 31)
Primary Topics Covered
• Value Stream Definition - A comprehensive understanding of value from the customer's perspective, encompassing all actions required to deliver a product or service.
• Current State Mapping - Techniques for documenting the existing process flow, identifying both value-added and non-value-added activities.
• Future State Mapping - Strategies for designing an ideal process flow that eliminates waste and enhances efficiency.
• Process Improvement Identification - Methods for recognizing projects that can bridge the gap between current and future states.
• Implementation Planning - Guidelines for developing actionable plans to achieve the desired future state.
• Continuous Improvement - The importance of fostering a culture of ongoing enhancement through Lean and Six Sigma practices.
Deliverables, Templates, and Tools
• Current State Map template for visualizing existing processes
• Future State Map template for designing ideal workflows
• Action Plan Template for tracking improvement initiatives
• Icons and symbols for effective VSM representation
• Guidelines for conducting Value Stream Alignment Meetings
• Metrics for evaluating process efficiency and effectiveness
Slide Highlights
• Overview of Lean Six Sigma principles and their application in VSM
• Visual representation of Current and Future State Maps
• Step-by-step process for developing and implementing VSM
• Icons and symbols used in VSM for clarity and consistency
• Action Plan Template designed for tracking project progress
Potential Workshop Agenda
Introduction to Value Stream Mapping (60 minutes)
• Overview of VSM concepts and objectives
• Discussion on the significance of mapping processes
Current and Future State Mapping (90 minutes)
• Hands-on exercise to create Current State Maps
• Group activity to design Future State Maps
Identifying Improvement Projects (60 minutes)
• Analyze Current and Future State Maps to identify projects
• Prioritize projects based on impact and feasibility
Aligning and Implementing Action Plans (90 minutes)
• Develop action plans for prioritized projects
• Establish metrics for tracking progress and success
Customization Guidance
• Tailor the Current and Future State Map templates to reflect specific organizational processes
• Adjust the Action Plan Template to include relevant metrics and timelines
• Incorporate company-specific terminology and examples in the presentation
• Modify the workshop agenda to align with organizational goals and timelines
Secondary Topics Covered
• Lean principles and their integration with Six Sigma methodologies
• Techniques for measuring process efficiency and effectiveness
• Strategies for fostering a culture of continuous improvement
• Importance of stakeholder engagement in process mapping
Topic FAQ
What are the core steps in a value stream mapping project?
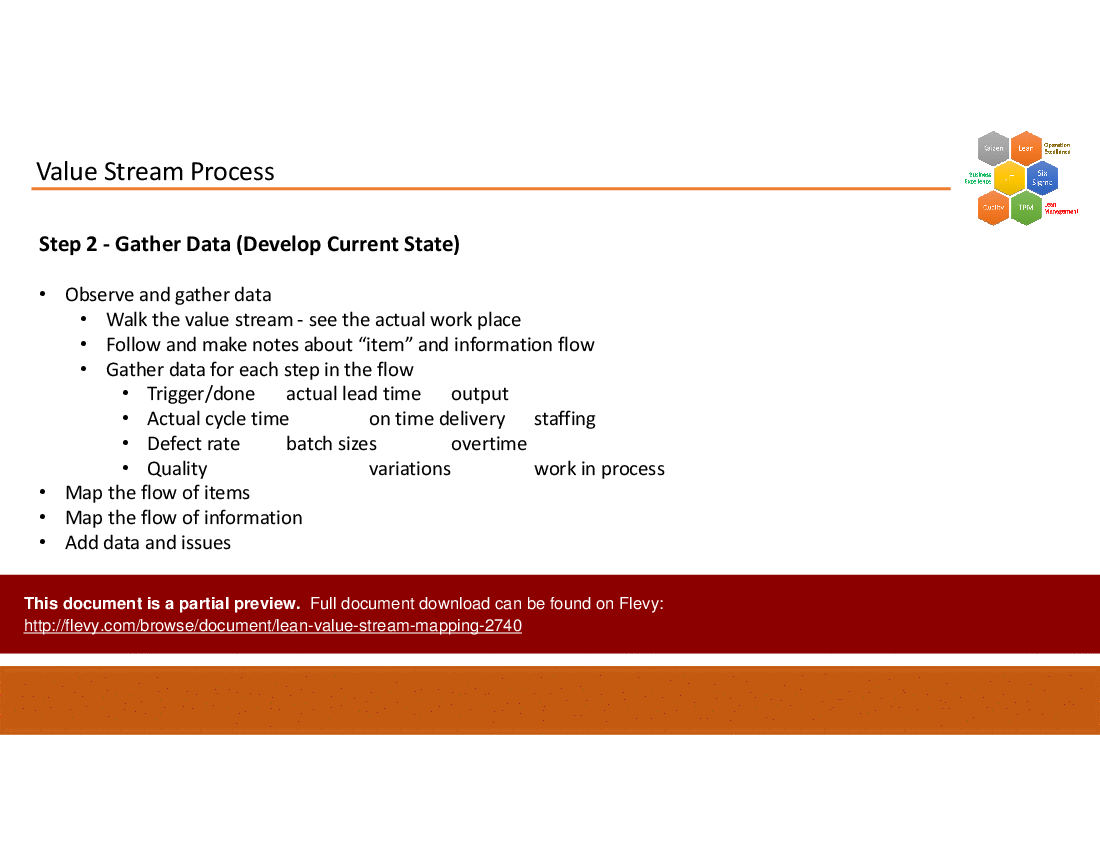
A typical VSM project follows a sequence: prepare for VSM, document the Current State, analyze value vs. waste, design the Future State, and create an implementation plan. These steps help translate observed process flows into prioritized projects and a tracked implementation plan.How do I create a Current State Map for my process?
Create a Current State Map by gathering process data, observing workflow, documenting all actions and handoffs, and using standard VSM icons to represent flow and metrics. The presentation provides Current State Mapping Icons and a Current State Map template to structure the map.What metrics are most relevant when running VSM workshops?
Common VSM metrics include cycle time, lead time, defect rates, and overall equipment effectiveness (OEE). These measure time, quality, and utilization to reveal bottlenecks and improvement opportunities and are included as recommended metrics in the deck.How often should teams hold Value Stream Alignment Meetings to track progress?
Alignment meetings should be scheduled periodically according to the action plan timeline to review progress, discuss results, and adjust initiatives. The presentation recommends aligning meeting cadence with the Action Plan Template and the plan’s scheduled milestones.What should I look for when choosing a VSM toolkit or template pack?
Look for Current and Future State map templates, a practical Action Plan template, standard VSM icons, workshop agendas, and metrics guidance. Also confirm file format and slide count — for example, Flevy's Value Stream Mapping (VSM) is a 32-slide PowerPoint with those templates and agenda guidance.Can Value Stream Mapping be applied to service processes, and how does it differ?
Yes; for service processes VSM focuses on information and service flow rather than material flow, documenting handoffs, wait times, and information delays. Use the same Current and Future State templates and icons, but emphasize lead time and information flow, ending with a Future State Map template.I need to run a one-day VSM workshop — what agenda structure should I follow?
A viable one-day agenda includes an introduction to VSM (60 minutes), hands-on Current and Future State mapping (90 minutes), project identification and prioritization (60 minutes), and action plan development and alignment (90 minutes). Flevy's Value Stream Mapping (VSM) provides this sample agenda and timing guidance.How do I turn VSM findings into actionable improvement projects?
Translate gaps between Current and Future State maps into candidate projects, prioritize by impact and feasibility, define owners, timelines, and metrics, and document steps in an action plan. Use metrics such as cycle time and lead time and capture actions in an Action Plan Template.Document FAQ
These are questions addressed within this presentation.
What is Value Stream Mapping?
Value Stream Mapping is a visual tool used to analyze and improve the flow of materials and information in a process, identifying both value-added and non-value-added activities.
How do I create a Current State Map?
To create a Current State Map, gather data on the existing process, observe the workflow, and document all actions and tasks involved in delivering a product or service.
What is the purpose of a Future State Map?
The Future State Map serves as a vision for the ideal process flow, highlighting opportunities for improvement and guiding the organization towards enhanced efficiency.
How can I identify improvement projects using VSM?
Improvement projects can be identified by analyzing the gaps between the Current and Future State Maps, focusing on areas that present the most significant opportunities for enhancement.
What metrics should I use to evaluate progress?
Metrics may include cycle time, lead time, defect rates, and overall equipment effectiveness (OEE) to measure the success of implemented improvements.
How often should I conduct Value Stream Alignment Meetings?
Value Stream Alignment Meetings should be held periodically, based on the action plan schedule, to review progress, discuss results, and adjust plans as necessary.
Can VSM be applied to service processes?
Yes, VSM can be effectively applied to service processes to visualize and improve the flow of information and services delivered to customers.
What are the key components of a successful VSM workshop?
Key components include clear objectives, active participation from stakeholders, hands-on exercises, and a focus on actionable outcomes.
Glossary
• Value Stream - The sequence of activities required to deliver a product or service to the customer.
• Current State Map - A visual representation of the existing process flow, highlighting current performance metrics.
• Future State Map - A visual representation of the desired process flow, outlining improvements and efficiencies.
• Cycle Time - The total time from the beginning to the end of a process, including all tasks and delays.
• Lead Time - The total time taken from the initiation of a process to its completion.
• Defect Rate - The percentage of products or services that do not meet quality standards.
• Overall Equipment Effectiveness (OEE) - A measure of how effectively a manufacturing operation is utilized.
• Kaizen - A Japanese term meaning "continuous improvement," focusing on small, incremental changes.
• Lean - A methodology aimed at reducing waste and improving efficiency in processes.
• Six Sigma - A data-driven approach to eliminating defects and improving quality in processes.
• Takt Time - The maximum allowable time to produce a product to meet customer demand.
• Action Plan - A detailed plan outlining steps to achieve specific goals or improvements.
• Stakeholder - An individual or group with an interest in the outcome of a project or process.
• Alignment Meeting - A meeting focused on reviewing progress and aligning stakeholders on goals and actions.
• Process Improvement - The proactive task of identifying, analyzing, and improving existing business processes.
• Value-Added Activities - Activities that directly contribute to the value of a product or service from the customer's perspective.
• Non-Value-Added Activities - Activities that do not add value to the product or service and should be minimized or eliminated.
• Mapping Team - A group of individuals responsible for creating and analyzing the Value Stream Maps.
• Continuous Improvement - Ongoing efforts to improve products, services, or processes over time.
• Visual Management - The use of visual signals to communicate information about processes and performance.
• Process Flow - The sequence of steps or activities involved in completing a process.
Source: Best Practices in Value Stream Mapping PowerPoint Slides: Value Stream Mapping (VSM) PowerPoint (PPTX) Presentation Slide Deck, Nishil Josh
