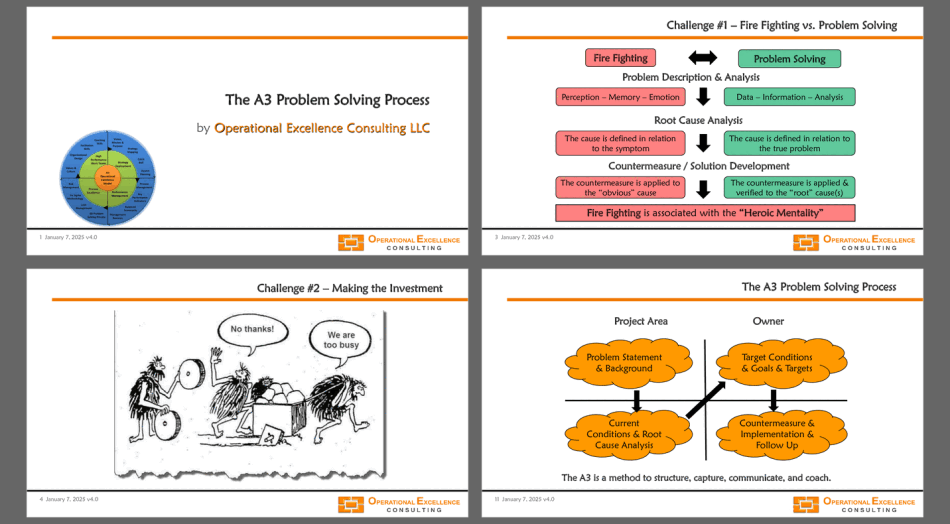
Developed by a Senior Executive and Operational Excellence Coach with experience at organizations including NOKIA, MICROVENTION, and MAGELLAN, this is a presentation and supporting templates to teach the A3 Problem Solving Process.
Understand the A3 Problem Solving Process & Thinking.
Understand the purpose and objective of each phase of the A3 Problem Solving Process.
Understand and apply key problem-solving tools in each phase of the A3 Problem Solving Process.
PROBLEM SOLVING PPT DESCRIPTION
This product (The A3 Problem Solving Process & Tools) is a 181-slide PPT PowerPoint presentation slide deck (PPTX) with a supplemental Excel document, which you can download immediately upon purchase.
The objective of this training module is to introduce you to the A3 Problem Solving Process and provide you and your organization with an effective thought process and approach, as well as the basic tools to identify the underlying root cause(s) of a problem or process performance gap.
The A3 Problem Solving Process & Thinking Training Module includes:
1. MS PowerPoint Presentation including 181 slides covering the A3 Problem Solving Process, Problem Solving Tools, and 7 Workshop Exercises.
2. MS Excel A3 Problem Solving Process Documentation Template
3. MS Excel "Is – Is Not" Matrix and Comparative Analysis Template
"After you have downloaded the training material, you can change any part of the training material and remove all logos and references to Operational Excellence Consulting. You can share the material with your colleagues and clients, and re-use it as you need. The only restriction is that you cannot publicly re-distribute, sell, rent or license the material as though it is your own. Thank you."
The A3 Problem Solving Process & Tools training module delves into the core principles of problem-solving, providing a structured approach to identifying and addressing performance gaps. The module covers essential terminologies such as symptom, problem, possible cause, most likely cause, and root cause, ensuring a comprehensive understanding of each concept. It also introduces the A3 Problem Solving Process, which includes steps like background, current conditions, goals and targets, root cause analysis, and countermeasures.
The training material includes practical examples and exercises, such as the "5 Whys Analysis" and the use of Fishbone Diagrams, to facilitate hands-on learning. The module emphasizes the importance of defining the problem accurately, understanding the current conditions, and setting measurable goals. It also provides tools for root cause verification and developing effective countermeasures. This training module is ideal for organizations looking to enhance their problem-solving capabilities and drive continuous improvement.
Got a question about the product? Email us at support@flevy.com or ask the author directly by using the "Ask the Author a Question" form. If you cannot view the preview above this document description, go here to view the large preview instead.
Source: Best Practices in Problem Solving, A3 PowerPoint Slides: The A3 Problem Solving Process & Tools PowerPoint (PPTX) Presentation Slide Deck, Operational Excellence Consulting LLC
This PPT slide outlines a structured approach to problem-solving, emphasizing key terminology essential for understanding and addressing issues within an organization. It begins with the concept of a "Symptom," which is defined as a measurable event that may signal underlying problems. This sets the stage for identifying issues that require attention.
Next, the slide introduces the term "Problem," described as a deviation from expected standards. This highlights the importance of recognizing gaps between current and desired states, which is crucial for effective problem resolution. The slide then moves into "Possible Cause," where brainstorming techniques, such as Fishbone Diagrams, are suggested as methods to explore various factors that could contribute to the identified problem.
The "Most Likely Cause" is presented as a more focused identification based on available data, indicating a shift from broad speculation to targeted analysis. This step is vital for narrowing down potential issues and directing efforts toward the most relevant factors.
Finally, the slide discusses "Root Cause," which is characterized as a verified explanation that accounts for all observed facts. This emphasizes the need for thorough investigation and validation of causes, ensuring that solutions address the fundamental issues rather than just symptoms. The mention of various factors, including management policies and human errors, underscores the complexity of problem-solving in organizational contexts.
Overall, this slide serves as a foundational guide for executives seeking to enhance their problem-solving capabilities, providing clarity on terminology and processes that can lead to effective solutions.
This PPT slide presents an interrelationships diagram that visually maps out various barriers to effective problem-solving, particularly in the context of statistical thinking. Each node represents a specific issue, with arrows indicating the relationships and influences among them.
Key challenges highlighted include a misunderstanding of the statistical thinking paradigm, which is noted as a significant barrier. This misunderstanding is linked to a rejection of statistical methods, suggesting that without proper comprehension, stakeholders may resist adopting these approaches. The diagram also points out that data accessibility is a concern, indicating that if data is not readily available, it hampers decision-making processes.
Another critical issue is the lack of consensus on measurement indices, which can lead to confusion and misalignment among teams. This lack of agreement is compounded by competing priorities among individuals, which can detract focus from collaborative problem-solving efforts.
Motivation to change is another factor, with a noted lack of drive potentially stalling progress. Fear of technical tools and methods also emerges as a barrier, suggesting that apprehension about new technologies can inhibit their adoption. Additionally, insufficient support for implementation is highlighted, indicating that without backing from leadership, initiatives may falter.
The interconnectedness of these issues underscores the complexity of fostering a culture that embraces statistical thinking and effective problem-solving. Addressing these barriers collectively may enhance organizational capability and drive better outcomes.
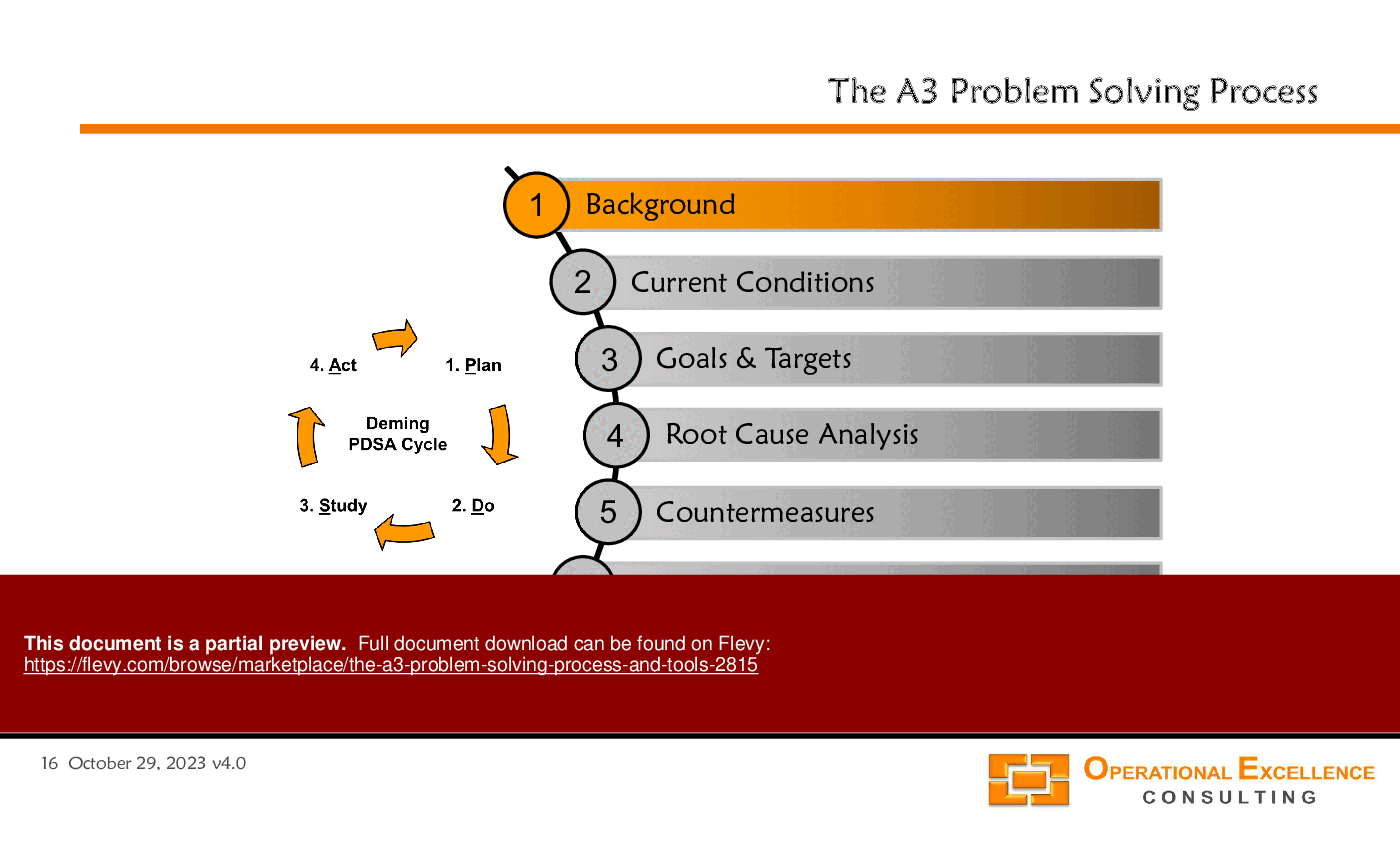
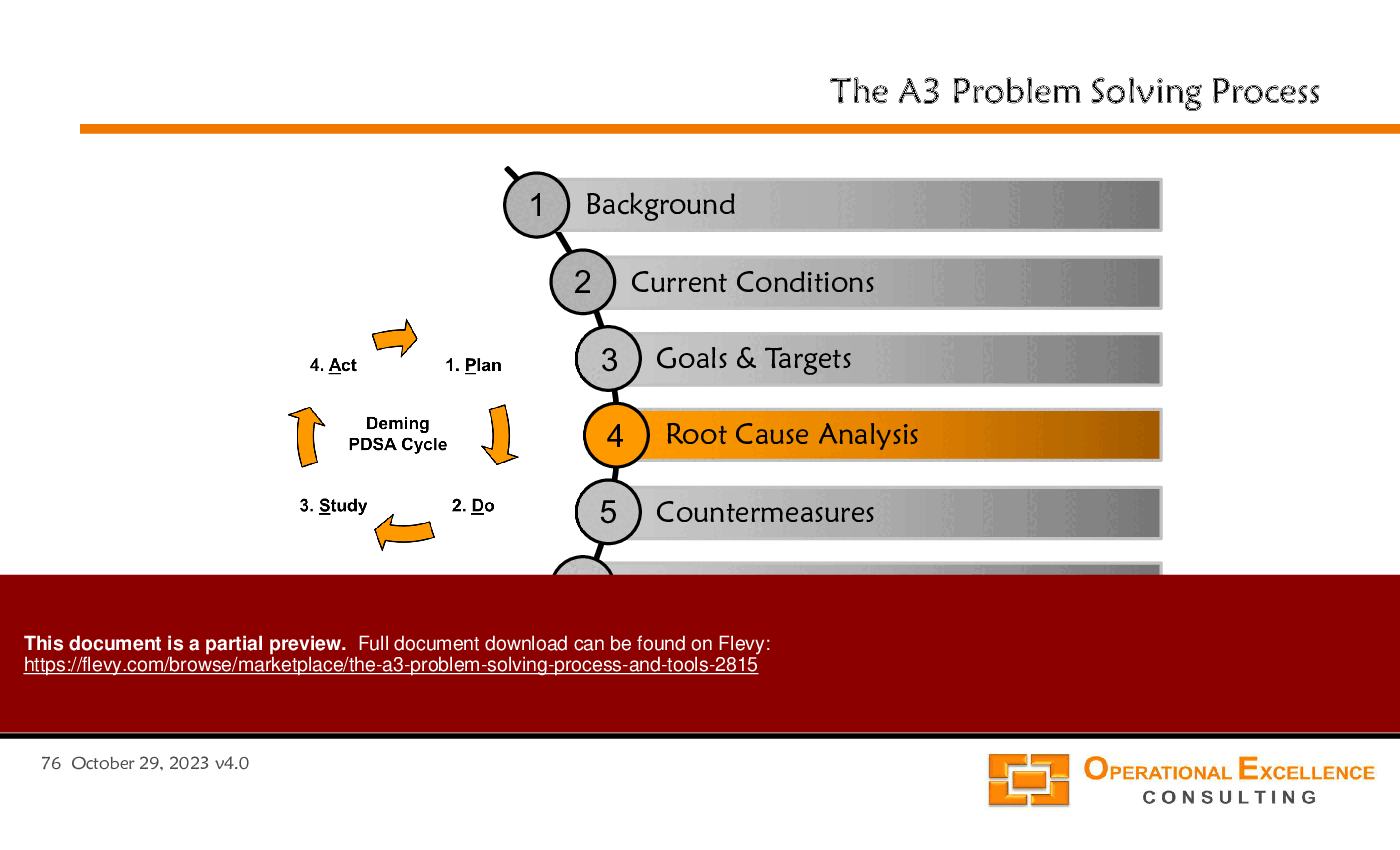
This PPT slide presents an overview of the A3 Problem Solving Process, structured to guide organizations through a systematic approach to addressing challenges. The process is visually represented in 2 main sections: a circular flow diagram illustrating the Deming PDSA (Plan-Do-Study-Act) cycle and a linear list detailing the key components of the A3 methodology.
Starting with the circular diagram, it emphasizes the iterative nature of problem-solving. Each phase—Plan, Do, Study, and Act—highlights the continuous improvement aspect, suggesting that organizations should not only implement solutions, but also assess their effectiveness and adjust accordingly.
The linear section outlines 7 critical steps in the A3 process. It begins with 'Background,' which sets the context for the problem at hand. Following this, 'Current Conditions' assesses the existing situation, providing a baseline for understanding the issue. 'Goals & Targets' establishes what success looks like, ensuring that efforts are aligned with desired outcomes.
Next is 'Root Cause Analysis,' a crucial step for identifying the underlying issues rather than just addressing symptoms. This leads to 'Countermeasures,' where potential solutions are developed. The 'Implementation' step focuses on executing these solutions effectively. Finally, 'Follow Up' ensures that the changes made are sustained over time, reinforcing the importance of long-term results.
This structured approach not only facilitates clarity in problem-solving, but also encourages a culture of continuous improvement within organizations. For potential customers, understanding this process can be pivotal in enhancing operational efficiency and driving sustainable growth.
This PPT slide presents a structured template for the "IS - IS NOT" matrix, a tool designed to facilitate problem-solving processes. It is organized into 2 main columns: one for describing what occurs and another for what does not occur, but could potentially occur. This dual perspective encourages thorough analysis of issues by contrasting existing conditions with possible alternatives.
The first section focuses on the "What?" aspect, prompting users to identify the object and the defect associated with it. This foundational step is crucial for establishing a clear understanding of the problem at hand. The subsequent sections delve into the "Where?" and "When?" dimensions, guiding users to pinpoint the location of the defect and the timeline of its occurrence. This chronological and spatial analysis helps in identifying patterns or trends that may not be immediately apparent.
The template further explores the "How Big?" question, asking users to quantify the defects in terms of frequency and size. This quantitative assessment is essential for prioritizing issues based on their impact. Each section is accompanied by prompts that encourage deeper inquiry, ensuring that users consider all relevant factors.
Overall, this matrix serves as a practical framework for dissecting problems systematically. It aids in visualizing the relationship between current and potential states, fostering a more comprehensive understanding of the issues faced. For organizations looking to enhance their problem-solving capabilities, this tool offers a structured approach that can lead to more informed decision-making and effective solutions.
This PPT slide illustrates the PDSA (Plan-Do-Study-Act) cycle, a structured approach to problem-solving and continuous improvement. It outlines 4 key phases that organizations can follow to effectively implement changes and assess their impact.
Starting with the "Plan" phase, the focus is on identifying the existing issues, setting objectives, and determining the necessary changes. This foundational step ensures that any subsequent actions are aligned with the organization's goals. The next phase, "Do," involves the implementation of the identified changes. It's crucial that this step is executed with precision to ensure that the intended modifications are put into practice effectively.
Following implementation, the "Study" phase emphasizes the importance of monitoring and analyzing the results of the changes made. This step is critical for understanding the impact of the actions taken and for gathering data that can inform future decisions. Finally, the "Act" phase involves evaluating the outcomes and integrating the new learnings into standard practices. This ensures that successful changes are standardized and that lessons learned from the process are documented for future reference.
The slide concludes by reinforcing that the PDSA cycle serves as the foundation for most problem-solving and continuous improvement processes. For organizations looking to enhance their operational efficiency, adopting this cycle can provide a clear framework for systematic improvement. This structured approach not only facilitates better decision-making, but also fosters a culture of continuous learning and adaptation.
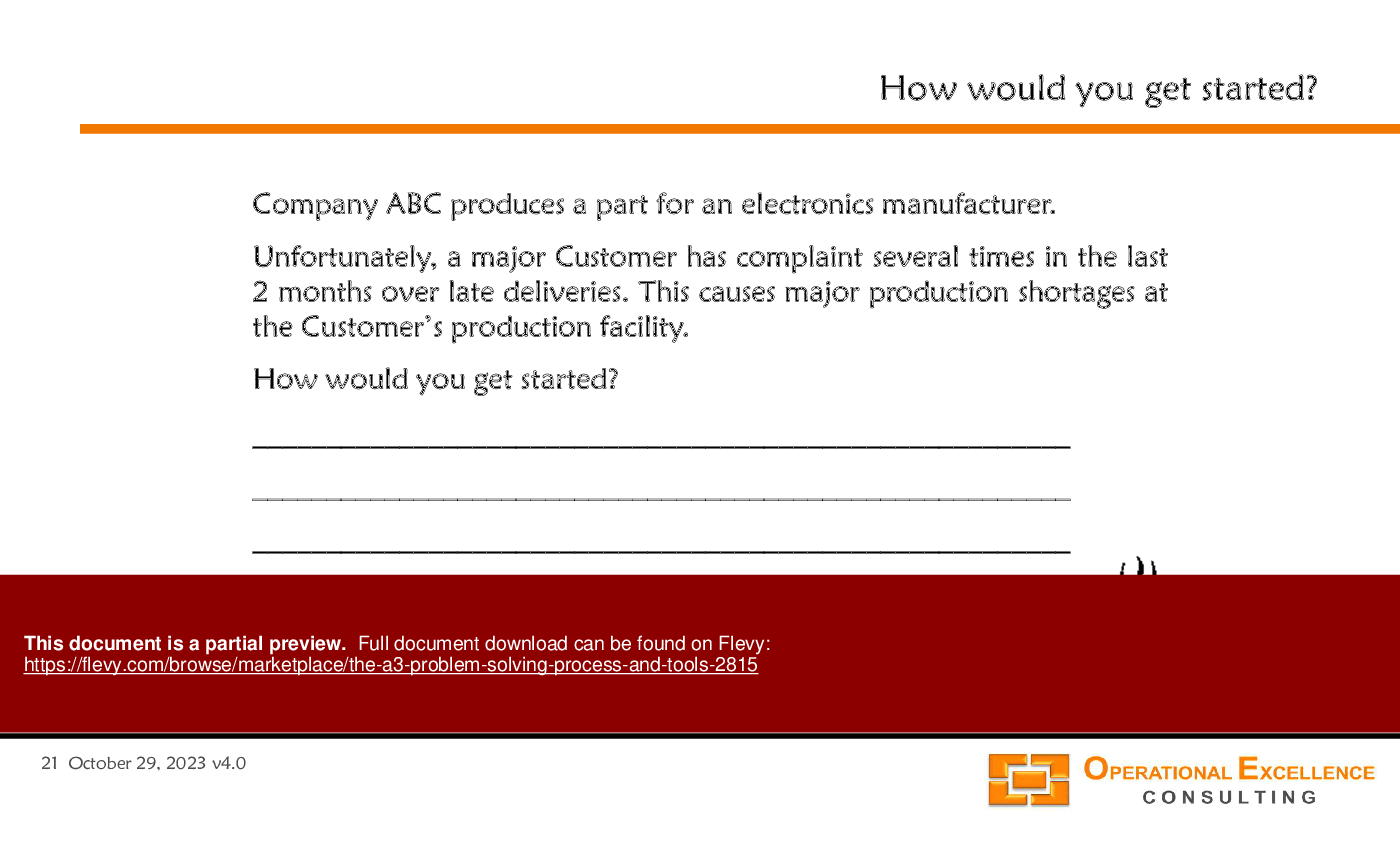
This PPT slide presents a structured approach to articulating a problem statement, specifically focusing on identifying root causes through a series of "Why?" inquiries. It begins with an initial problem statement indicating a lack of the appropriate rework tool. This sets the stage for a deeper analysis.
The first "Why?" reveals that the tool was not in inventory, prompting further questioning. The second inquiry leads to the discovery that the supplier failed to deliver the replacement tool, which is a critical insight. The next question uncovers that the supplier did not receive the purchase order on time, indicating a breakdown in communication or process.
The final question, "Why?" leads to a somewhat ambiguous answer: "We don’t know." This highlights a gap in understanding or accountability within the organization. The progression from the initial problem statement to the final one illustrates the importance of thorough investigation in problem-solving. It emphasizes that the root cause often lies deeper than the surface issue.
This slide serves as a practical example for organizations looking to refine their problem-solving methodologies. It underscores the necessity of asking the right questions to uncover underlying issues. By following this structured approach, teams can better identify and address the core problems affecting their operations. The visual flow of questions guides users through a logical process, making it easier to grasp the significance of each step in reaching a comprehensive understanding of the problem at hand.
This PPT slide contrasts 2 types of performance issues: "Change-Induced" and "Day-One-Deviation." On the left side, the "Change-Induced" problem is illustrated. It shows a scenario where performance metrics that were once met have deteriorated due to some change. The graph indicates that the actual performance has deviated from the expected performance, which is represented by a dashed line. This situation arises when a process that previously functioned effectively has been altered, leading to a decline in performance.
On the right side, the "Day-One-Deviation" problem is depicted. This graph highlights a situation where the necessary conditions for achieving the expected performance never existed from the outset. The performance remains stagnant, indicating that the expected performance level was not achievable from the beginning. This distinction is crucial for organizations to understand as it impacts how they approach problem-solving.
The text below the graphs clarifies these concepts. It emphasizes that a "Change-Induced" problem occurs when there is a clear historical performance baseline that has been disrupted. In contrast, a "Day-One-Deviation" indicates a fundamental issue with the initial setup or expectations.
Understanding these differences is vital for executives aiming to address performance issues effectively. It guides them in diagnosing the root causes of performance gaps and informs the strategies they should implement to rectify these issues. This slide serves as a foundational tool for leaders looking to enhance operational efficiency and drive performance improvement initiatives.
This PPT slide presents an Affinity Diagram that outlines key problem statements relevant to current market dynamics. It is structured into 4 main categories, each addressing distinct customer expectations and market trends.
The first category highlights the globalization of quality. It notes an increasing demand for high-quality, low-cost goods, suggesting that consumers are becoming more discerning. Market differentiation is diminishing, indicating that unique selling propositions may not be as effective as before. Individual customization is gaining importance, reflecting a shift towards personalized offerings. The need to meet all customer requirements is described as severe, emphasizing the urgency for businesses to adapt.
The second category focuses on user experience, stating that non-user-friendly products are unacceptable. It points out that technology is no longer perceived as awe-inspiring, which could imply that innovation must now prioritize usability. Instant and intuitive usability is becoming a requirement, suggesting that companies must streamline their interfaces to retain customer interest.
The third category addresses the necessity for providing complete service. It emphasizes that local service availability is crucial, with customers expecting immediate responses. Replacement parts or products should be delivered within 24 hours, highlighting the demand for efficiency. Customers also expect to be easily contacted and require prompt, accurate answers to their inquiries.
The final category discusses customer behavior in relation to Total Quality Management (TQM). TQM-aware customers are willing to share positive experiences, but are equally likely to relay negative ones. This duality indicates that companies must focus on maintaining high service standards to foster loyalty. The slide concludes with the notion that customers have a low tolerance for inadequate service, which can lead to product returns. Overall, the insights presented here are vital for organizations aiming to enhance their market positioning and customer satisfaction.
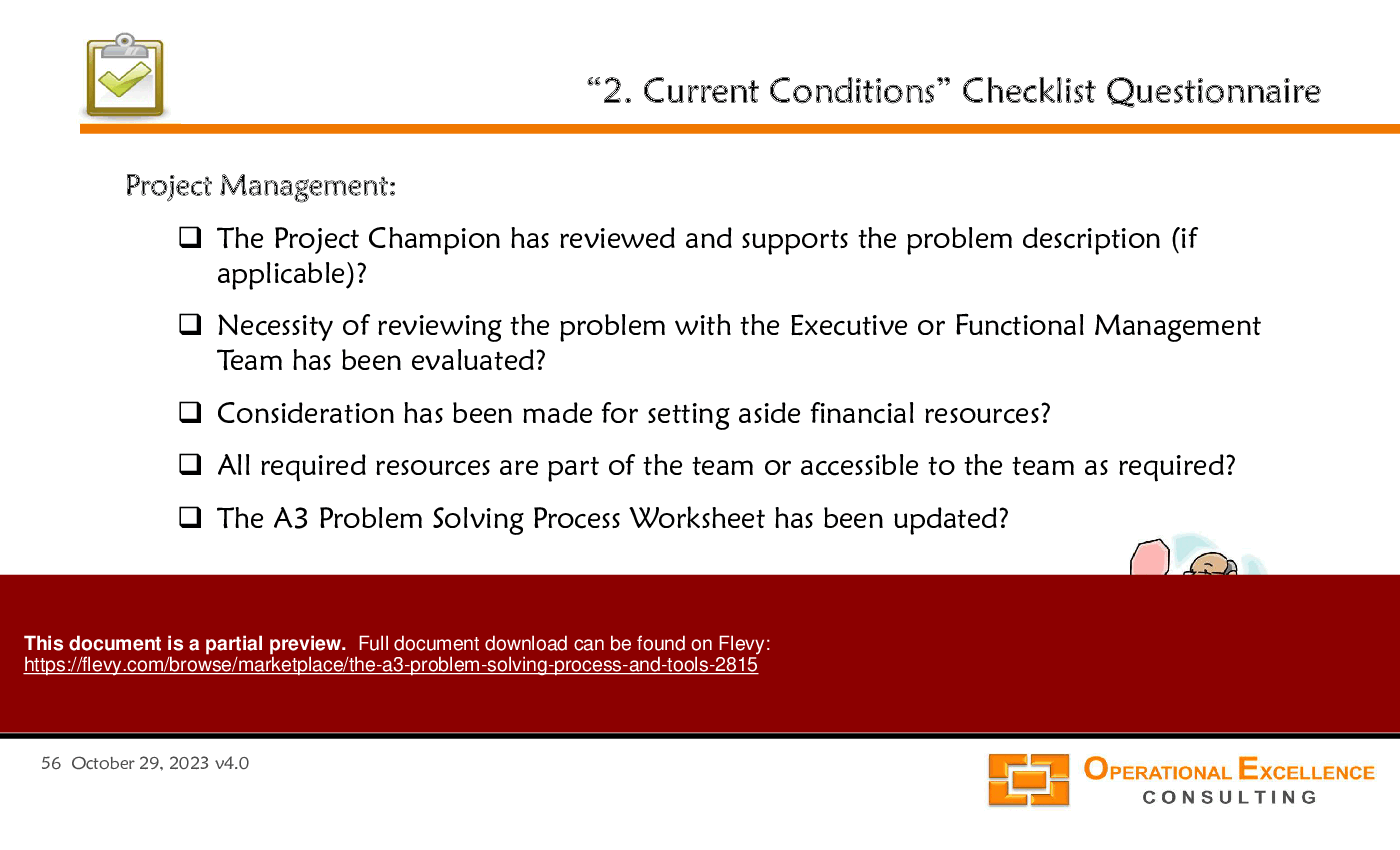
This PPT slide presents a checklist questionnaire focused on assessing current conditions related to problem-solving processes. It begins with a clear problem description, emphasizing the need to distinguish between "Change-Induced" and "Day-One-Deviation" scenarios. This distinction is critical for accurately framing the issue at hand.
Next, it highlights the importance of conducting a thorough "IS – IS NOT" analysis. This analysis aims to document the specifics of the problem, including its scope and impact. The slide also stresses the necessity of developing and verifying visual tools such as Process Flowcharts, Value Stream Maps, or Spaghetti Diagrams. These tools serve to clarify the process and identify where the problem originates.
The checklist further prompts a review of process details to pinpoint the initial appearance of the problem. It encourages evaluation of problem patterns, which can provide insights into recurring issues. Additionally, it suggests reviewing similar components or parts that may have encountered the same problem, fostering a broader understanding of potential solutions.
Finally, the slide underscores the importance of comprehensive data collection and analysis. This step is essential for informed decision-making and effective problem resolution. The structured approach outlined in this checklist can help organizations systematically address issues, ensuring that all relevant factors are considered before moving forward. This document serves as a valuable tool for executives looking to enhance their problem-solving capabilities.
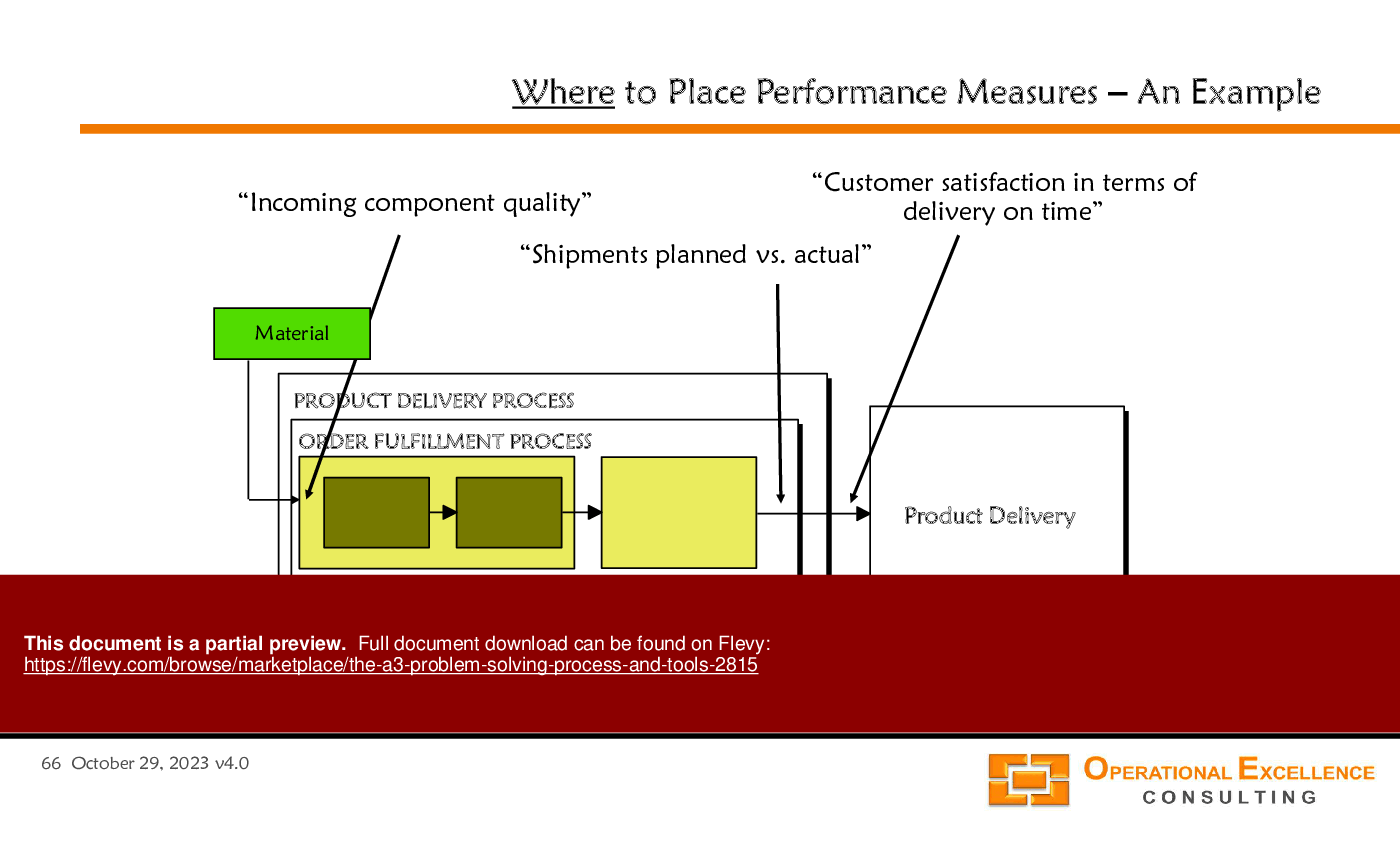
This PPT slide titled "Where to Place Performance Measures – An Example" illustrates the integration of performance metrics within the product delivery and order fulfillment processes. It highlights key performance indicators that are critical for assessing operational efficiency and customer satisfaction.
At the top left, "Incoming component quality" signifies the importance of monitoring the quality of materials entering the production process. This measure is essential for ensuring that the final product meets quality standards, thereby reducing defects and enhancing overall performance.
To the right, "Customer satisfaction in terms of delivery on time" emphasizes the need to gauge customer perceptions regarding timely delivery. This metric is crucial as it directly impacts customer retention and brand reputation.
The slide also includes "Shipments planned vs. actual," which serves as a performance measure to track discrepancies between expected and actual shipment volumes. This metric is vital for identifying inefficiencies in the supply chain and making necessary adjustments to improve reliability.
The visual representation of the "Product Delivery Process" and "Order Fulfillment Process" within an organizational context indicates that these metrics should be embedded within the operational framework. This approach ensures that performance measures are not just standalone indicators, but are integrated into the workflow, allowing for real-time adjustments and continuous improvement.
Overall, the slide provides a clear framework for placing performance measures effectively. It encourages organizations to adopt a holistic view of performance metrics, linking them directly to both operational processes and customer outcomes. This alignment is essential for driving operational excellence and enhancing customer satisfaction.
This PPT slide presents the SCAMPER technique as a structured approach to problem-solving, specifically aimed at enhancing sales processes. It poses a central question: "How can I increase sales in my business?" This question serves as a catalyst for deeper inquiry into various aspects of the sales process.
Each letter of the SCAMPER acronym represents a different method of exploration. Starting with 'S' for Substitute, it encourages the examination of elements within the selling process that could be replaced or altered. 'C' for Combine prompts consideration of integrating selling with other business activities, potentially creating synergies. The 'A' for Adapt suggests looking at successful strategies from other contexts that could be tailored to the current selling approach.
Further, 'M' for Magnify focuses on emphasizing certain aspects of the sales process that may yield better results. 'P' for Put to Other Uses encourages thinking about how selling techniques might be applied in different contexts. 'E' for Eliminate asks what can be removed or simplified, which is crucial for streamlining processes. Lastly, 'R' for Rearrange invites a rethinking of the sequence or structure of the sales approach.
The concluding statement emphasizes that these questions are designed to provoke innovative thinking, pushing individuals to reassess their challenges and discover new solutions. This slide serves as a practical guide for executives looking to enhance their sales strategies through creative problem-solving methodologies.
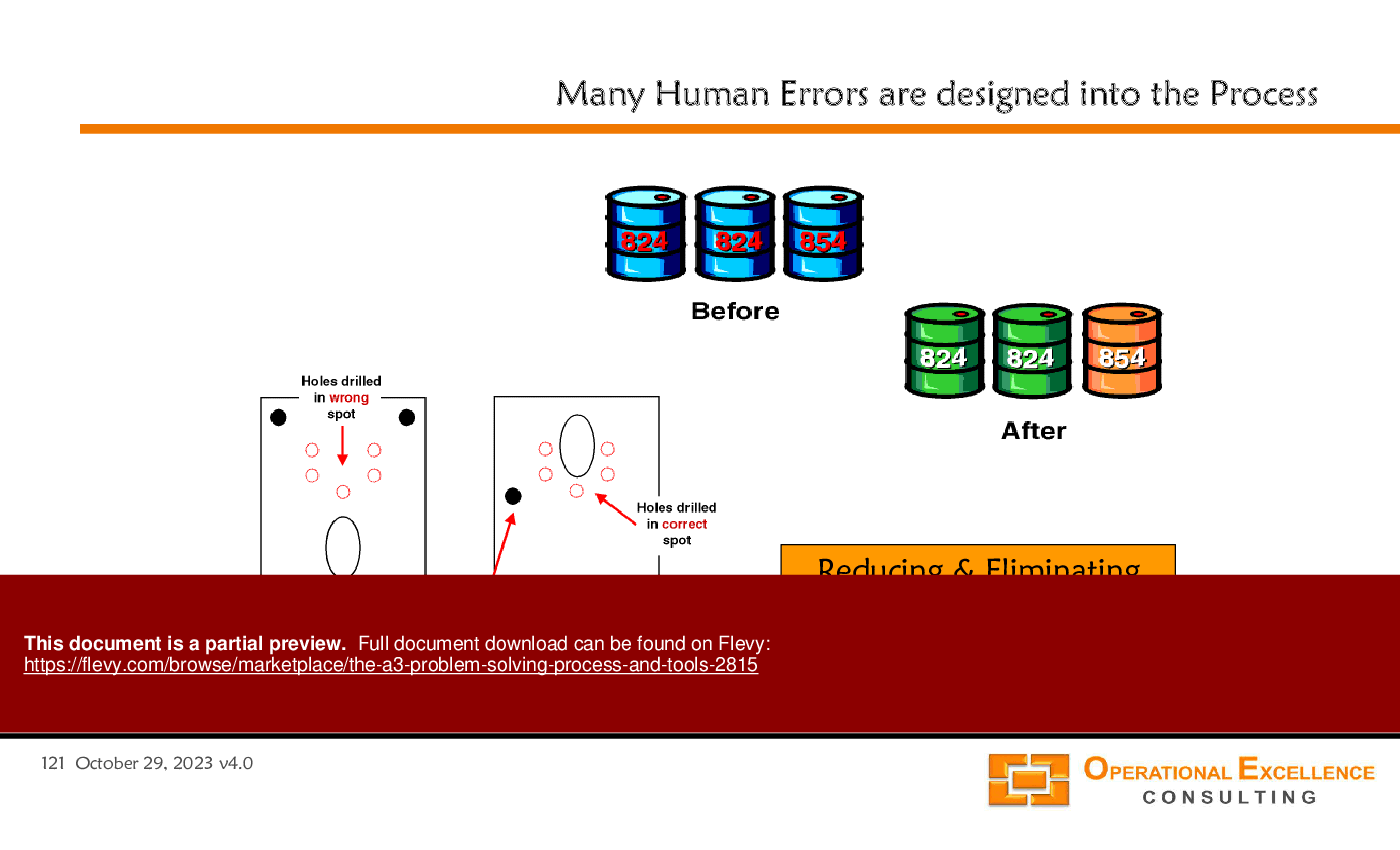
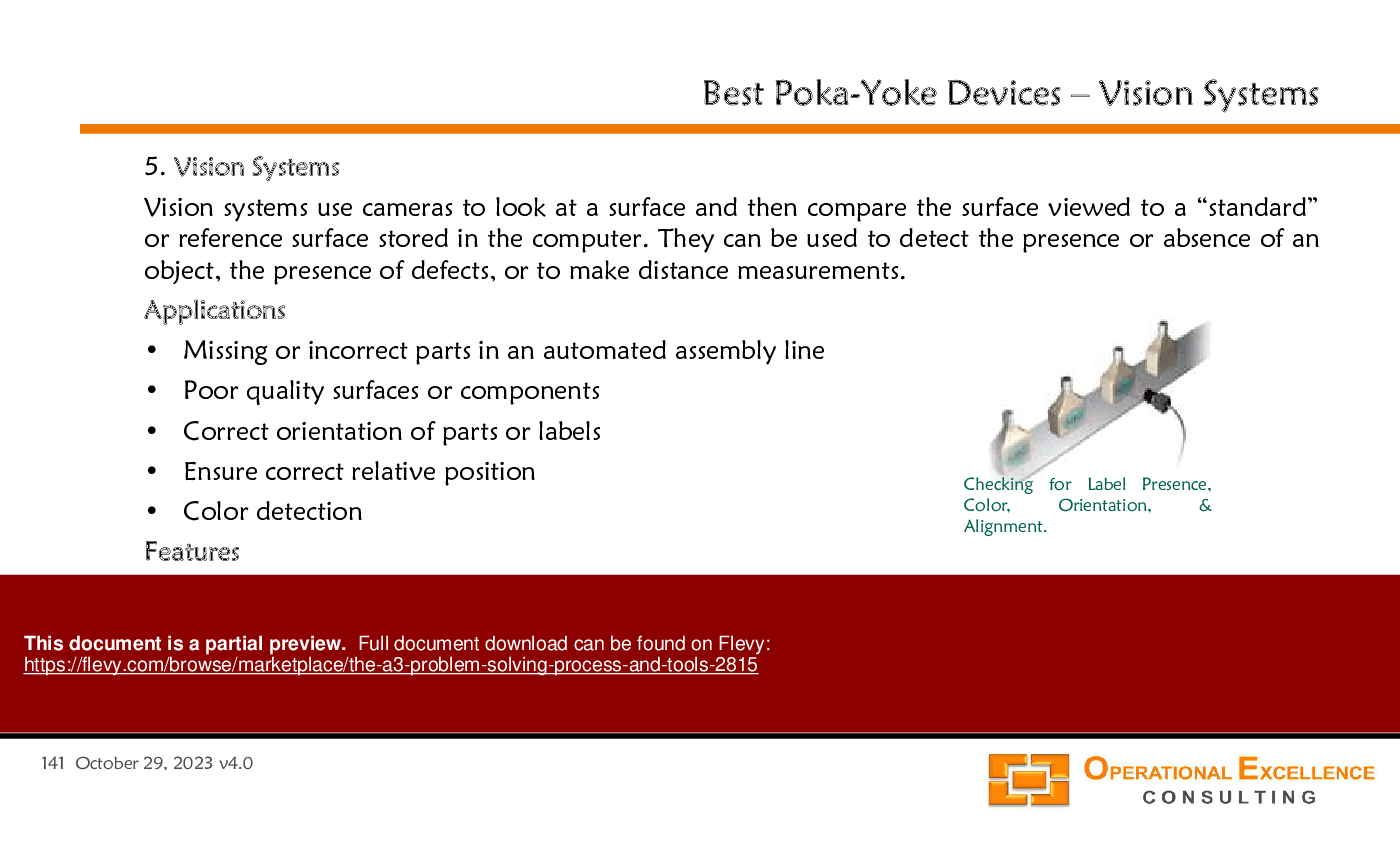
This PPT slide presents a focused discussion on mistake-proofing strategies aimed at reducing human errors in operational processes. The upper section illustrates a welding machine setup, emphasizing the importance of preventing missing weld nuts. It describes a system equipped with a sensor that activates a visual and audio alarm when a nut is not detected. This automatic response halts the process, necessitating corrective action. Such mechanisms are crucial for maintaining quality and efficiency in manufacturing environments.
The lower part of the slide highlights a consumer-friendly approach to mistake-proofing through product design. It suggests that thoughtful design can significantly enhance usability, thereby improving customer satisfaction. This aspect underscores the dual benefit of mistake-proofing: not only does it mitigate errors in production,, but it also elevates the end-user experience.
The reference to "and many more" implies that additional examples or applications of mistake-proofing exist, suggesting a broader range of potential implementations across various industries. This slide effectively communicates the practical applications of mistake-proofing, making it relevant for organizations seeking to enhance operational reliability and customer satisfaction. The insights provided here can guide decision-makers in evaluating the value of integrating mistake-proofing techniques into their processes.
This PPT slide outlines critical scenarios for utilizing the A3 problem-solving methodology, distinguishing between when it is appropriate to use this structured approach and when it is not. On the left side, 3 key reasons to employ an A3 are presented. First, collaboration is emphasized as essential when solving complex problems, highlighting the need for diverse input and perspectives. Second, the slide notes the importance of making thought processes visible, suggesting that clarity in reasoning can enhance understanding and communication among team members. Lastly, it addresses knowledge gaps, indicating that the A3 process can be instrumental in bridging these gaps through systematic analysis and discussion.
Conversely, the right side of the slide delineates situations where the A3 method may be counterproductive. If one already possesses a clear understanding of the root cause and potential solutions, the A3 framework may not add value. Similarly, if there’s a belief that the solution is known and agreed upon by others, the need for an A3 diminishes. The slide also warns against using the A3 process merely as a reporting tool, which could lead to superficial engagement rather than genuine problem-solving.
This slide serves as a practical guide for executives and teams considering the A3 methodology. It encourages thoughtful reflection on the context of problem-solving efforts, ensuring that the A3 approach is applied effectively and not as a default mechanism. Understanding these distinctions can lead to more efficient and impactful problem-solving initiatives.
Developed by a Senior Executive and Operational Excellence Coach with experience at organizations including NOKIA, MICROVENTION, and MAGELLAN, this is a presentation and supporting templates to teach the A3 Problem Solving Process.
Operational Excellence Consulting LLC provides assessments, training solutions, kaizen event facilitation, and implementation support to enable our clients to achieve superior performance through Operational Excellence - Strategy Deployment & Hoshin Planning, Performance Management & Balanced Scorecards, Process Excellence & Lean Six Sigma, and High
... [read more] Performance Work Teams.
Frank Adler co-founded OEC LLC in 2009 to follow his passion for Operational Excellence and to be able to work with individuals and organizations that share this passion.
He is an accomplished and recognized Operational Excellence, Lean Management, and Six Sigma coach, with over 20 years of domestic and international executive leadership experience in General Management, multi-site Operations & Supply Chain Management, and Quality & Customer Support Management.
Frank is a certified and experienced Lean Six Sigma Master Black Belt with a proven track record of implementing these methods, concepts, and tools in various organizations and industries.
He holds a Master of Science in Mathematics & Physics from the Freie University of Berlin (Germany) and a Doctor of Philosophy in Applied Mathematics & Industrial Economics from the Helsinki University of Technology (Finland).
Since 2012, we have provided best practices to over 10,000 businesses and organizations of all sizes, from startups and small businesses to the Fortune 100, in over 130 countries.
Read Customer Testimonials
"One of the great discoveries that I have made for my business is the Flevy library of training materials.
As a Lean Transformation Expert, I am always making presentations to clients on a variety of topics: Training, Transformation, Total Productive Maintenance, Culture, Coaching, Tools, Leadership Behavior, etc. Flevy
It is well worth the money to purchase these presentations. Sure, I have the knowledge and information to make my point. It is another thing to create a presentation that captures what I want to say. Flevy has saved me countless hours of preparation time that is much better spent with implementation that will actually save money for my clients.
"
– Ed Kemmerling, Senior Lean Transformation Expert at PMG
"[Flevy] produces some great work that has been/continues to be of immense help not only to myself, but as I seek to provide professional services to my clients, it gives me a large "tool box" of resources that are critical to provide them with the quality of service and outcomes they are expecting."
– Royston Knowles, Executive with 50+ Years of Board Level Experience
"I have used FlevyPro for several business applications. It is a great complement to working with expensive consultants. The quality and effectiveness of the tools are of the highest standards."
– Moritz Bernhoerster, Global Sourcing Director at Fortune 500
"I have found Flevy to be an amazing resource and library of useful presentations for lean sigma, change management and so many other topics. This has reduced the time I need to spend on preparing for my performance consultation. The library is easily accessible and updates are regularly provided. A wealth of great information."
– Cynthia Howard RN, PhD, Executive Coach at Ei Leadership
"Flevy is our 'go to' resource for management material, at an affordable cost. The Flevy library is comprehensive and the content deep, and typically provides a great foundation for us to further develop and tailor our own service offer."
– Chris McCann, Founder at Resilient.World
"As a consulting firm, we had been creating subject matter training materials for our people and found the excellent materials on Flevy, which saved us 100's of hours of re-creating what already exists on the Flevy materials we purchased."
– Michael Evans, Managing Director at Newport LLC
"Last Sunday morning, I was diligently working on an important presentation for a client and found myself in need of additional content and suitable templates for various types of graphics. Flevy.com proved to be a treasure trove for both content and design at a reasonable price, considering the time I
saved. I encountered a download issue during the ordering process. However, a quick email to Flevy's support team, even on a Sunday (!!!), resulted in assistance within less than an hour, allowing me to download the content I needed. Fantastic job, Flevy! I give 5 stars for both content/price and customer service. Thank you!
"
– M. E., Chief Commercial Officer, International Logistics Service Provider
"Flevy.com has proven to be an invaluable resource library to our Independent Management Consultancy, supporting and enabling us to better serve our enterprise clients.
The value derived from our [FlevyPro] subscription in terms of the business it has helped to gain far exceeds the investment made, making a subscription a no-brainer for any growing consultancy – or in-house strategy team."
– Dean Carlton, Chief Transformation Officer, Global Village Transformations Pty Ltd.
Save with Bundles
This document is available as part of the following discounted bundle(s):
Receive our FREE whitepaper on the Top 101 Consulting Frameworks
Download our 200+ page guide summarizing the Top 101 Management Consulting Frameworks. Each framework provides a structured approach to analyzing and solving a common business problem.