
 Click main image to view in full screen.
Statistical Process Control (SPC) Training – PowerPoint PPTX Template
PowerPoint (PPTX) 77 Slides


BENEFITS OF THIS DOWNLOADABLE POWERPOINT DOCUMENT
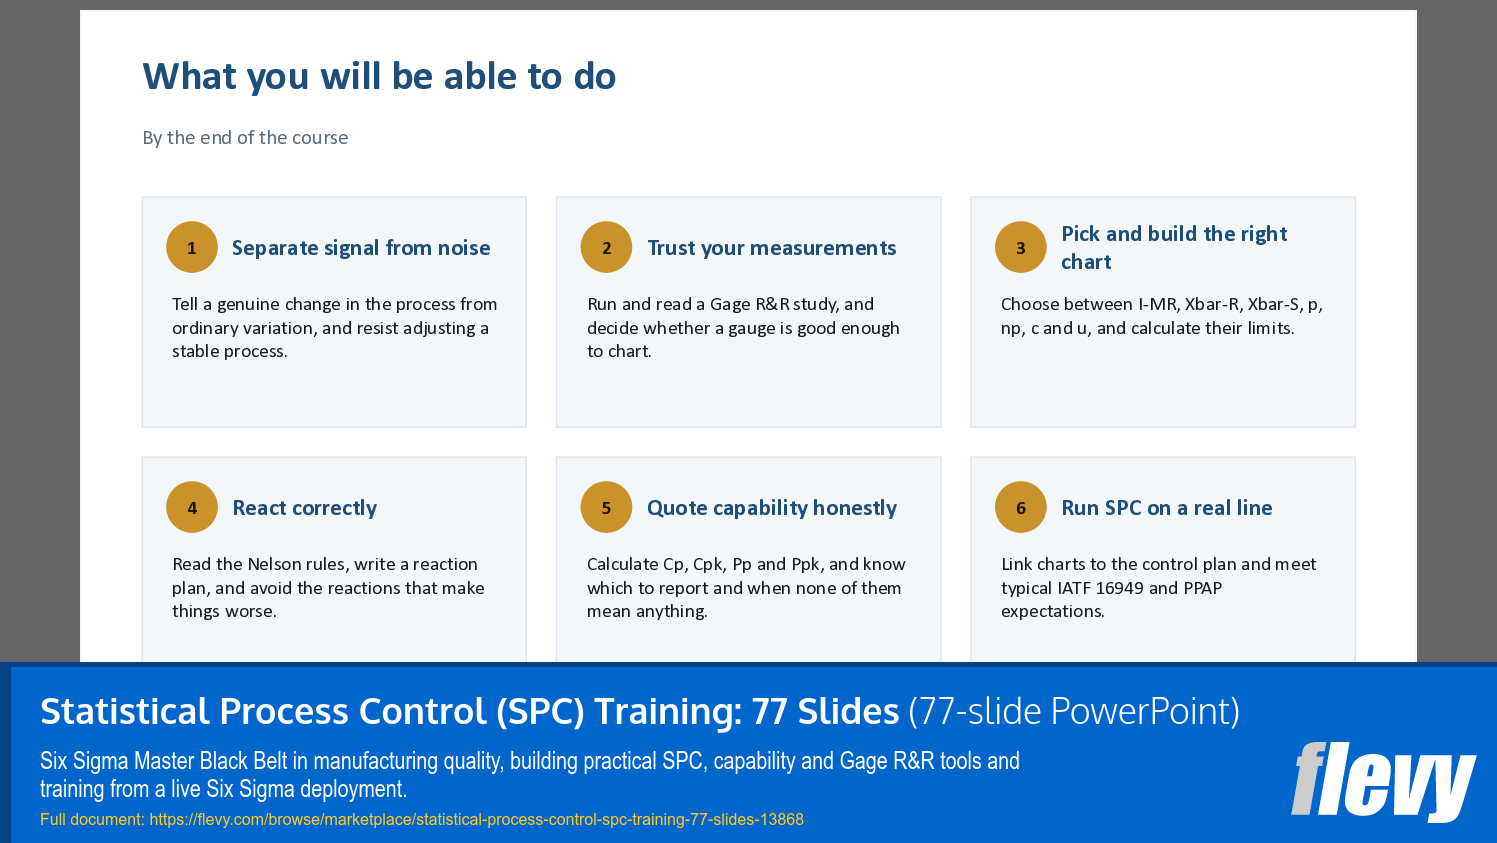
- Teach SPC that sticks. Ten exercises with a full answer key, so participants apply every module instead of just watching it, and you can see who has understood.
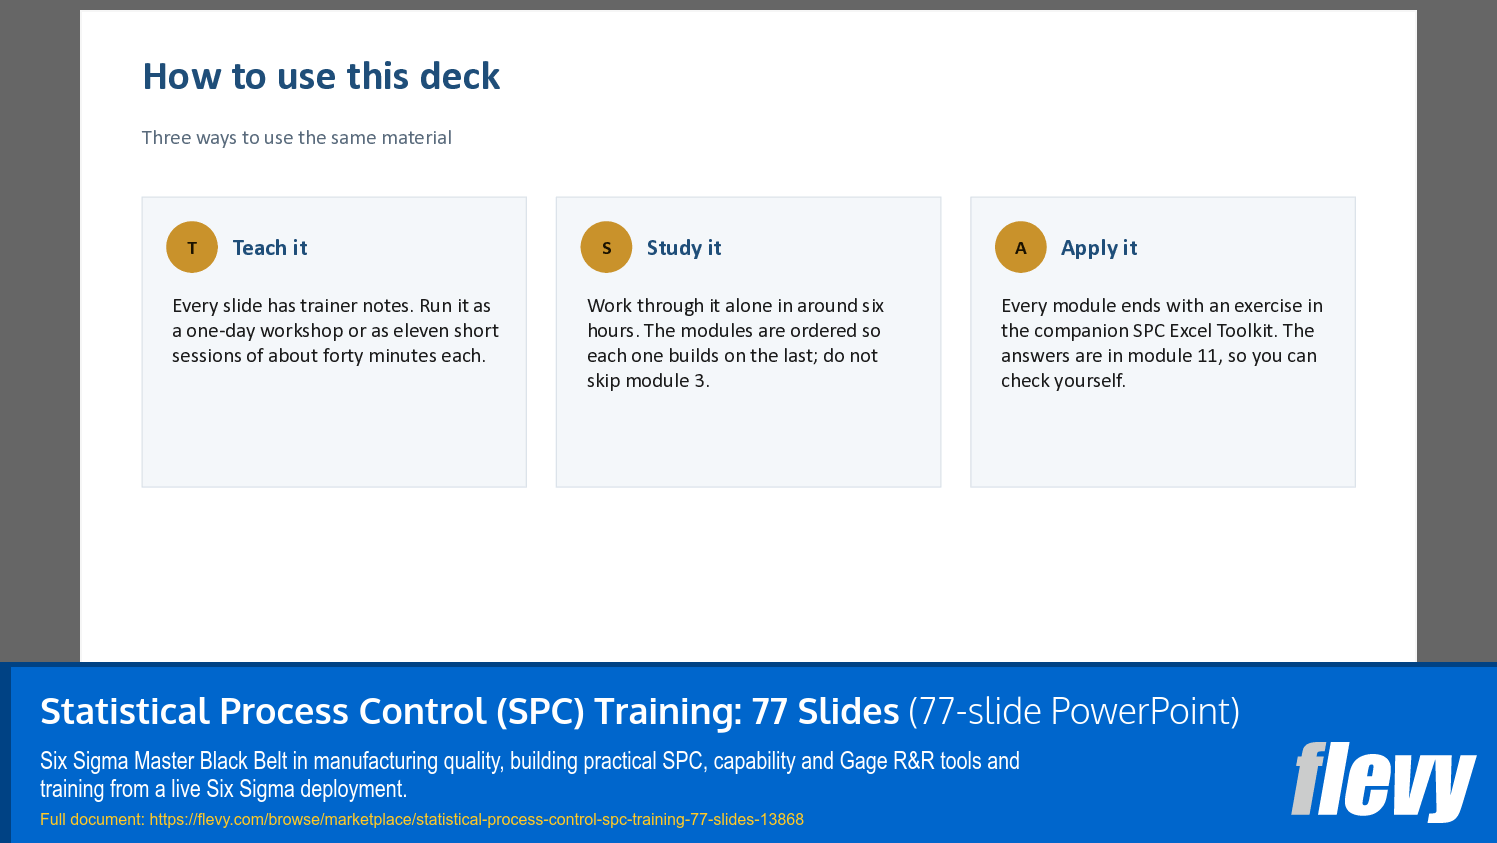
- Deliver it without rewriting it. Trainer notes on every slide, editable native charts, and a module structure that works as a one-day workshop or eleven short sessions.
- Cover what auditors actually ask about. Measurement system first, written reaction plans, the control plan link, and typical IATF 16949 and PPAP capability expectations.
EMPLOYEE TRAINING PPT TEMPLATE DESCRIPTION
Most SPC training explains control charts and stops there. Participants leave knowing the vocabulary and still unable to choose the right chart, build it, or decide what to do when a point goes out. This course is built the other way round: every module ends with a hands-on exercise, and the answer key gives the exact figures, so learning is checked rather than assumed.
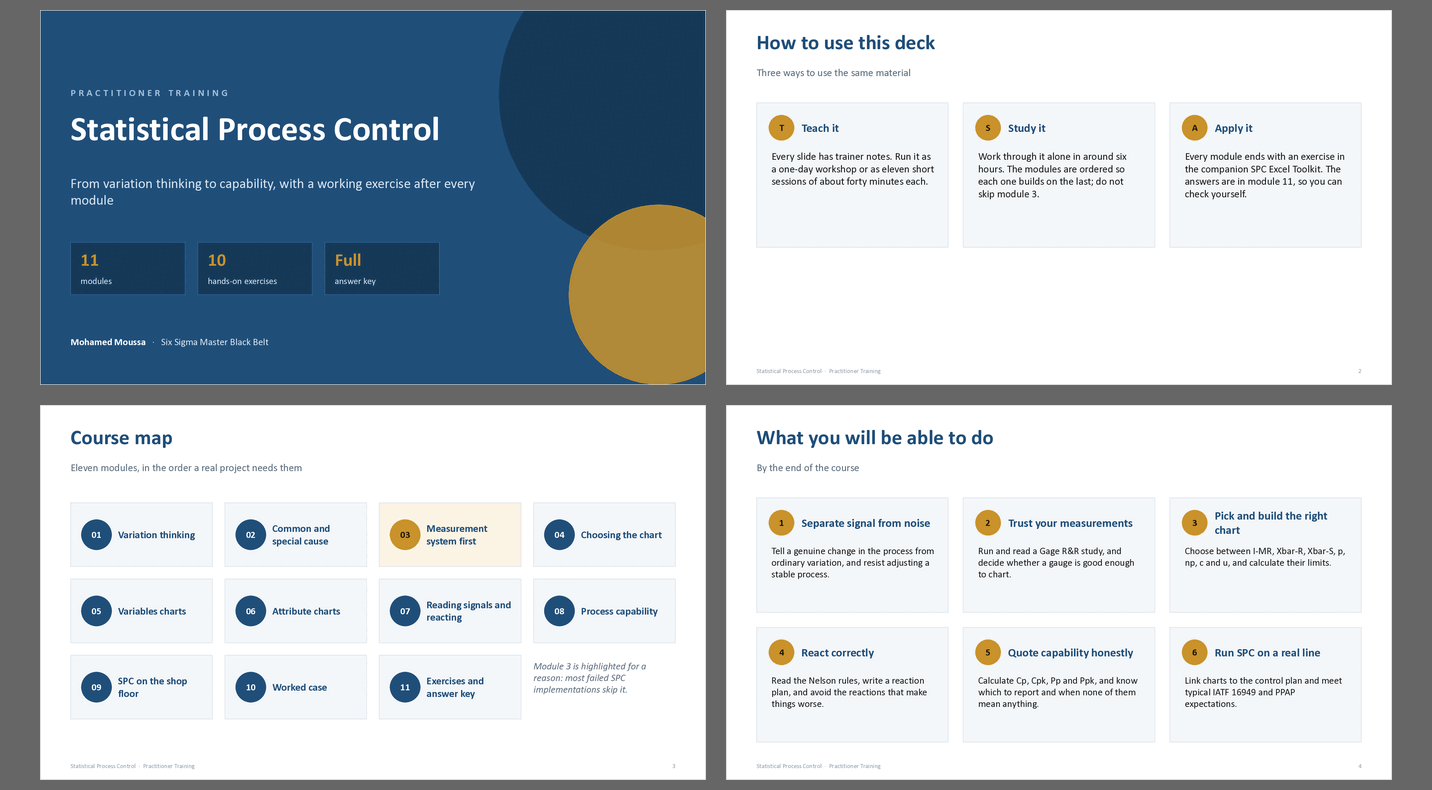
77 slides in eleven modules, written at Green Belt level for quality engineers, production supervisors and improvement practitioners. Trainer notes on every slide, so someone other than the author can teach it.
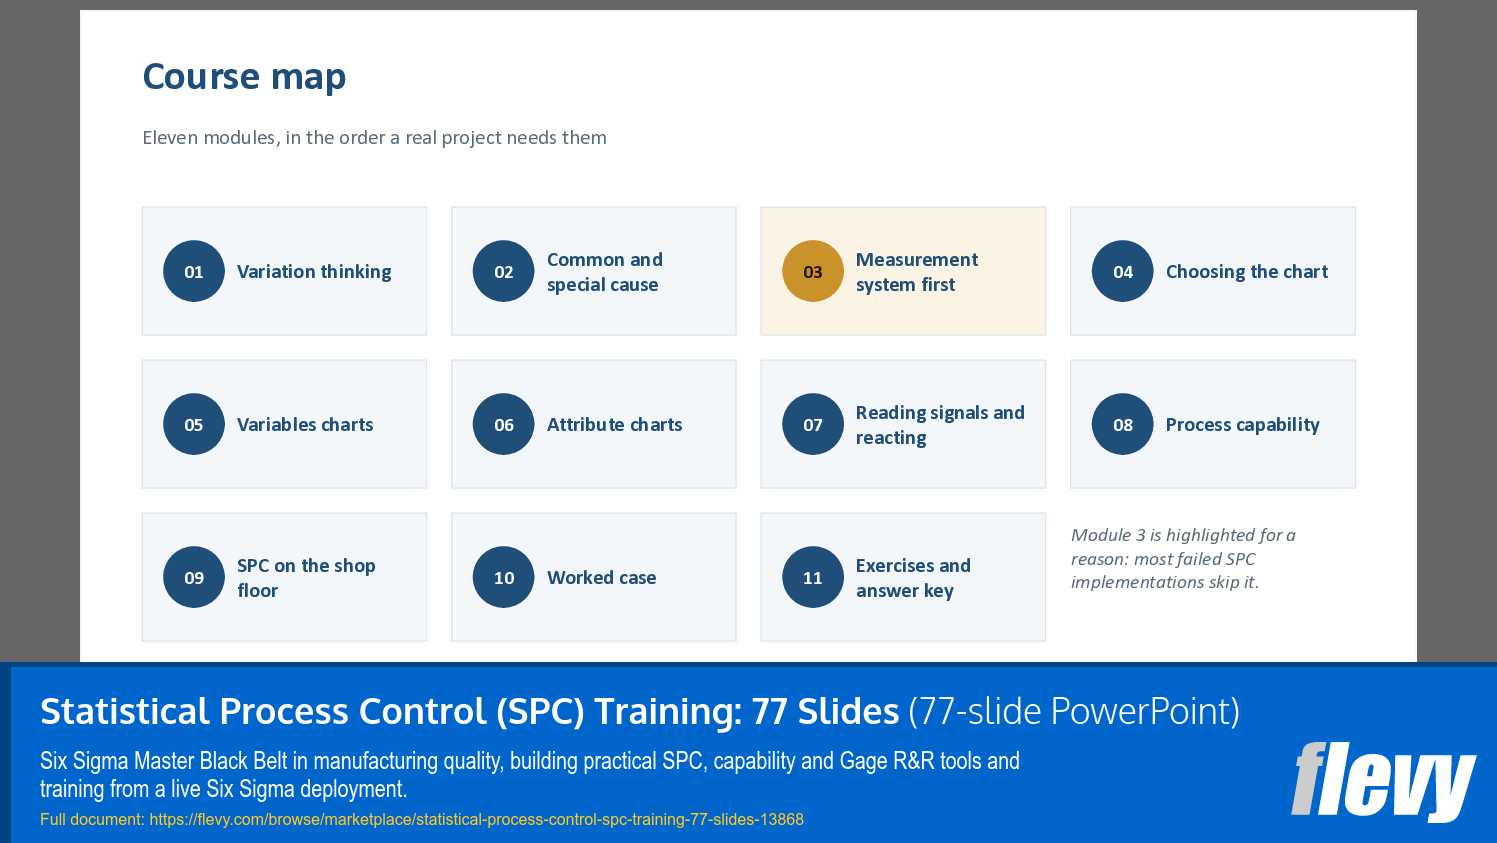
THE ELEVEN MODULES
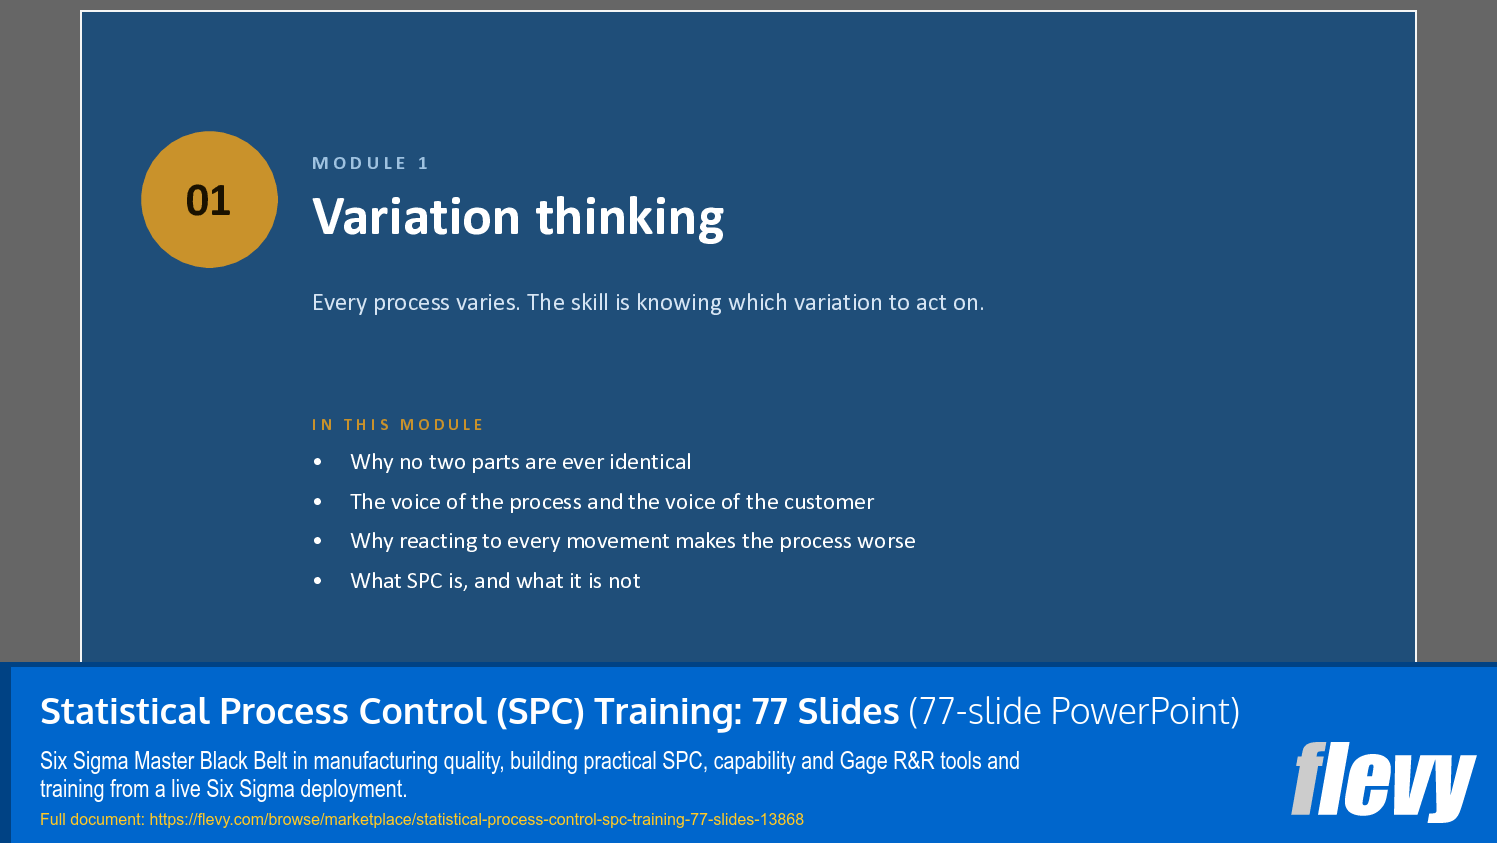
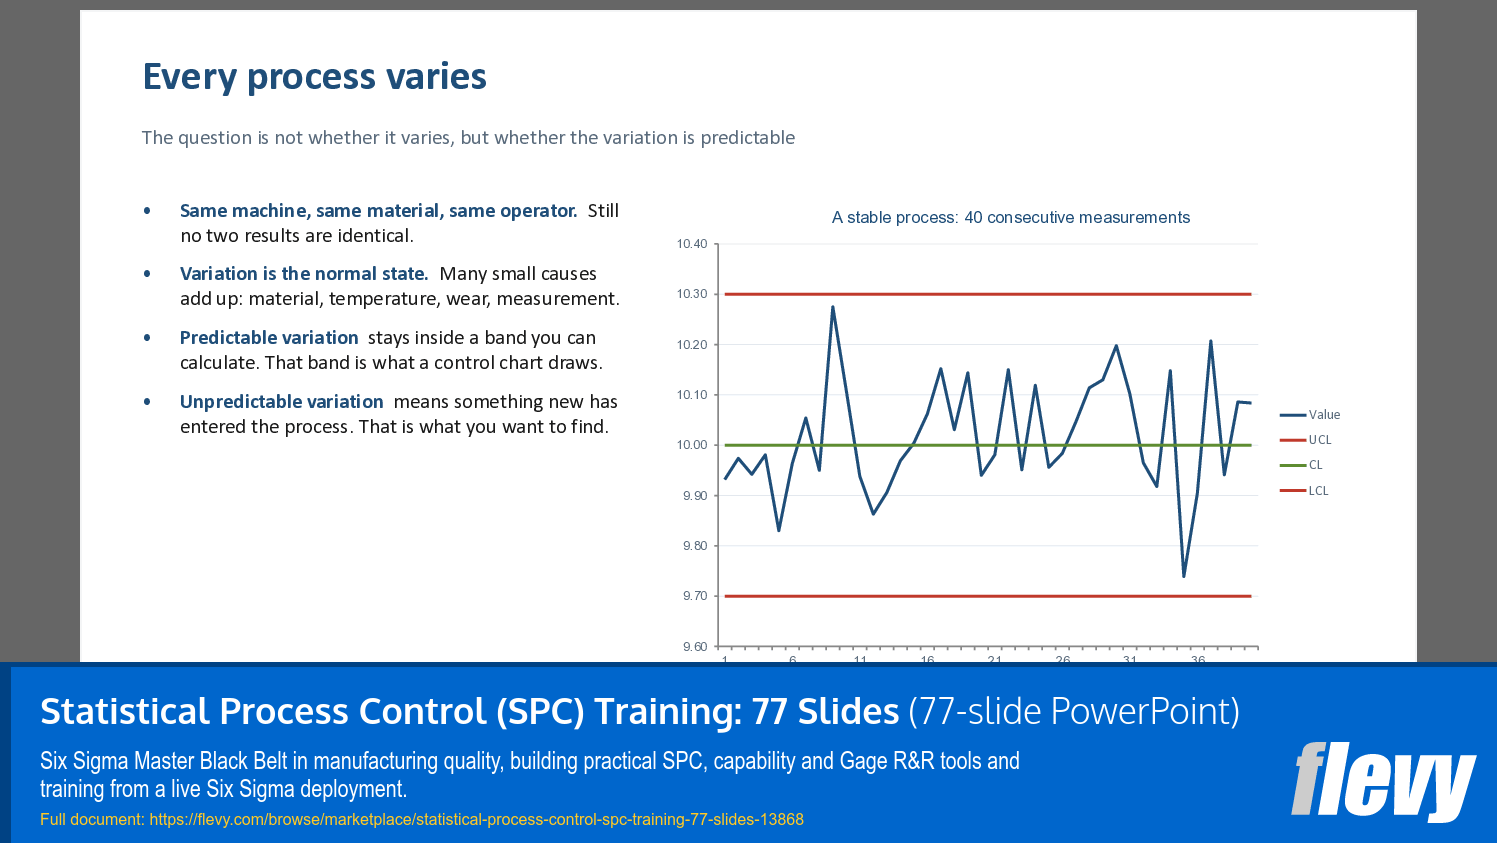
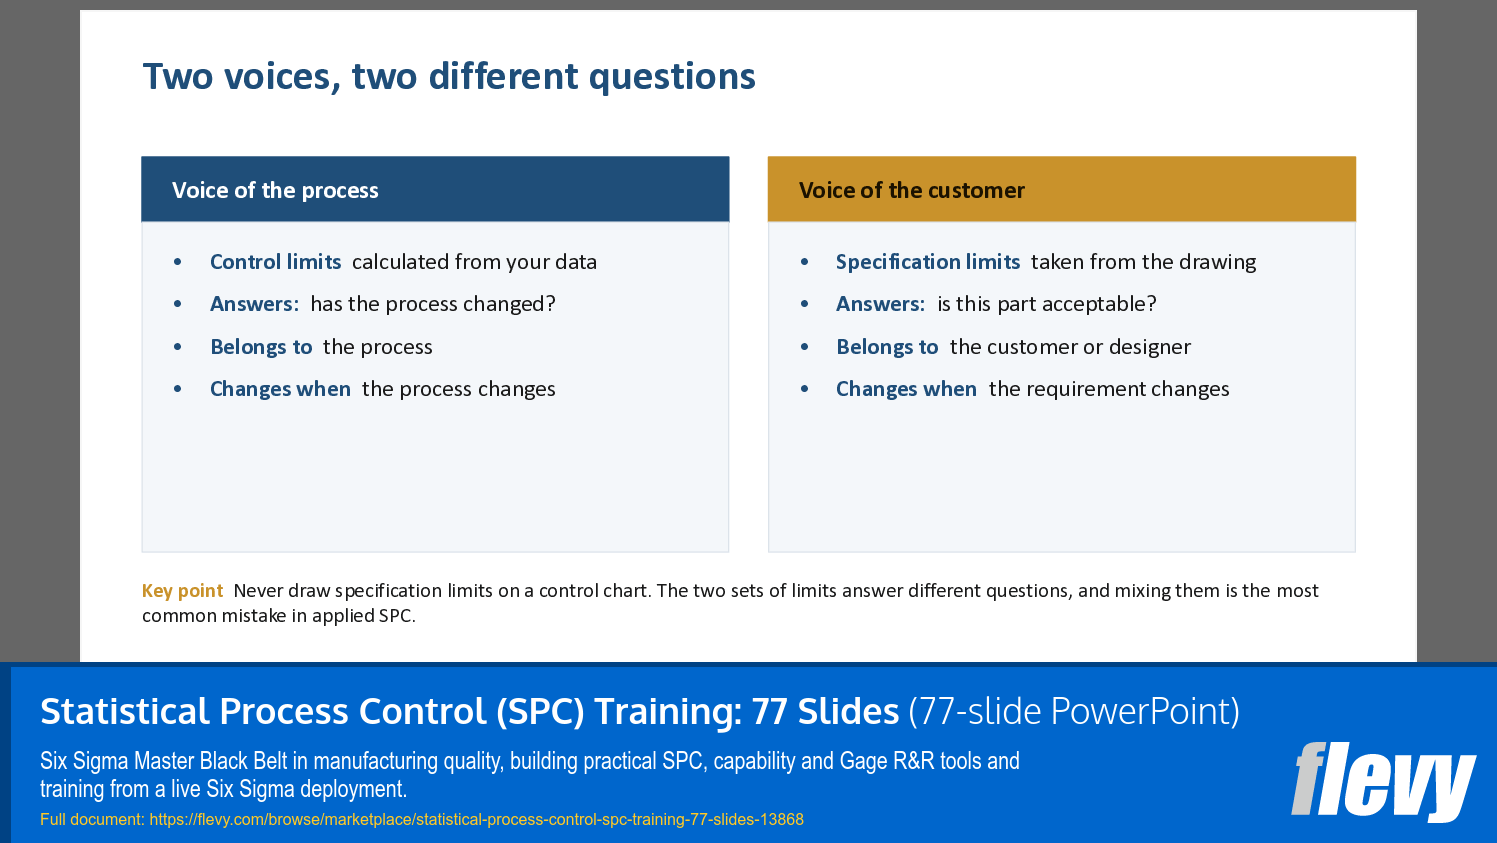
1 Variation thinking. The voice of the process against the voice of the customer, and why adjusting a stable process makes it worse, demonstrated with Deming's funnel.
2 Common and special cause. Examples from all six M sources, the two classic mistakes, and stable versus capable.
3 Measurement system first. Bias, linearity, stability, repeatability and reproducibility; the average and range Gage R&R method step by step; acceptance criteria and how to read a real result.
4 Choosing the chart. A decision tree for I-MR, Xbar-R, Xbar-S, p, np, c and u, and rational subgrouping.
5 Variables charts. Formulas and constants, why you read the spread chart first, Phase I and Phase II, and the errors that make limits meaningless.
6 Attribute charts. Defectives against defects, the p, np, c and u formulas, and why p chart limits move.
7 Reading signals and reacting. The eight Nelson rules, the false alarm cost of each rule set, three signal patterns to recognise on sight, and a written reaction plan.
8 Process capability. Cp, Cpk, Pp and Ppk, what the numbers mean in parts per million, the gap between short and long term, and the normality assumption.
9 SPC on the shop floor. Which characteristics to chart, typical IATF 16949 and PPAP expectations, the control plan link, and the audit questions that reveal whether SPC is real.
10 Worked case. One shaft diameter taken from gauge study to control chart to capability to actions.
11 Exercises and answer key. Answers to all ten exercises, model answers for the open ones, and eight principles to take away.
WHY IT IS DIFFERENT
The control charts are native PowerPoint charts, not pictures, so you can change the data. The difficult points most decks avoid are covered directly: why a Cpk from an unstable process means nothing, why switching on more Nelson rules costs you false alarms, when to quote Ppk instead of Cpk, and why a gauge can pass against study variation and fail against tolerance.
Eight of the ten exercises are done in the SPC Excel Toolkit, sold separately or together with this deck as a bundle. The other two are a discussion and a written reaction plan.
FORMAT
PowerPoint (.pptx), 16:9, 77 slides, trainer notes on every slide, native editable charts, no macros. Runs as a one-day workshop or as eleven sessions of about forty minutes.
Got a question about the product? Email us at support@flevy.com or ask the author directly by using the "Ask the Author a Question" form. If you cannot view the preview above this document description, go here to view the large preview instead.
Source: Best Practices in Employee Training, SPC PowerPoint Slides: Statistical Process Control (SPC) Training PowerPoint (PPTX) Presentation Slide Deck, Moussa | Six Sigma Tools & Training




























