
Six Sigma - Sampling Plans & Sample Sizes (PowerPoint PPTX Slide Deck)
PowerPoint (PPTX) + (XLS) 120 Slides
BENEFITS OF THIS POWERPOINT DOCUMENT
- Determine Sample Sizes for Estimating One Parameter
- Hypothesis Testing & Sample Sizes for One Parameter
- Hypothesis Testing & Sample Sizes for Comparing Two Parameters
SIX SIGMA PROJECT PPT DESCRIPTION
The Six Sigma Sampling & Sample SizesTraining Module v1.0 includes:
1. MS PowerPoint Presentation including 120 slides covering
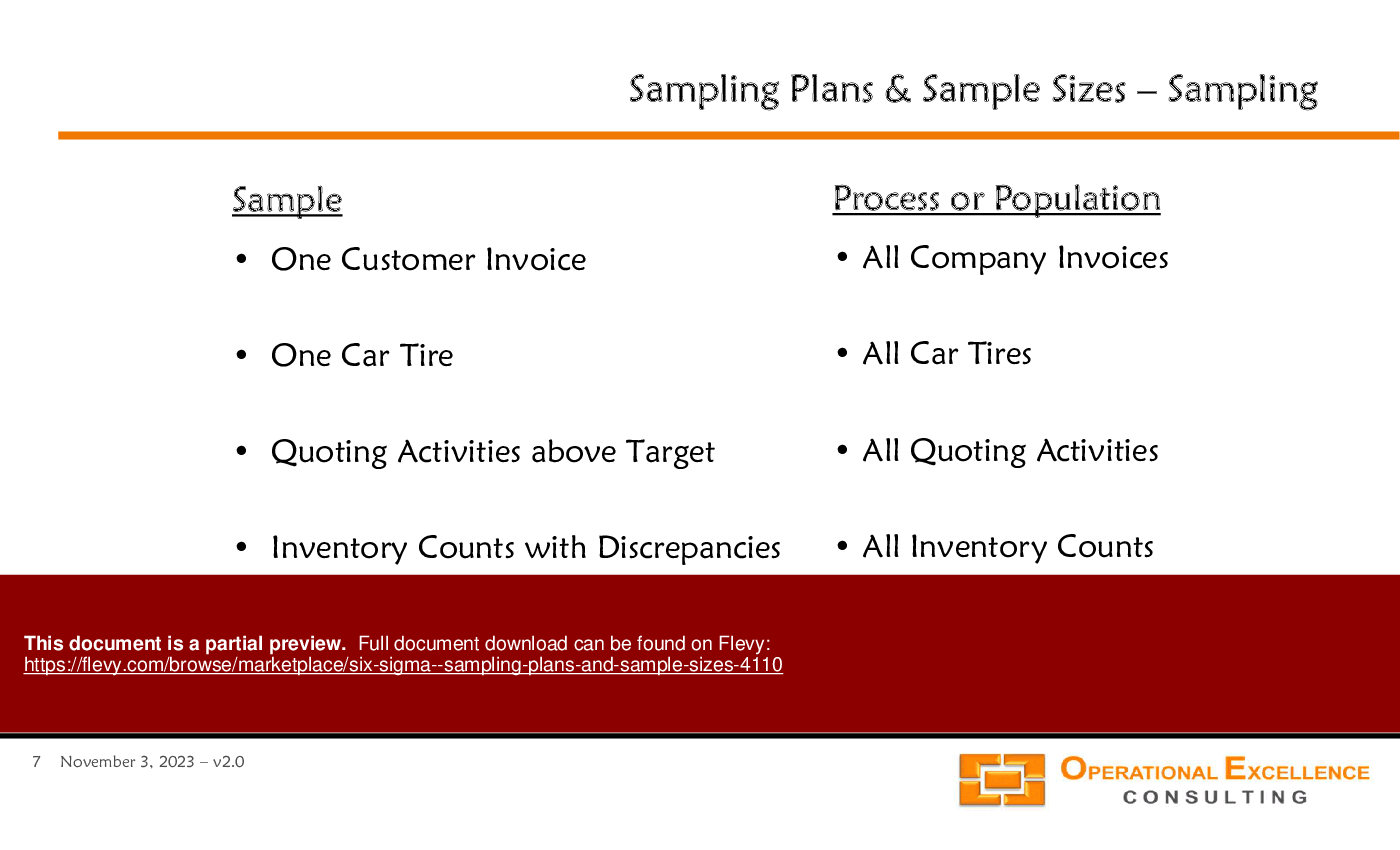
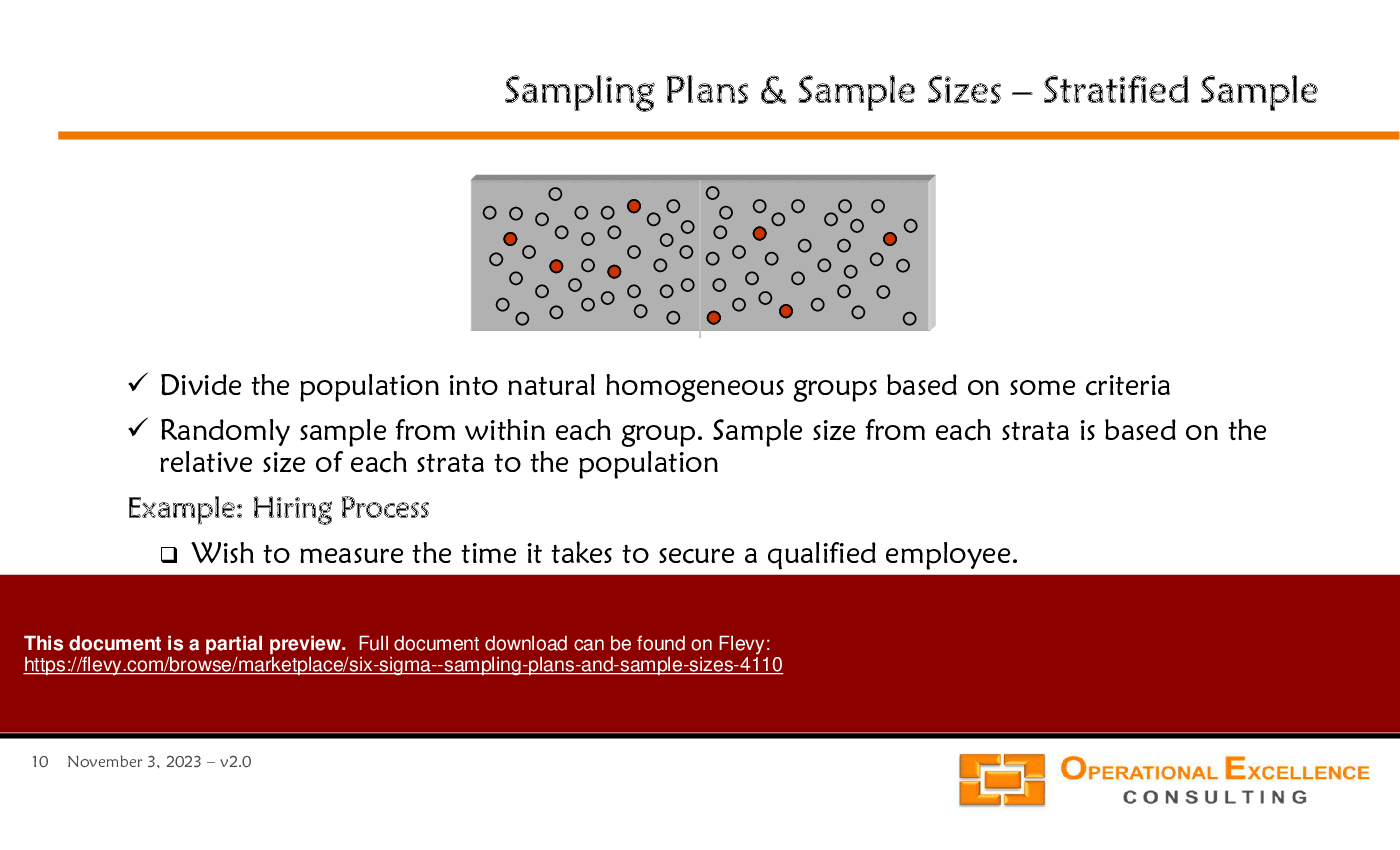
• Sampling Plans (Simple Random Sampling, Stratified Sampling, Cluster Sampling, Systematic Sampling, Subgroup Sampling),
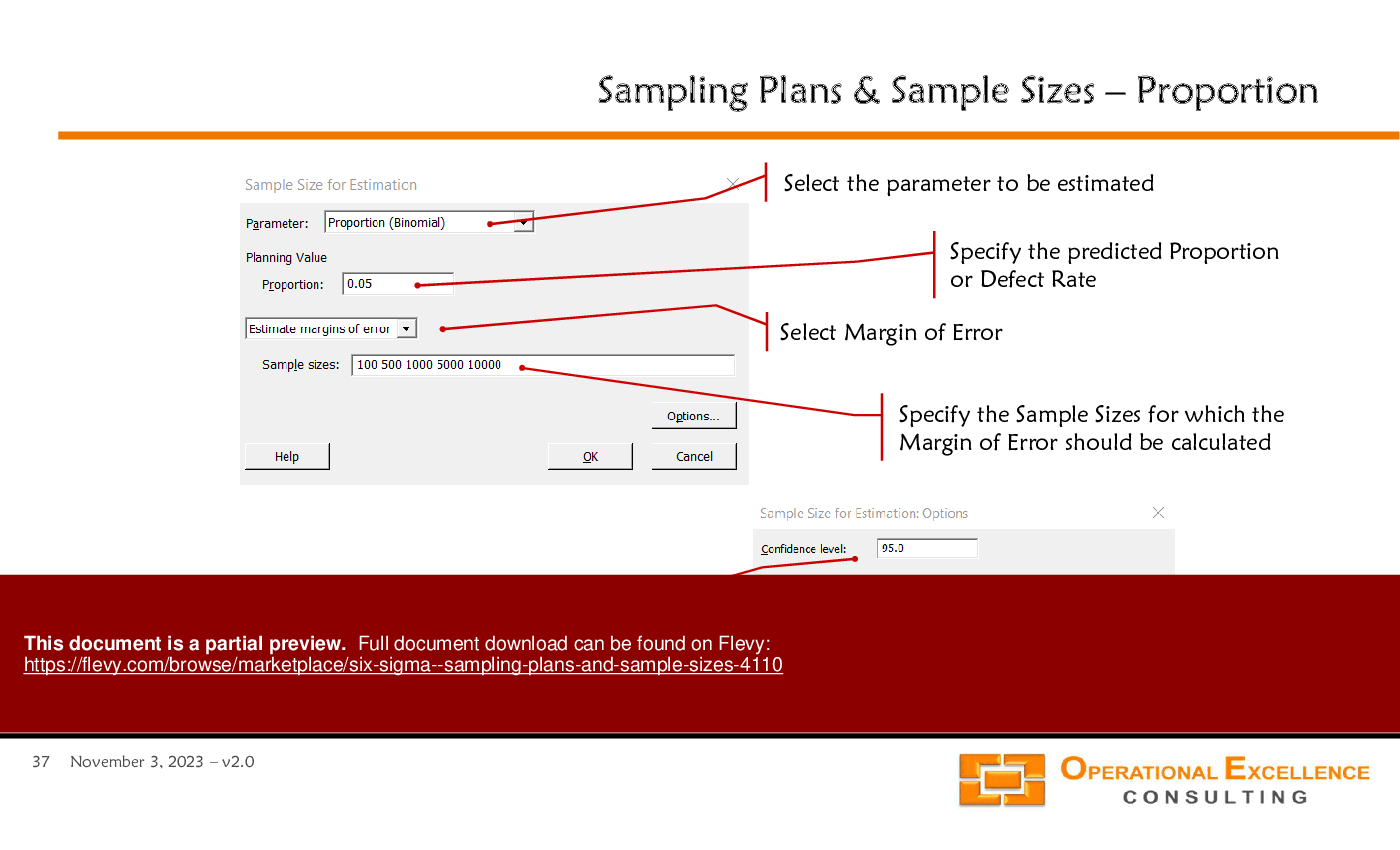
• Sample Sizes for Estimating One Parameter,
• Introduction to Hypothesis Testing,
• Hypothesis Testing & Sample Sizes for One Parameter,
• Hypothesis Testing & Sample Sizes for Comparing Two Parameters, and
• Hypothesis Testing & Sample Sizes for Design of Experiments (DOE).
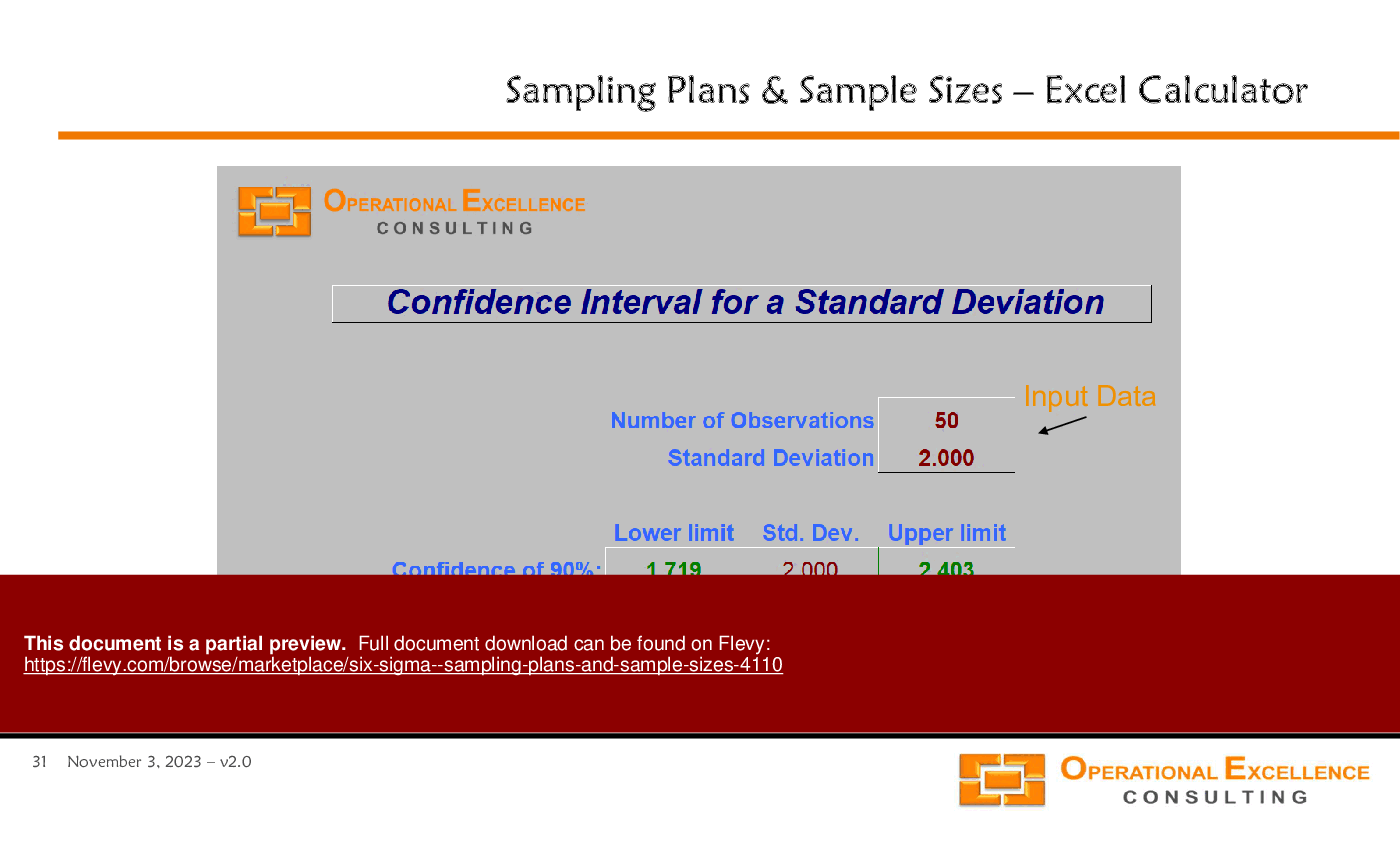
2. MS Excel Six Sigma Confidence Interval Analysis Calculator making it really easy to calculate Confidence Intervals (mean value, standard deviation, capability indices, proportions, count) and perform a Comparison of two Statistics (mean values, standard deviations, proportions, counts).
Note: The material is based on Minitab 19. Please visit their website to download a 30-day free trial license.
"After you have downloaded the training material, you can change any part of the training material and remove all logos and references to Operational Excellence Consulting. You can share the material with your colleagues and clients, and re-use it as you need. The only restriction is that you cannot publicly re-distribute, sell, rent or license the material as though it is your own. Thank you."
Got a question about the product? Email us at support@flevy.com or ask the author directly by using the "Ask the Author a Question" form. If you cannot view the preview above this document description, go here to view the large preview instead.
Source: Best Practices in Six Sigma Project PowerPoint Slides: Six Sigma - Sampling Plans & Sample Sizes PowerPoint (PPTX) Presentation Slide Deck, Operational Excellence Consulting LLC
SIX SIGMA PROJECT PPT SLIDES

ABOUT THE AUTHOR
Operational Excellence Consulting LLC (OEC LLC) provides assessments, training solutions, kaizen event facilitation, and implementation support to enable our clients to achieve superior performance through Operational Excellence - Strategy Deployment & Hoshin Planning, Performance Management & Balanced Scorecards, Process Excellence & Lean Six Sigma, and ... [read more]
Ask the Author a Question
You must be logged in to contact the author.
This document is available as part of the following discounted bundle(s):
Save %!
OPERATIONAL EXCELLENCE Training Module Library
This bundle contains 18 total documents. See all the documents to the right.
Save %!
SIX SIGMA METHODOLOGY Training Module Library
This bundle contains 7 total documents. See all the documents to the right.
