Want FREE Templates on Organization, Change, & Culture? Download our FREE compilation of 50+ slides. This is an exclusive promotion being run on LinkedIn.

Sales Pipeline Tracker - Funnel and Gauge Visualizations   Excel template (XLSX)
$45.00

Sales Pipeline Tracker - Funnel and Gauge Visualizations (Excel template (XLSX)) Preview Image Sales Pipeline Tracker - Funnel and Gauge Visualizations (Excel template (XLSX)) Preview Image Sales Pipeline Tracker - Funnel and Gauge Visualizations (Excel template (XLSX)) Preview Image Sales Pipeline Tracker - Funnel and Gauge Visualizations (Excel template (XLSX)) Preview Image Sales Pipeline Tracker - Funnel and Gauge Visualizations (Excel template (XLSX)) Preview Image Sales Pipeline Tracker - Funnel and Gauge Visualizations (Excel template (XLSX)) Preview Image
Arrow   Unlock all preview images:   Login Register

Sales Pipeline Tracker - Funnel and Gauge Visualizations (Excel XLSX)

File Type: Excel template (XLSX)

$45.00
This financial model was crafted by a Financial Modeler and Accountant with over 10+ years of global experience. He has served 750+ clients, from small family offices to billion-dollar corporations, across a multitude of industries.
Add to Cart


BUY WITH CONFIDENCE

Immediate digital download upon purchase.
Lifetime document updates included with purchase.
Fully editable & customizable XLSX document.
Trusted by over 10,000+ organizations.

DESCRIPTION

This product (Sales Pipeline Tracker - Funnel and Gauge Visualizations) is an Excel template (XLSX), which you can download immediately upon purchase.

Being able to see a quick snapshot of your current customer pipeline is vital for decision making. This template gives you the structure to enter data and adjust customer status / values as they change. Don't fly blind, use this easy tracker to start quantifying how much is on the table. It will help you know where you are on goals.

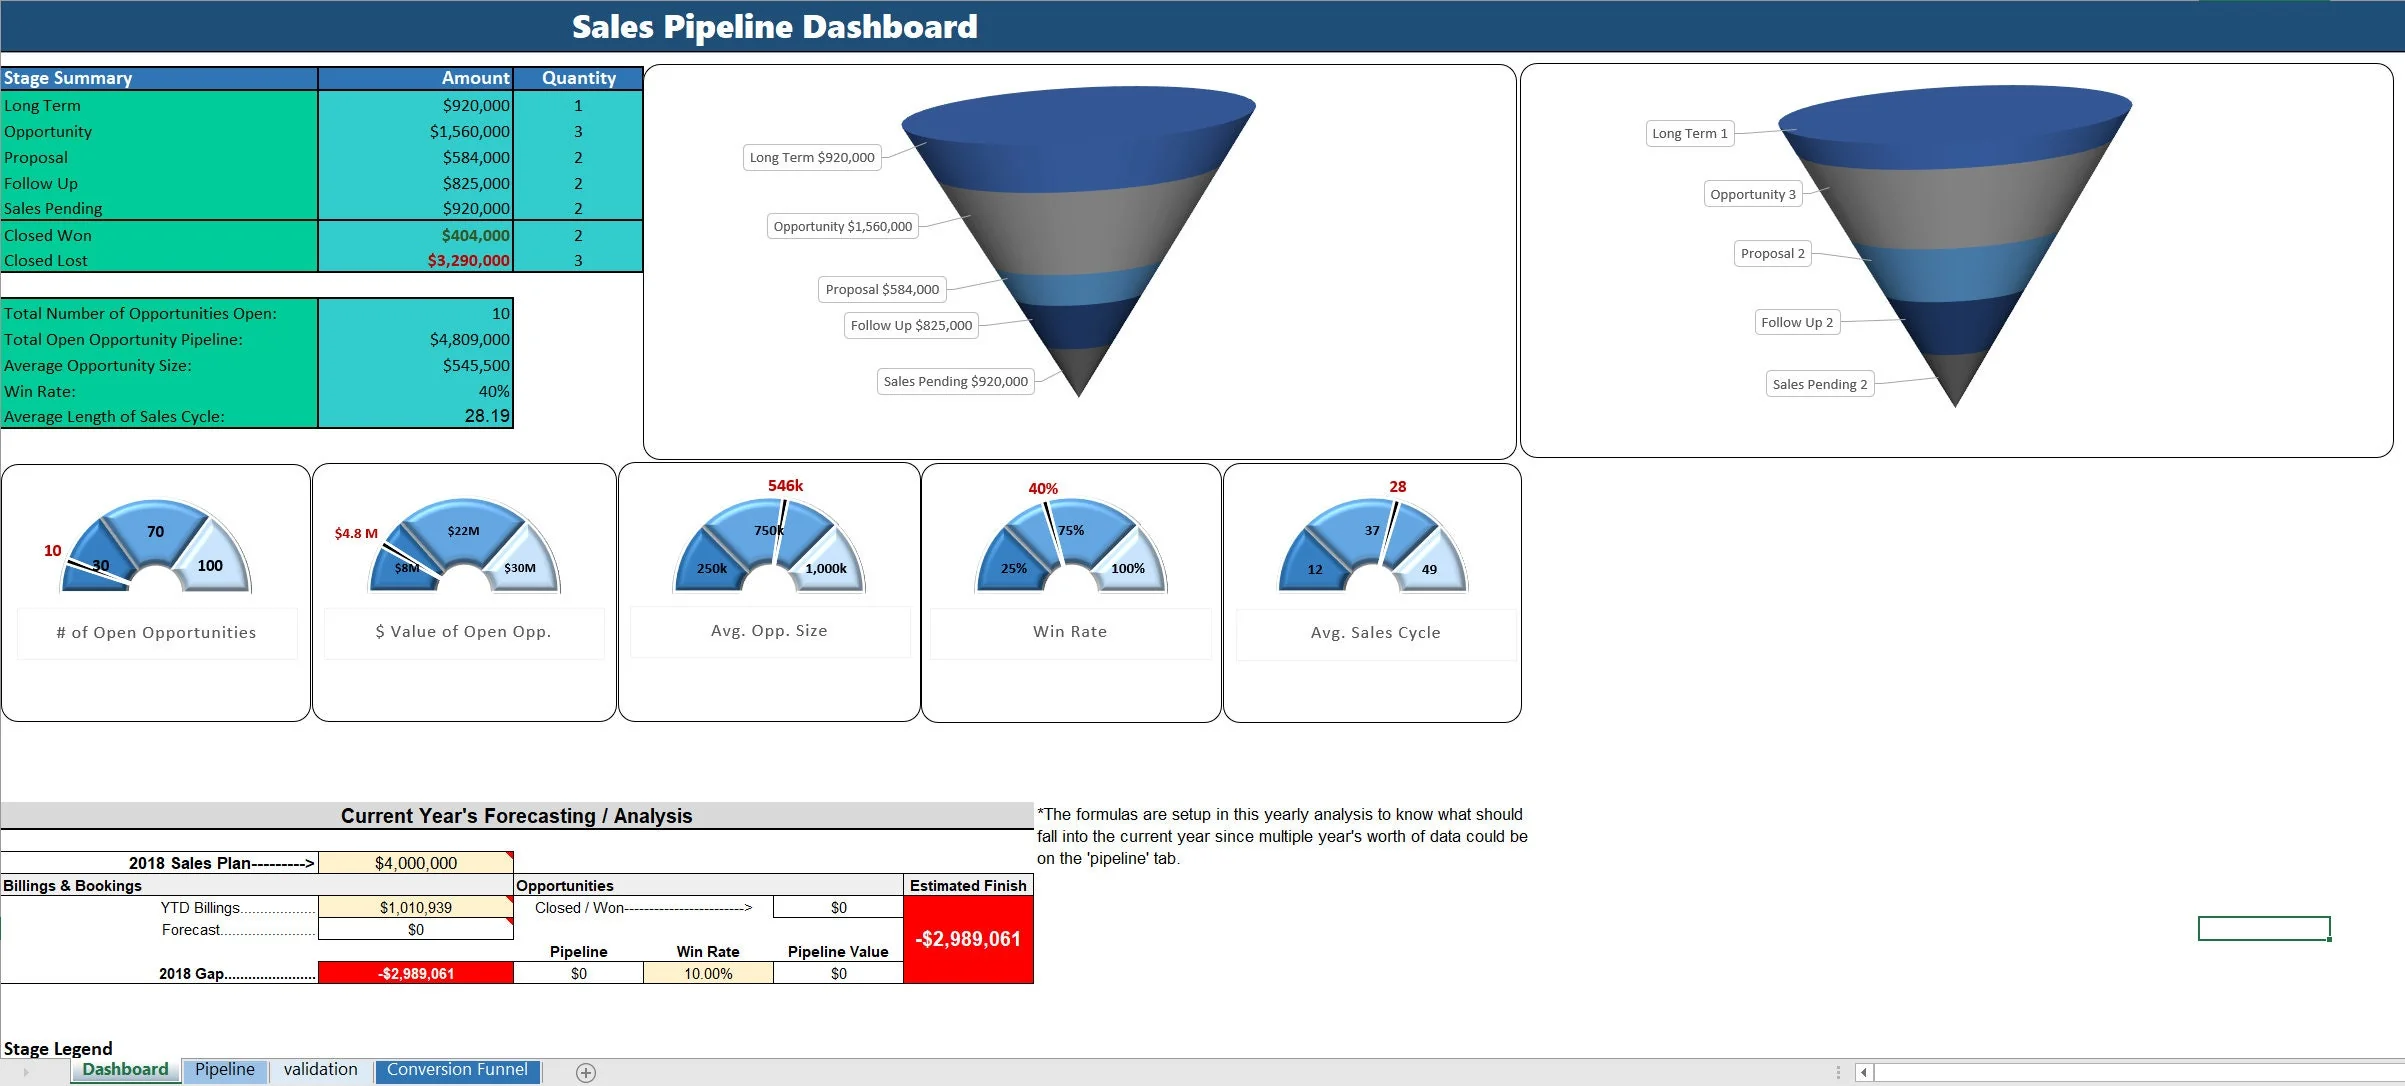
This is a sales pipeline dashboard that lets an organization track their real time data for customer funnel status. There are 5 configurable status types as well as won/lost.

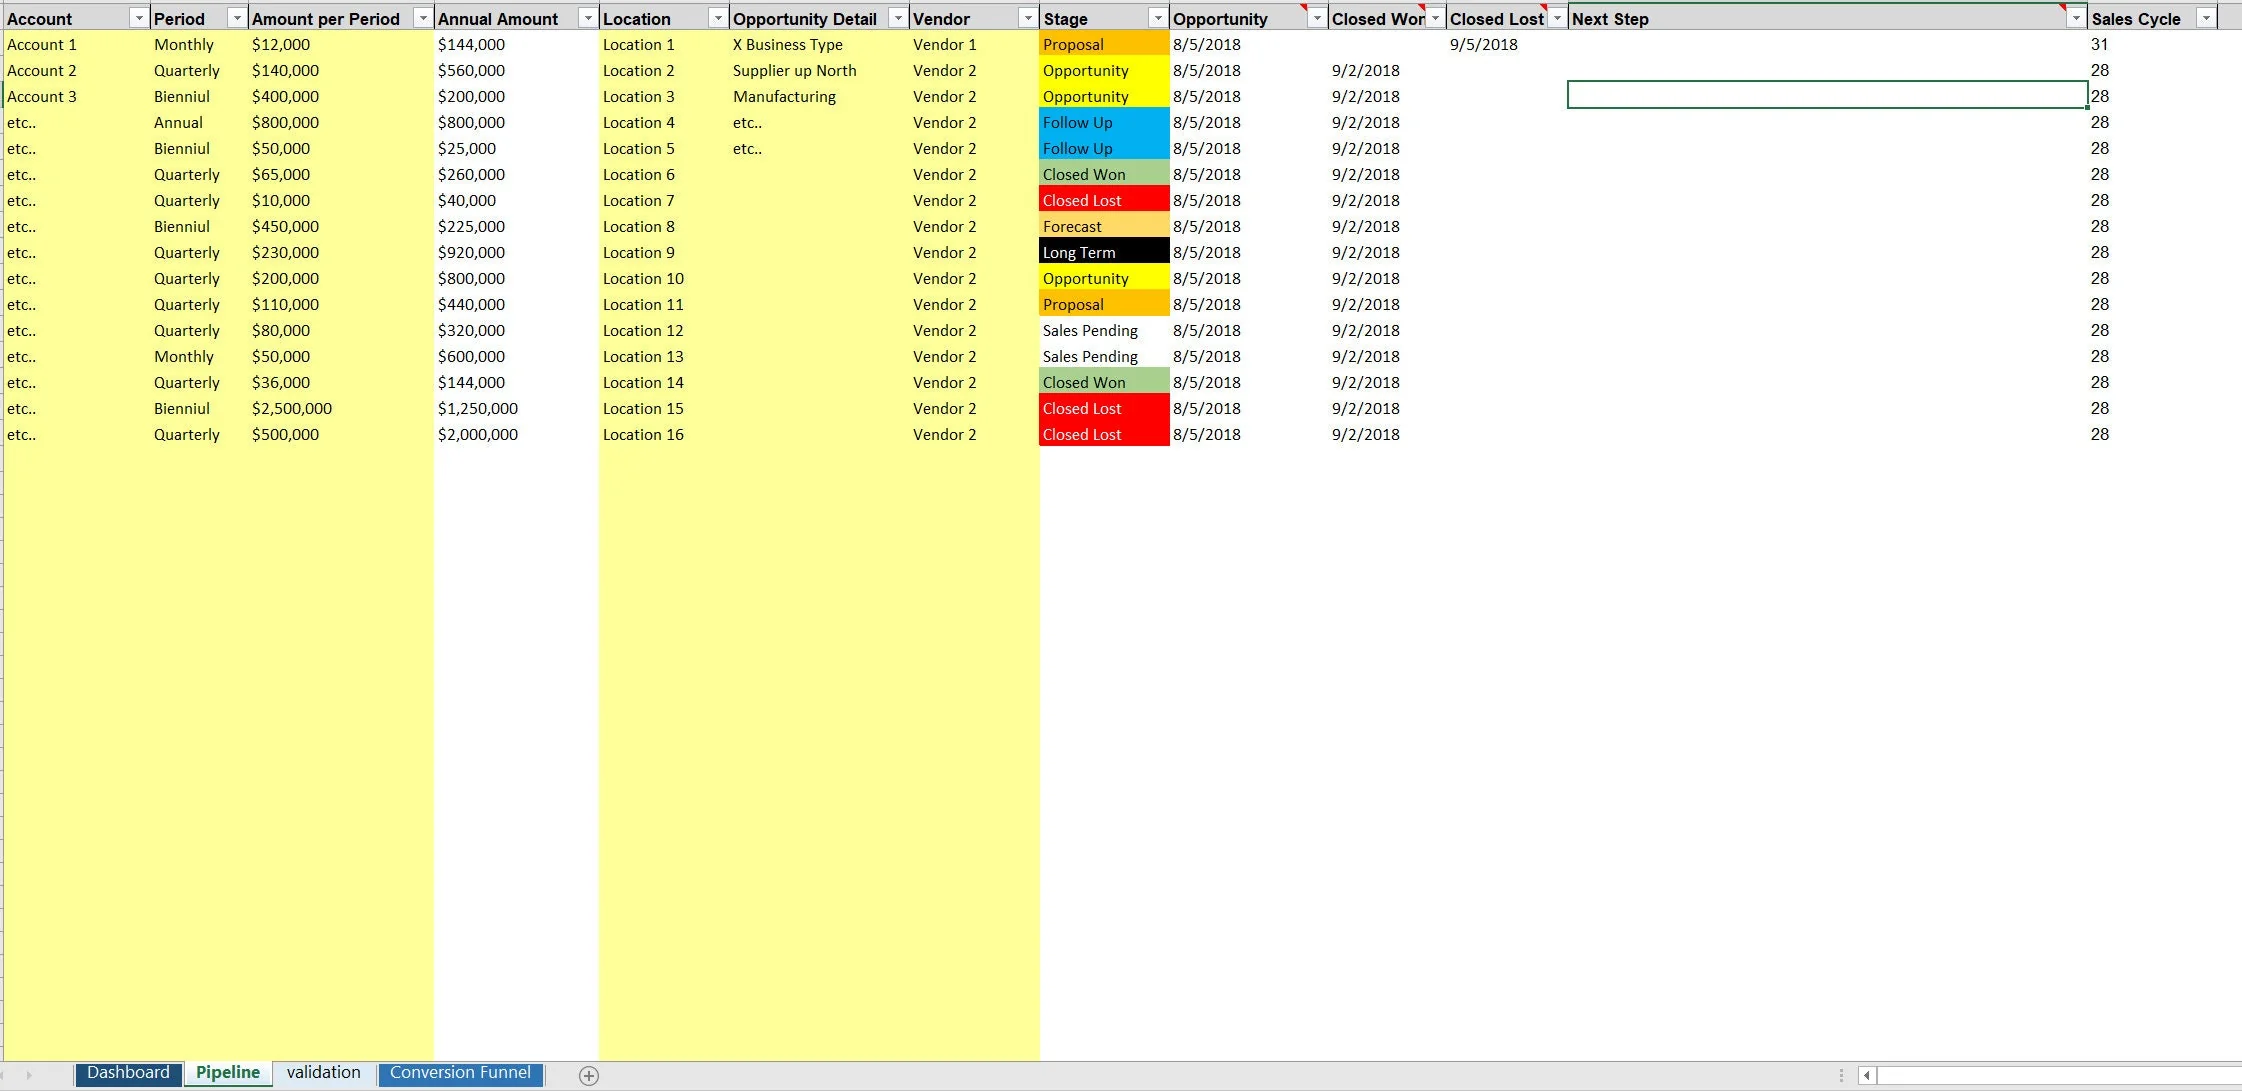
The database tab lets the user enter data about each prospective client and adjust (by selecting a new status from the dropdown menu) as they move through different stages. The visualizations in this template are astounding.

You have dynamic gauges as well as funnels that show the value of various metrics as well as the potential value at each pipeline stage and the count of customers in each stage based on whatever data has been entered.

Gauge Visualization Metrics:
•  Open Opportunities
•  Value of Open Opportunities
•  Average Opportunity Size ($)
•  Win Rate
•  Average Sales cycle (start to finish)

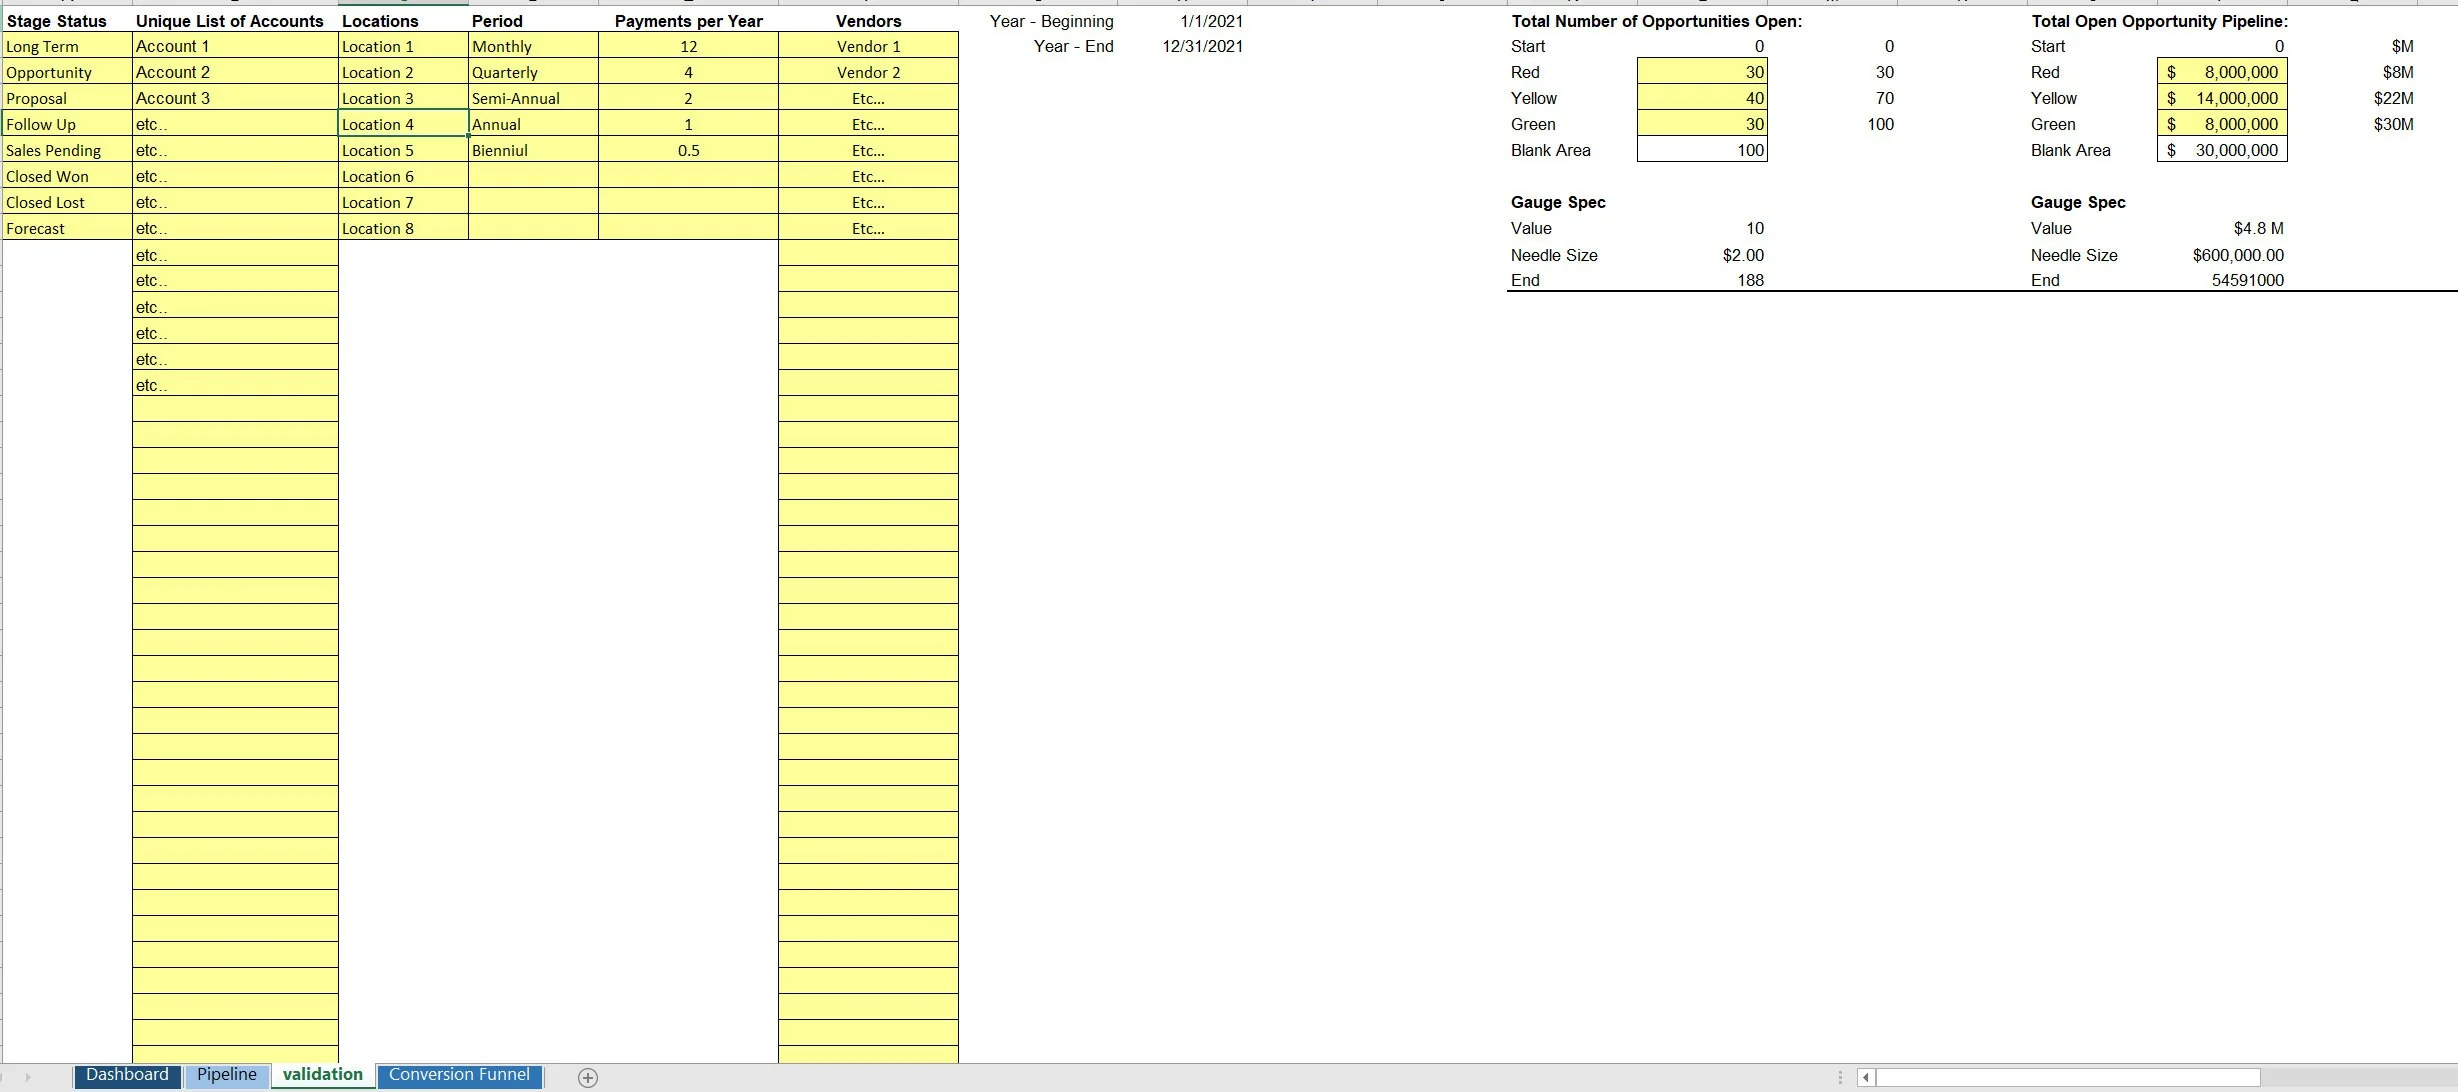
The values of the gauge that result in the low/mid/high sections can be configured dynamically. A few additional tracking summaries are included.

The first lets the user enter their expected yearly sales goal/plan, billings to date, and then takes the current pipeline ‘forecast' into account and shows if you are on pace to hit your yearly sales goal or not.

The Excel file automatically tracks the current start/end date of whatever year it is and will measure data entries against that to calculate the YTD billings tracker.

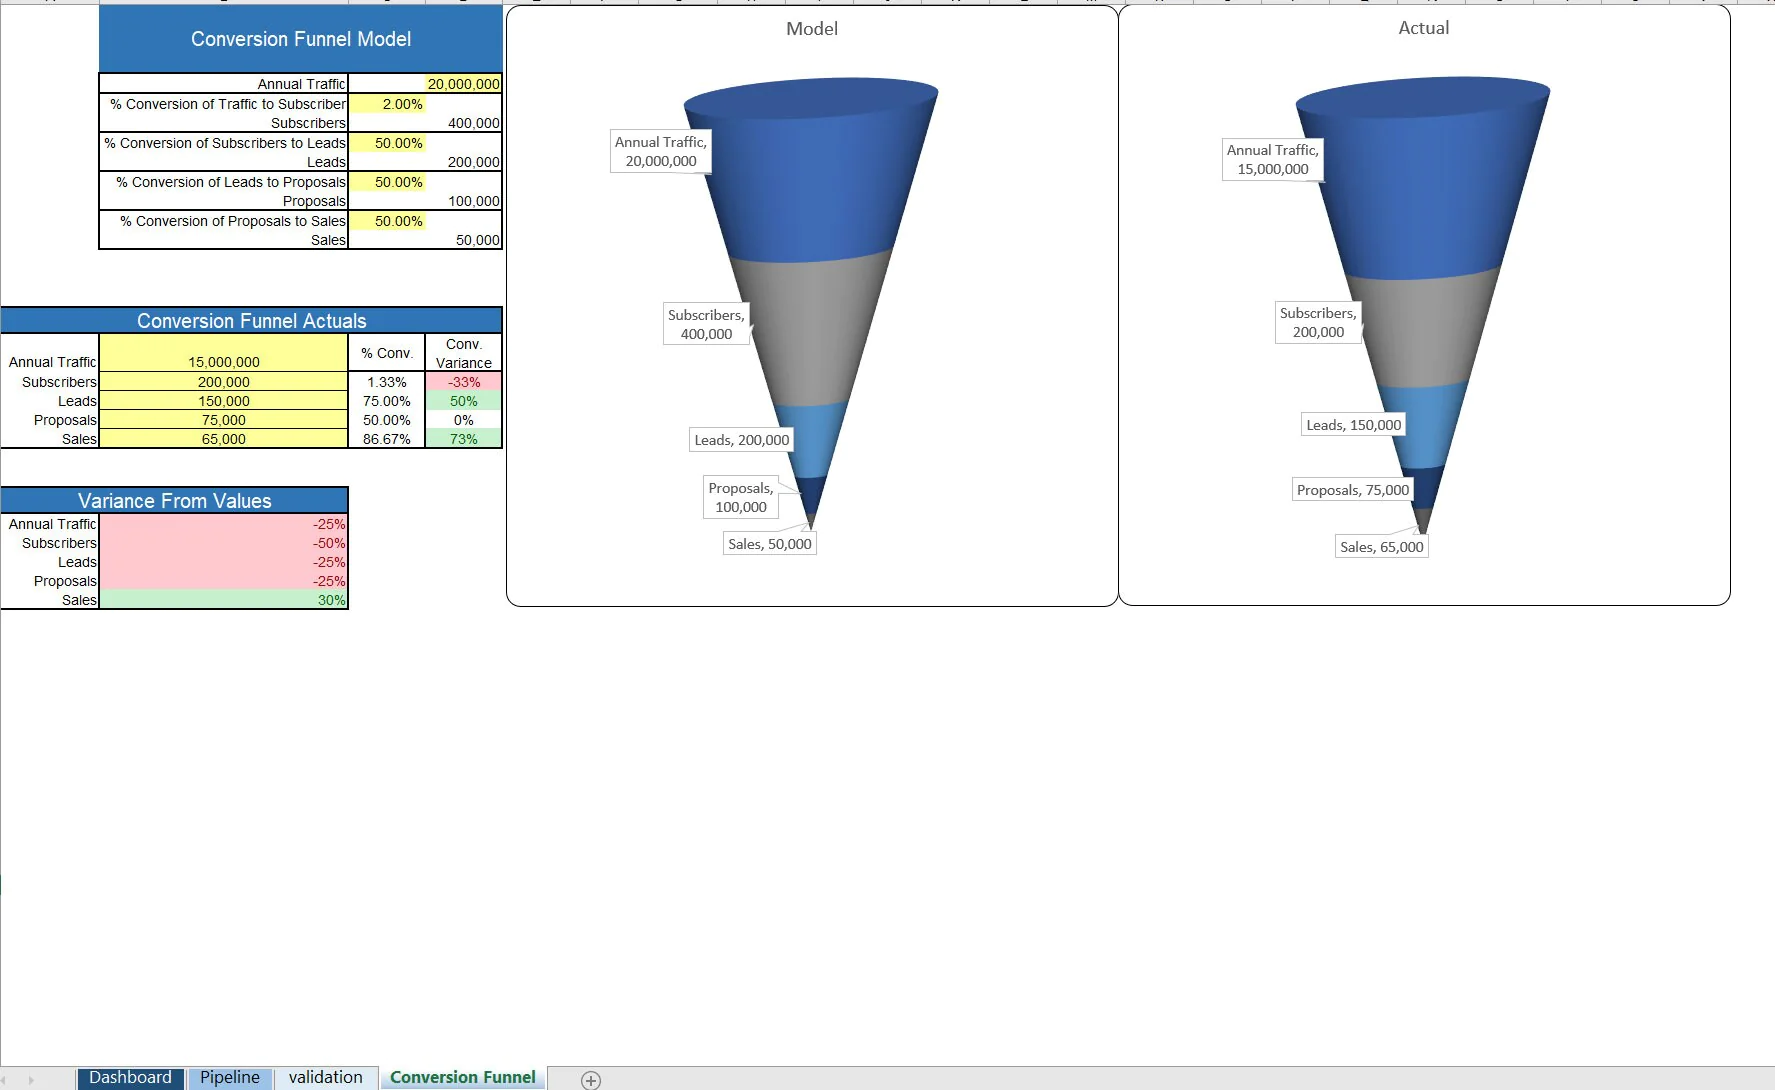
There is also a conversion funnel visual to help estimate expected sales based on 4 levels of conversion starting with traffic.

Got a question about the product? Email us at support@flevy.com or ask the author directly by using the "Ask the Author a Question" form. If you cannot view the preview above this document description, go here to view the large preview instead.

Source: Best Practices in Sales Excel: Sales Pipeline Tracker - Funnel and Gauge Visualizations Excel (XLSX) Spreadsheet, Jason Varner | SmartHelping


$45.00
This financial model was crafted by a Financial Modeler and Accountant with over 10+ years of global experience. He has served 750+ clients, from small family offices to billion-dollar corporations, across a multitude of industries.
Add to Cart
  

OVERVIEW

File Type: Excel xlsx (XLSX)
File Size: 292.7 KB

ABOUT THE AUTHOR

Additional documents from author: 157

I graduated in 2011 with a Bachelors degree in Accounting. From there, I worked at a few small businesses doing financial reporting and some bookkeeping. After a few years of that, I started doing freelance financial consulting work on Elance and Upwork.

After over 400 jobs completed with a 100% success rate, I now run my own modeling/consulting practice and continue to build new financial models every few weeks. [read more]

Ask the Author a Question

Must be logged in

Did you know?
The average daily rate of a McKinsey consultant is $6,625 (not including expenses). The average price of a Flevy document is $65.


Trusted by over 10,000+ Client Organizations
Since 2012, we have provided best practices to over 10,000 businesses and organizations of all sizes, from startups and small businesses to the Fortune 100, in over 130 countries.
AT&T GE Cisco Intel IBM Coke Dell Toyota HP Nike Samsung Microsoft Astrazeneca JP Morgan KPMG Walgreens Walmart 3M Kaiser Oracle SAP Google E&Y Volvo Bosch Merck Fedex Shell Amgen Eli Lilly Roche AIG Abbott Amazon PwC T-Mobile Broadcom Bayer Pearson Titleist ConEd Pfizer NTT Data Schwab


Read Customer Testimonials


Customers Also Bought These Documents


Customers Also Like These Documents

Related Management Topics


Sales Growth Strategy Account Management Consulting Frameworks Core Competencies Sales Force Chief Strategy Officer Sales Compensation PowerPoint Diagrams Compilation Communications Strategy Process Mapping Compensation Lead Generation Breakout Strategy Strategy Deployment & Execution KPI Maturity Model Leadership Strategy Development Revenue Management Organizational Design Market Research Business Development Marketing Plan Development

Download our FREE Strategy & Transformation Framework Templates

Download our free compilation of 50+ Strategy & Transformation slides and templates. Frameworks include McKinsey 7-S, Balanced Scorecard, Disruptive Innovation, BCG Curve, and many more.