
 Click main image to view in full screen. Unlock all 18 preview images:
RIA Wealth Management 5-Year Growth & Acquisition Model – Excel XLSX
Excel (XLSX) + supplemental PDF


BENEFITS OF THIS DOWNLOADABLE EXCEL DOCUMENT
- Connects AUM growth, client acquisition, fee economics, advisor capacity, staffing, and profitability in one integrated five-year decision model.
- Models succession and practice acquisitions from purchase price through funding, retention, integration, earnouts, debt service, cash flow, and valuation.
- Provides Downside, Base, and Upside scenarios, four two-way sensitivities, integrated financial statements, valuation, and decision dashboards.
WEALTH MANAGEMENT EXCEL DESCRIPTION
This Excel model is designed for registered investment advisers, wealth-management practices, succession buyers, practice acquirers, finance teams, and consultants that need to connect AUM growth with the operating capacity and capital requirements of the advisory business.
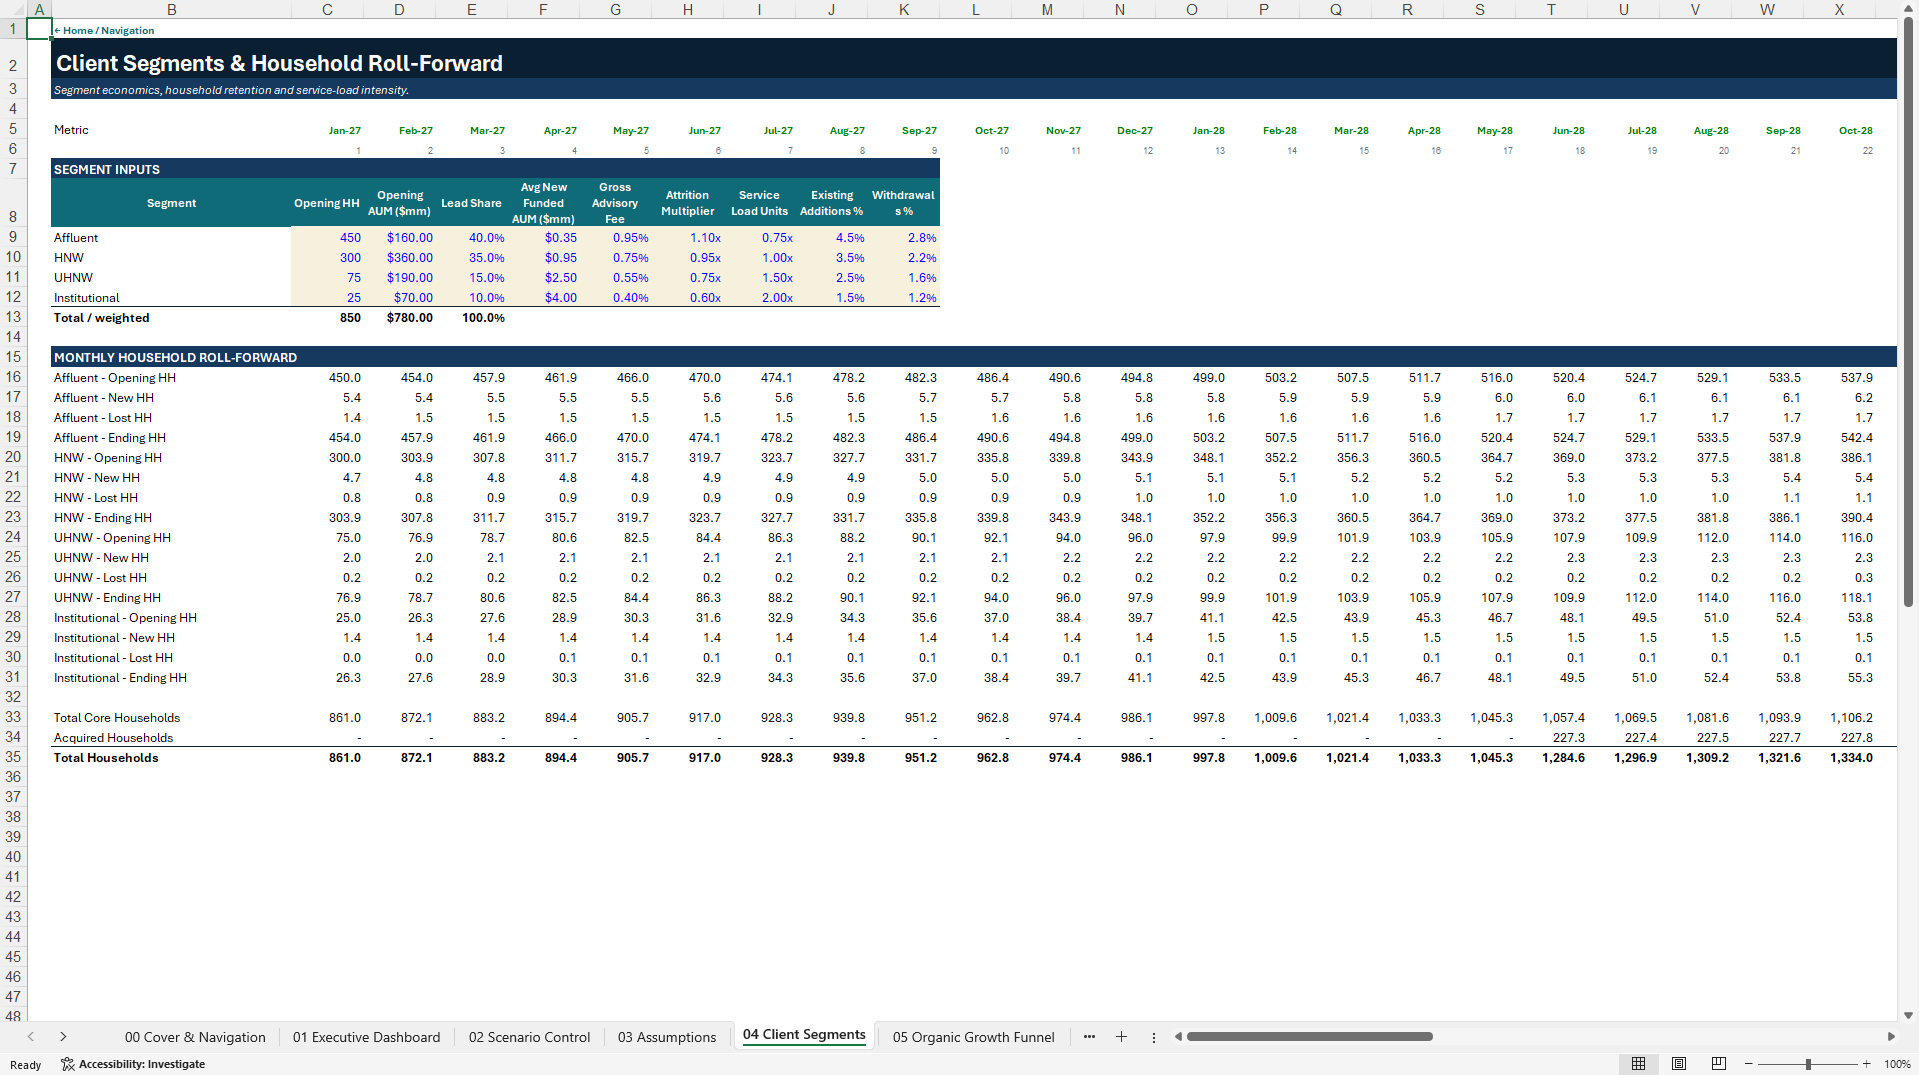
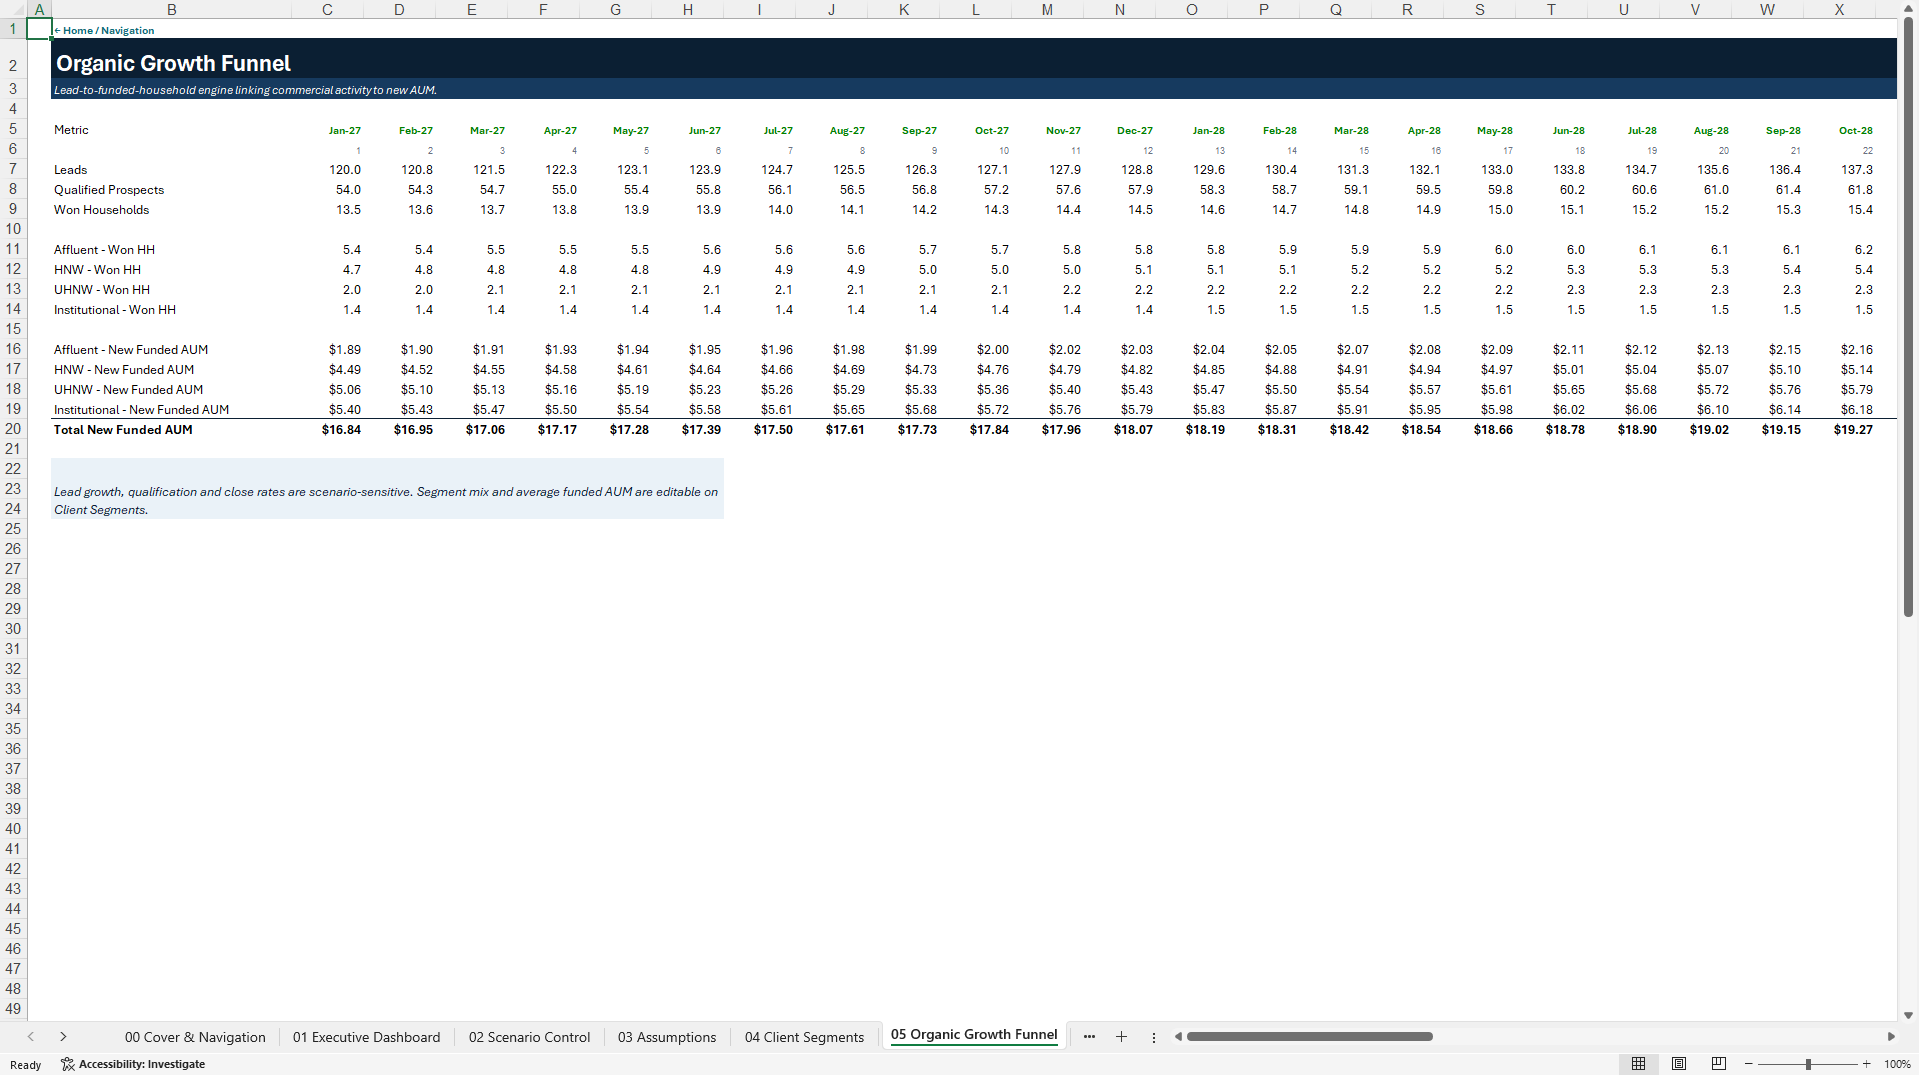
The model covers a five-year forecast with 60 monthly periods and annual Year 1 through Year 5 summaries. Its operating engine begins with client segments, lead generation, qualified prospects, won households, average funded AUM, client additions, withdrawals, attrition, and market return. The AUM roll-forward keeps market performance separate from client-driven net flows so users can see whether growth is truly organic or primarily market-driven.
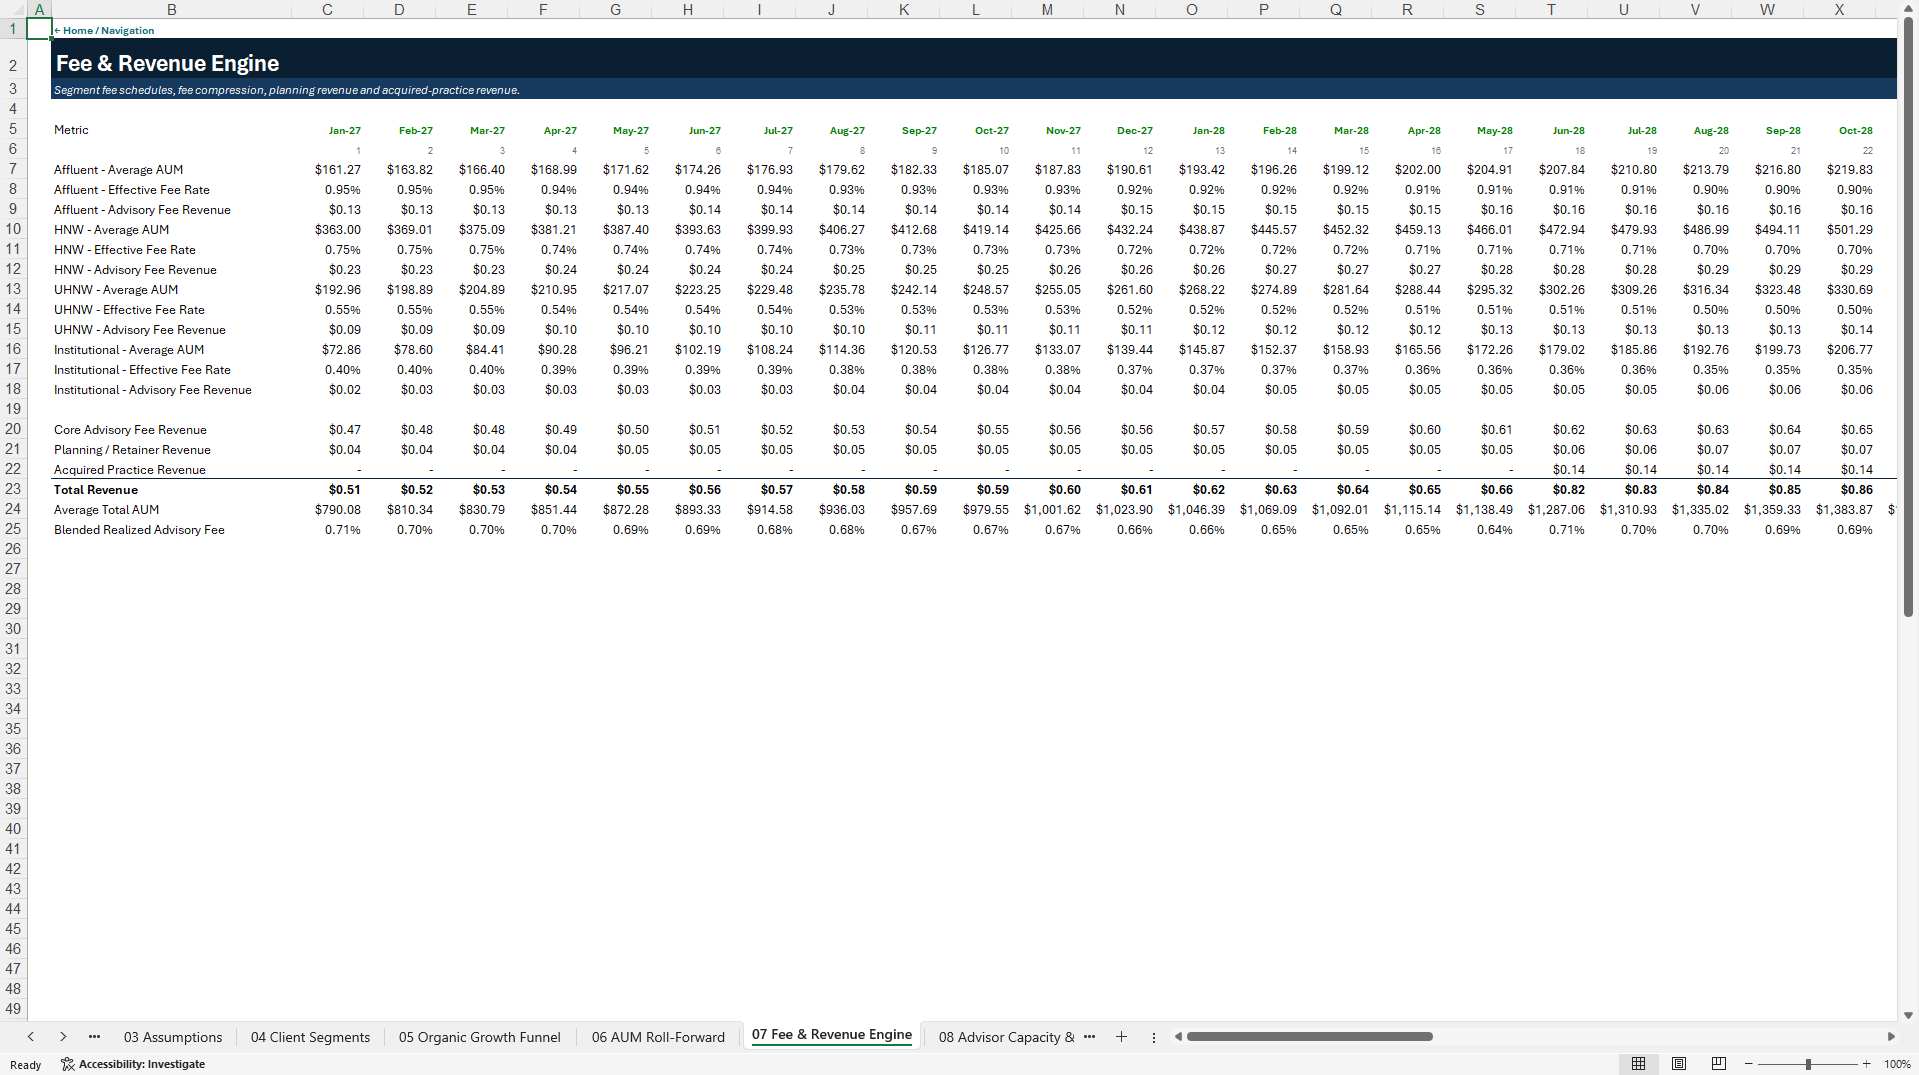
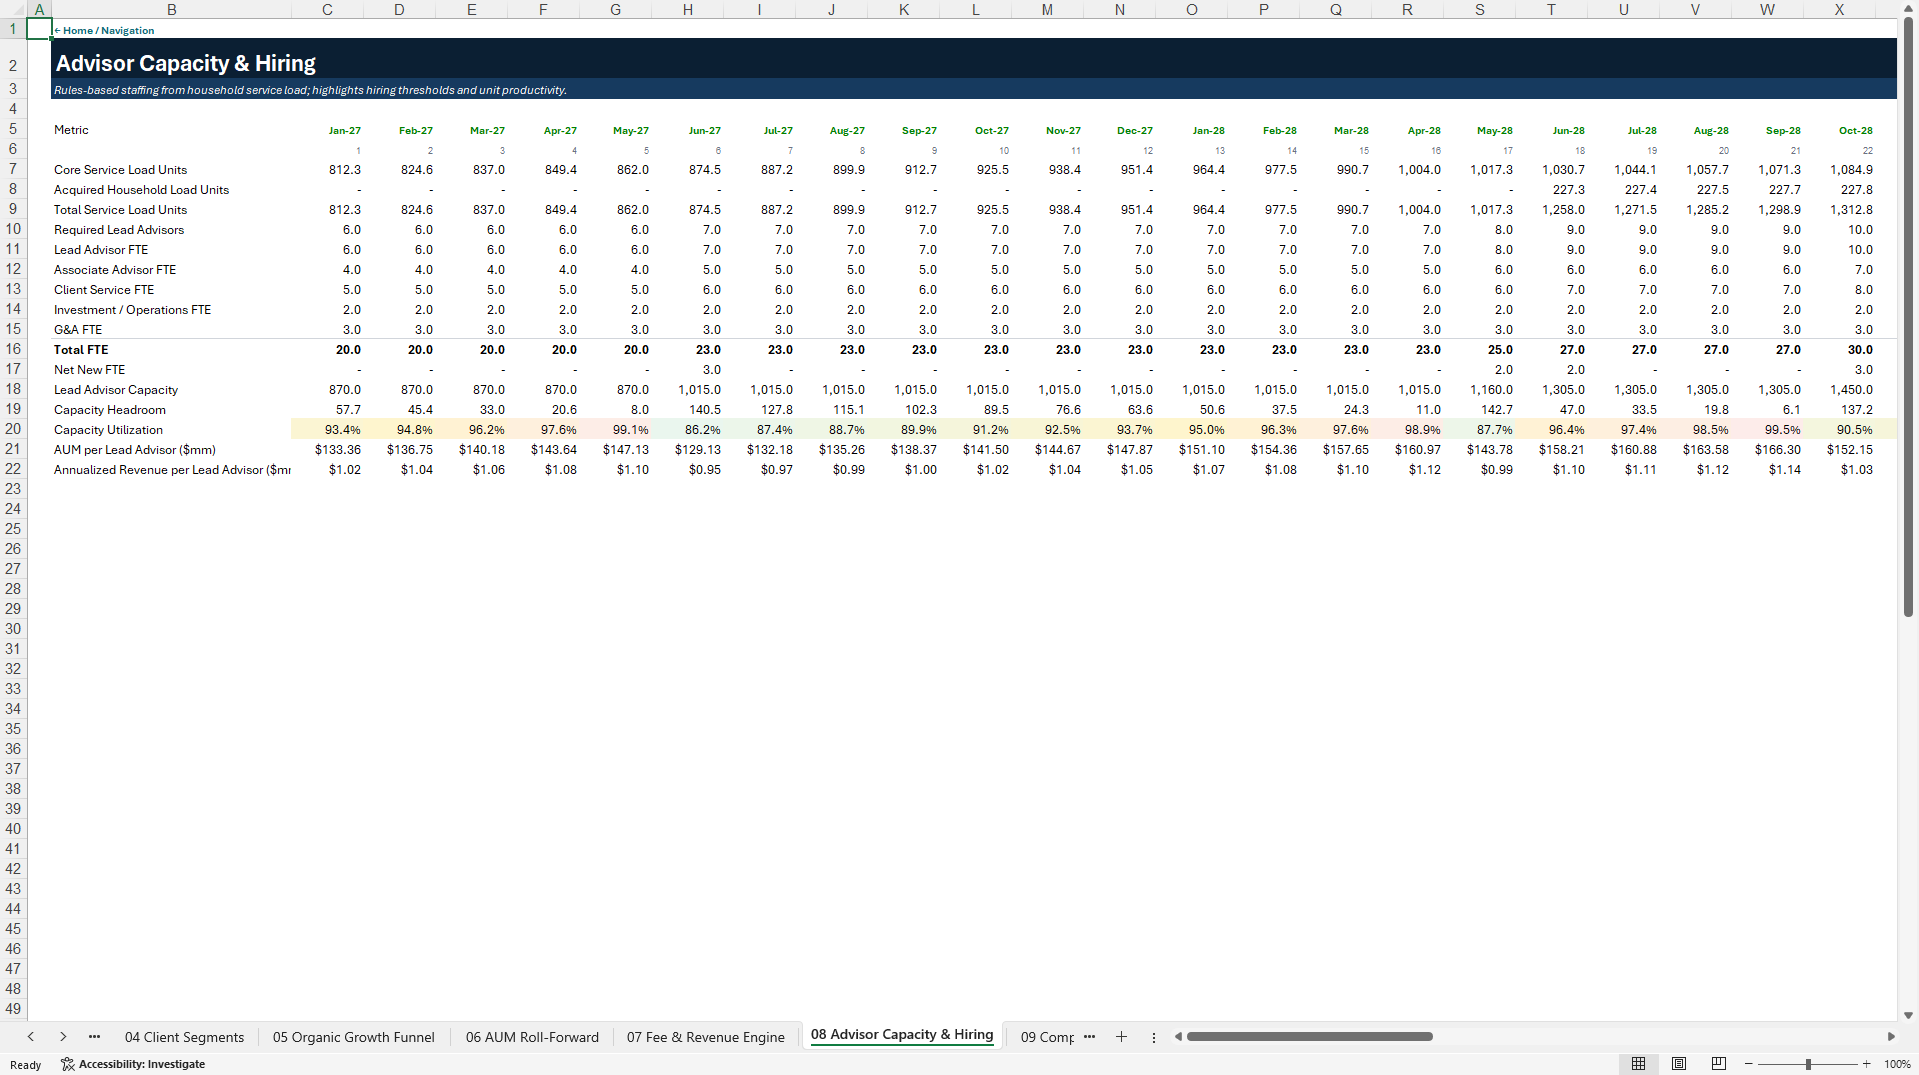
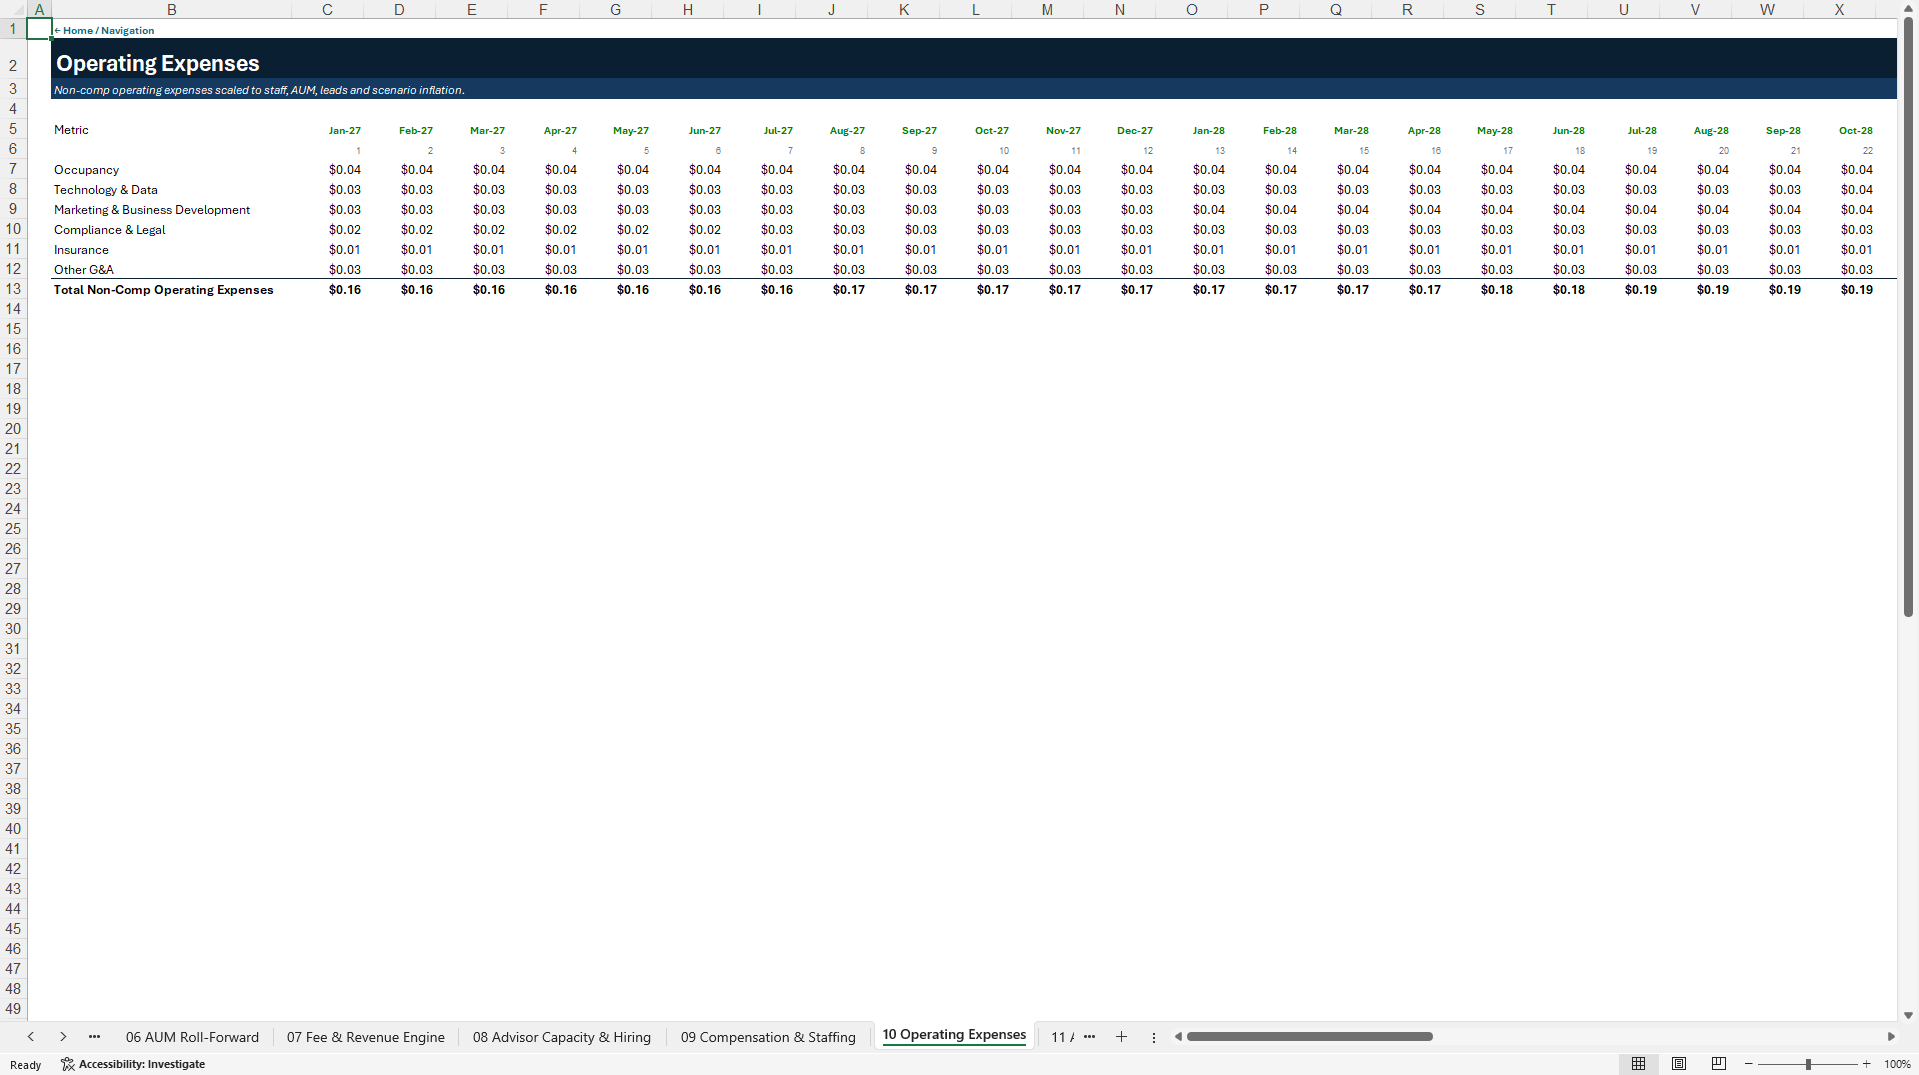
Revenue is calculated through segment-level AUM economics, effective advisory fee rates, fee compression, planning and retainer revenue, and acquired-practice revenue. The staffing engine converts household service load into required lead advisors, associate advisors, client-service FTE, total staffing, capacity headroom, capacity utilization, AUM per lead advisor, and annualized revenue per lead advisor. Compensation and non-comp operating expenses then feed directly into profitability.
The succession and acquisition section supports editable practice targets with close month, AUM, annual revenue, EBITDA margin, purchase multiple, funding mix, earnout timing, and deal status. Acquisition financing includes term debt, seller notes, equity funding, earnouts, repayments, interest, cash consideration, and debt service. Integration schedules model retained acquired AUM, acquired households, acquired revenue and EBITDA, integration costs, client relationship intangibles, amortization, and goodwill.
The workbook contains integrated five-year Profit & Loss, Balance Sheet, and Cash Flow statements. It also includes fixed assets and depreciation, debt and financing schedules, DSCR, DCF valuation, an EBITDA-multiple valuation cross-check, and an equity-value bridge.
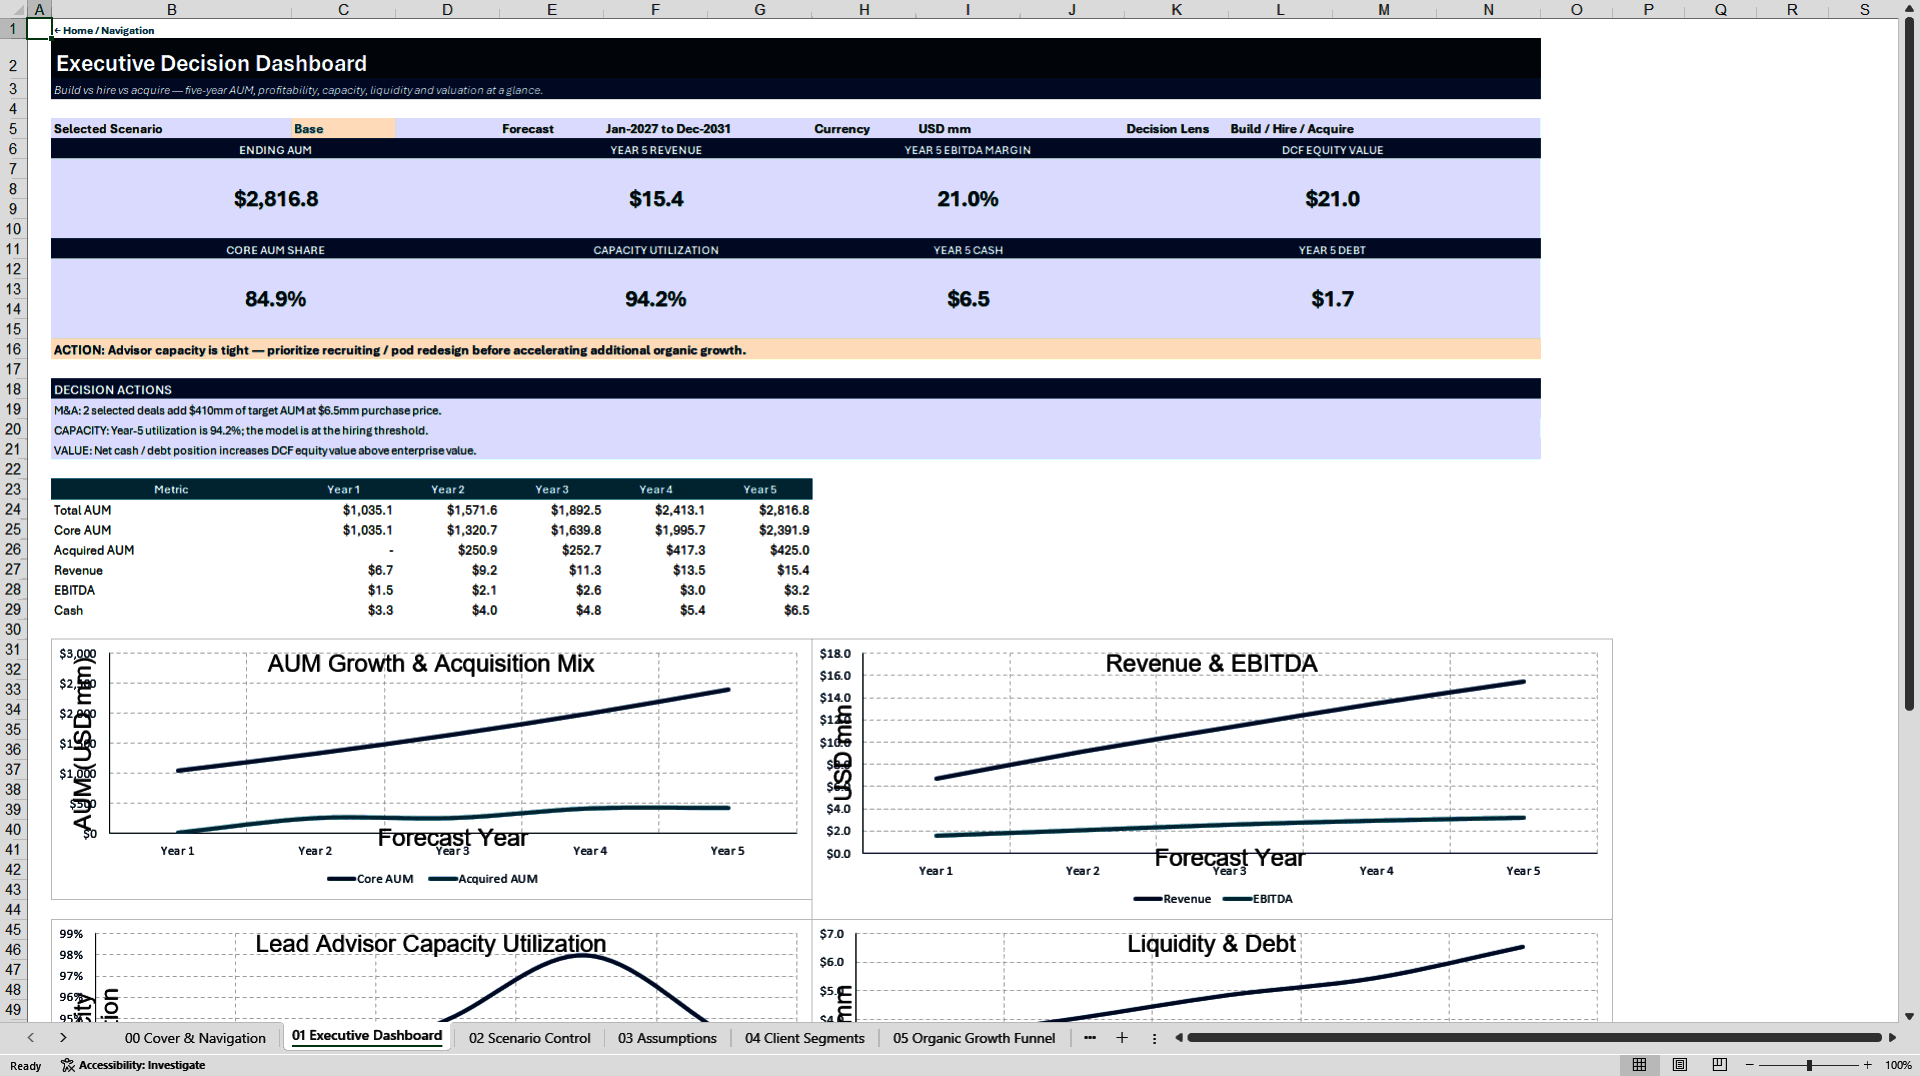
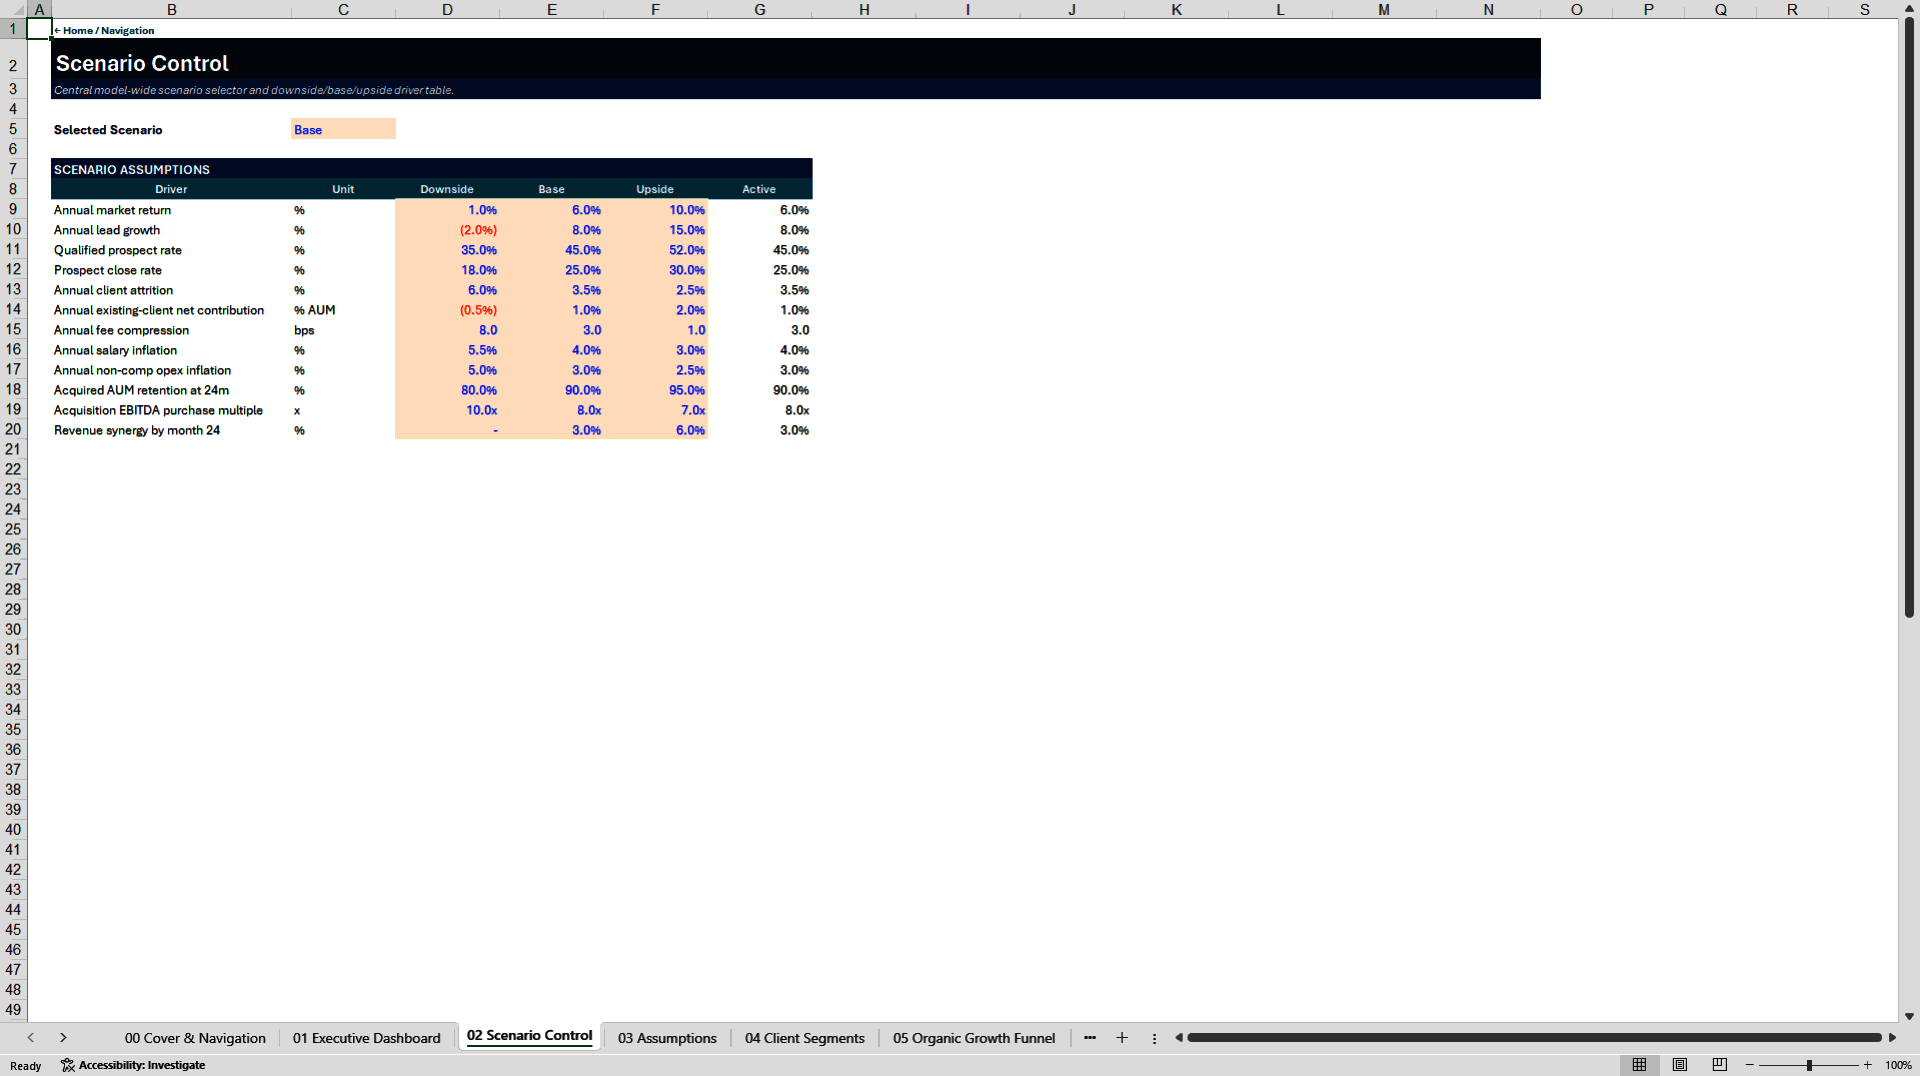
A central scenario selector provides Downside, Base, and Upside cases. The sensitivity section tests market return against organic lead growth, market return against client attrition, realized fee shifts against compensation shifts, and acquisition purchase multiple against retained AUM. Executive, advisor-capacity, and M&A dashboards summarize the major decisions with native Excel charts.
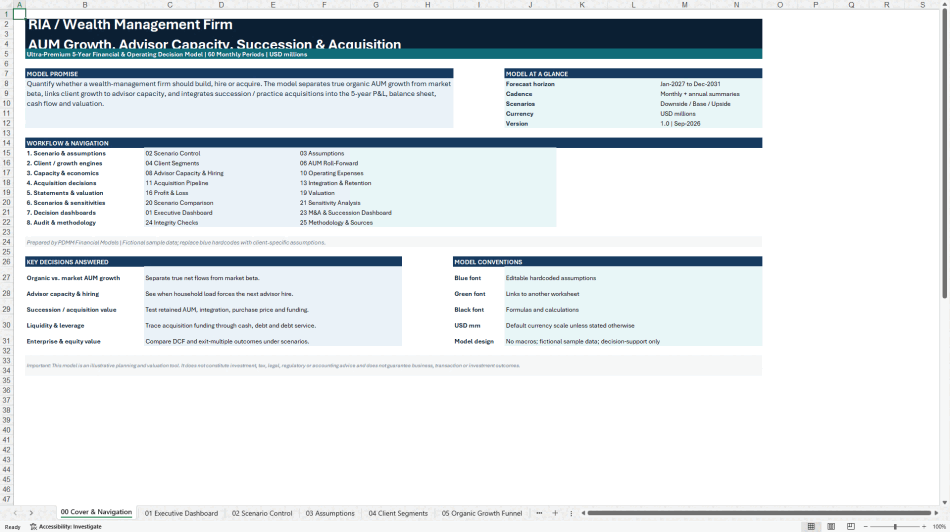
The workbook includes model-integrity checks, instructions, methodology, sample assumptions, navigation, and a full-sheet PDF preview. It is intended to help users decide when to invest in organic growth, when to add advisory capacity, whether an acquisition creates acceptable economics, how financing affects liquidity and debt service, and how strategic choices flow through enterprise and equity value.
Got a question about the product? Email us at support@flevy.com or ask the author directly by using the "Ask the Author a Question" form. If you cannot view the preview above this document description, go here to view the large preview instead.
Source: Best Practices in Wealth Management, Integrated Financial Model Excel: RIA Wealth Management 5-Year Growth & Acquisition Model Excel (XLSX) Spreadsheet, PDMM Financial Models
ABOUT THE AUTHOR

PDMM Financial Models develops professional, decision-ready Excel models for business owners, entrepreneurs, investors, consultants, analysts, and finance teams. Our objective is to transform complex business assumptions into clear, structured analysis that supports better planning and investment decisions.
Our models cover business planning, forecasting, budgeting, feasibility analysis,
... [read more]
Ask the Author a Question
You must be logged in to contact the author.




























