
 Click main image to view in full screen.
RIA & Wealth Management Practice Acquisition Model – Excel XLSX
Excel (XLSX) + supplemental PDF


BENEFITS OF THIS DOWNLOADABLE EXCEL DOCUMENT
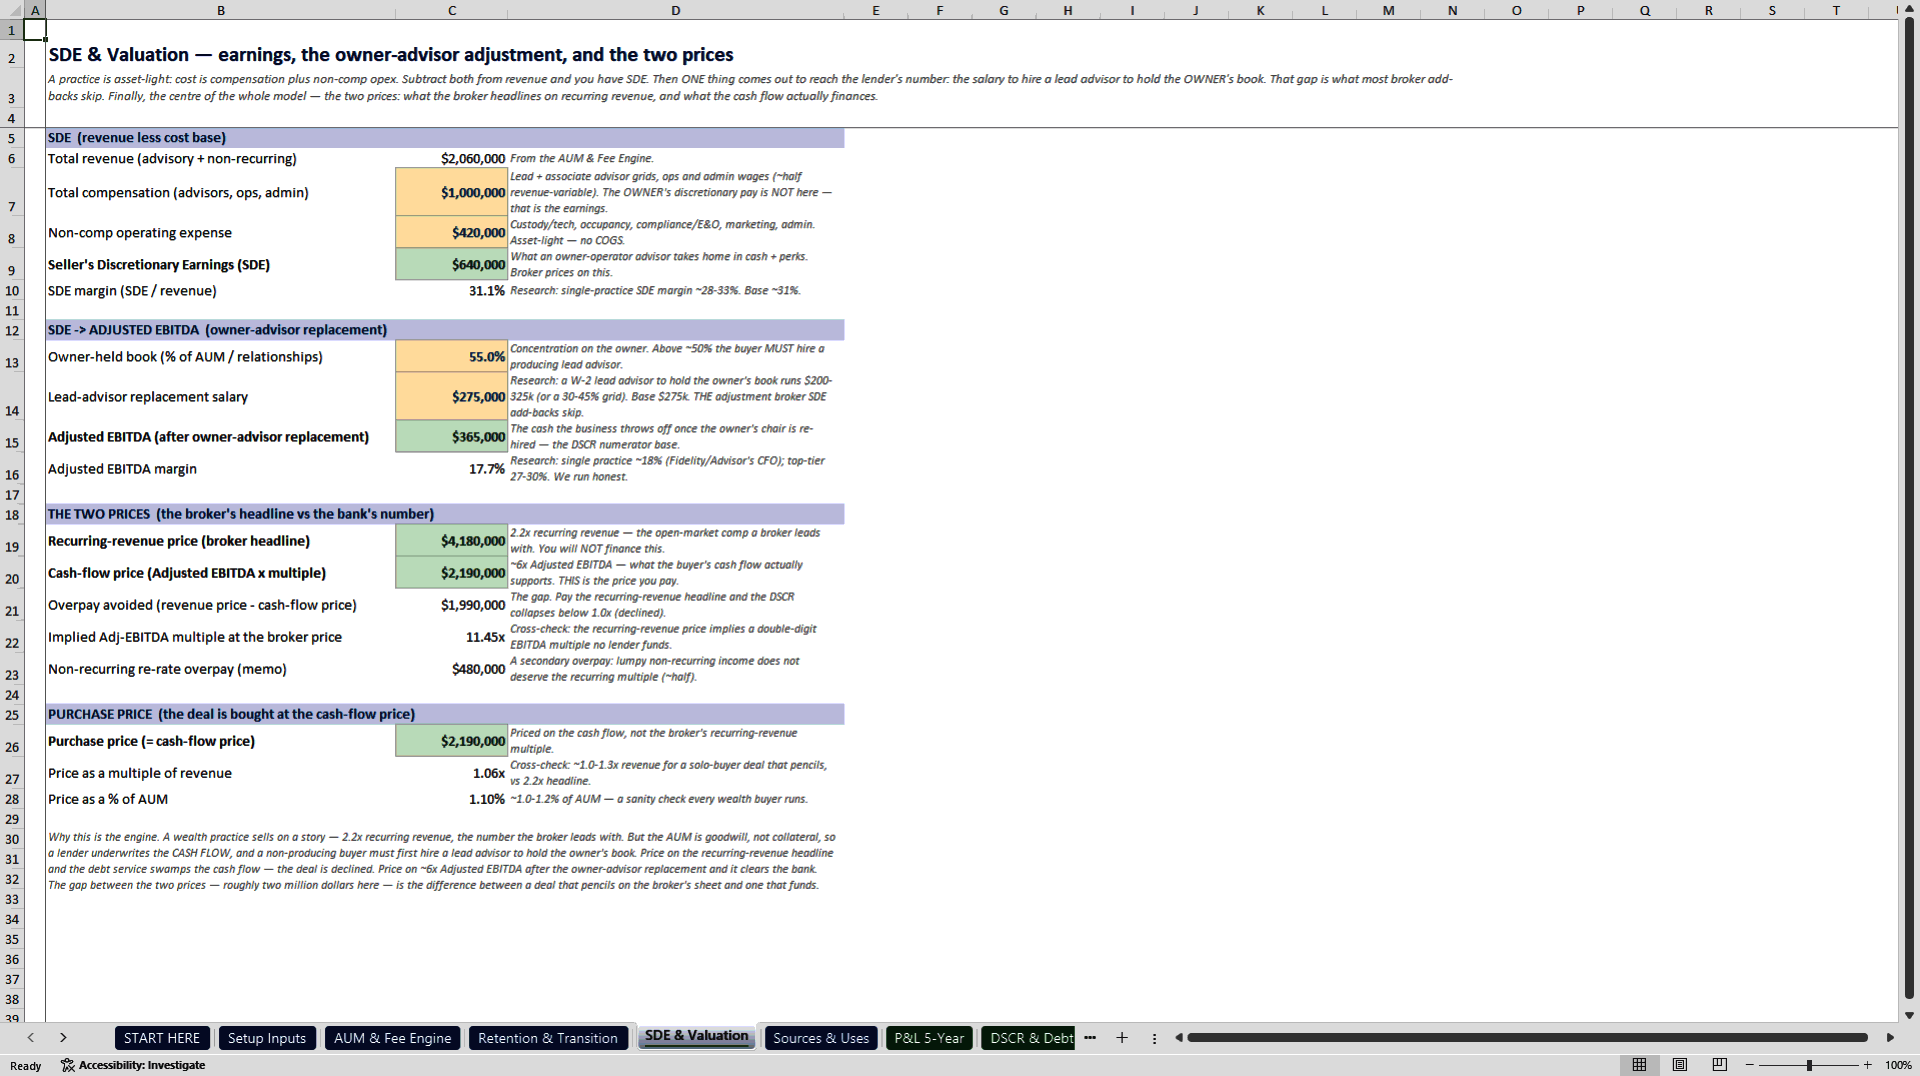
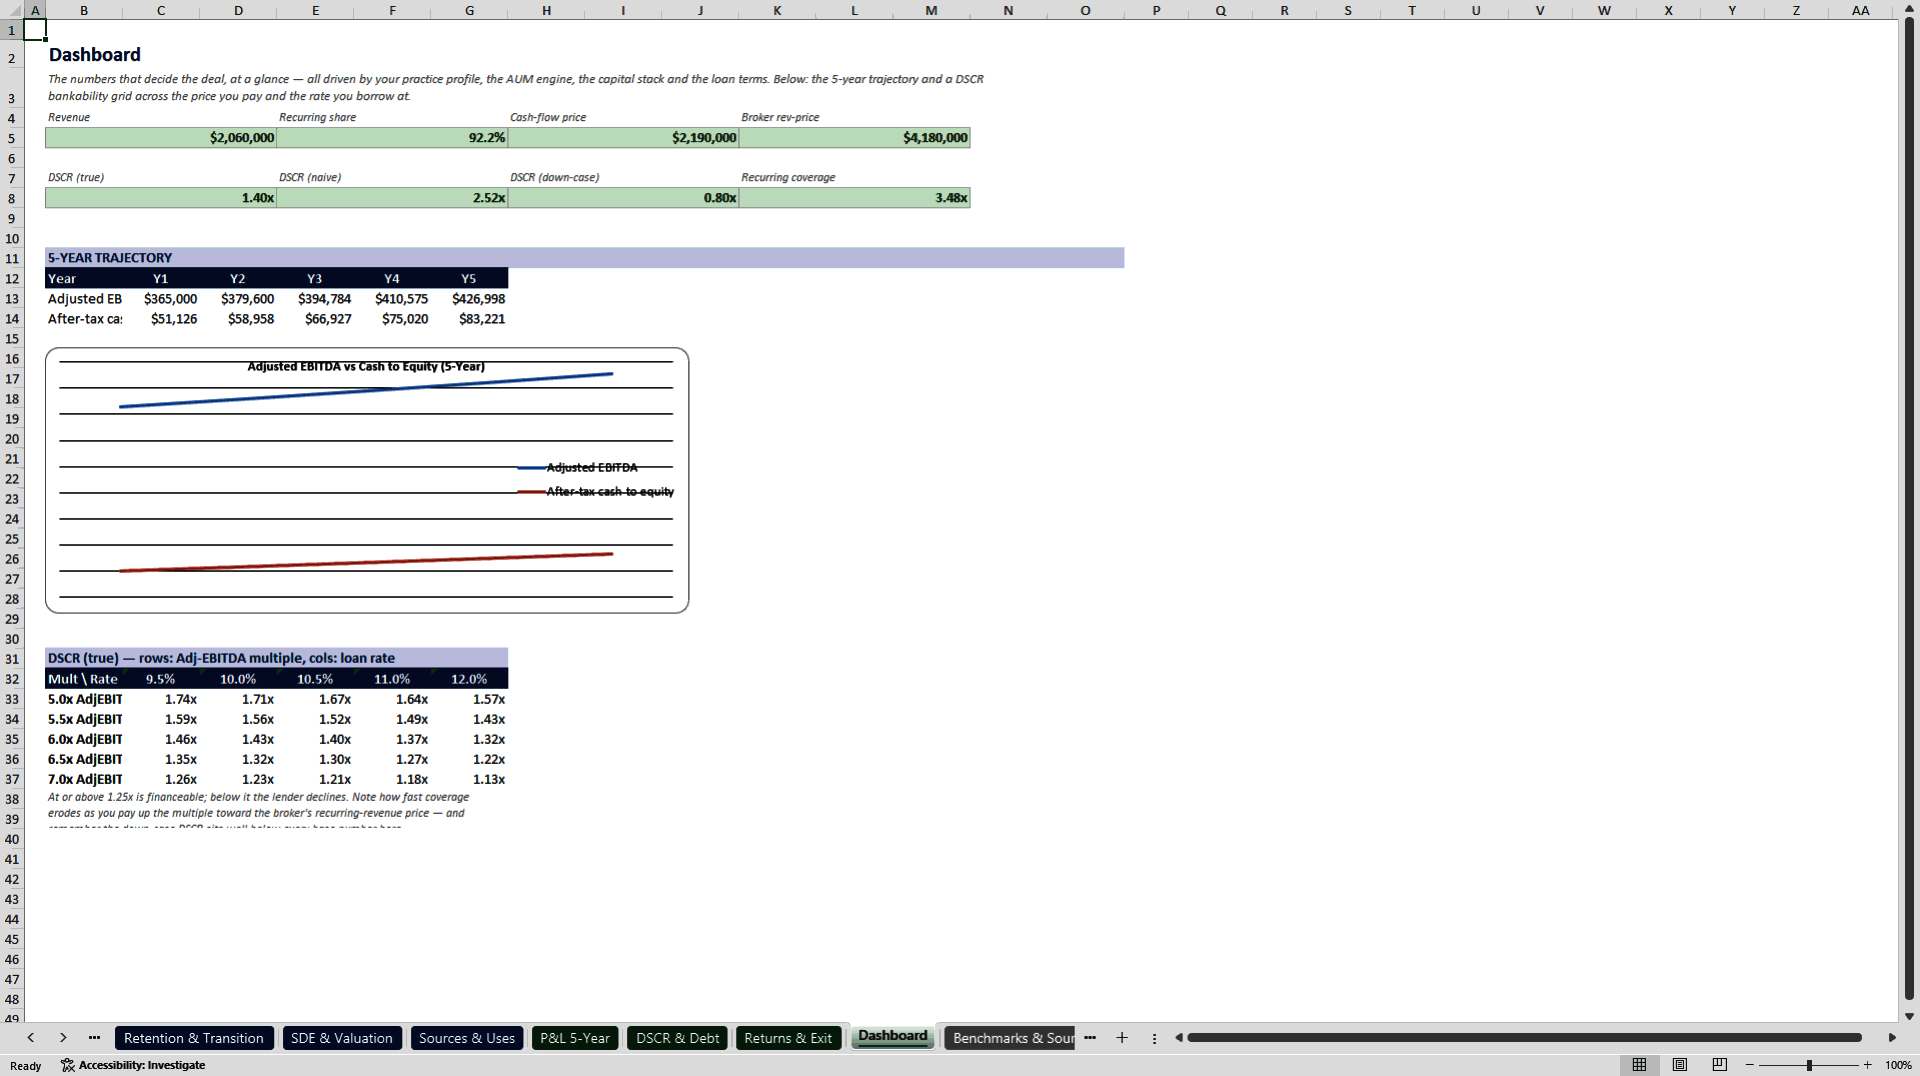
- See the broker's revenue-multiple price of $4.18M and the cash-flow price of $2.19M in one panel, each with its own DSCR, so you can show a seller exactly where the two methods diverge.
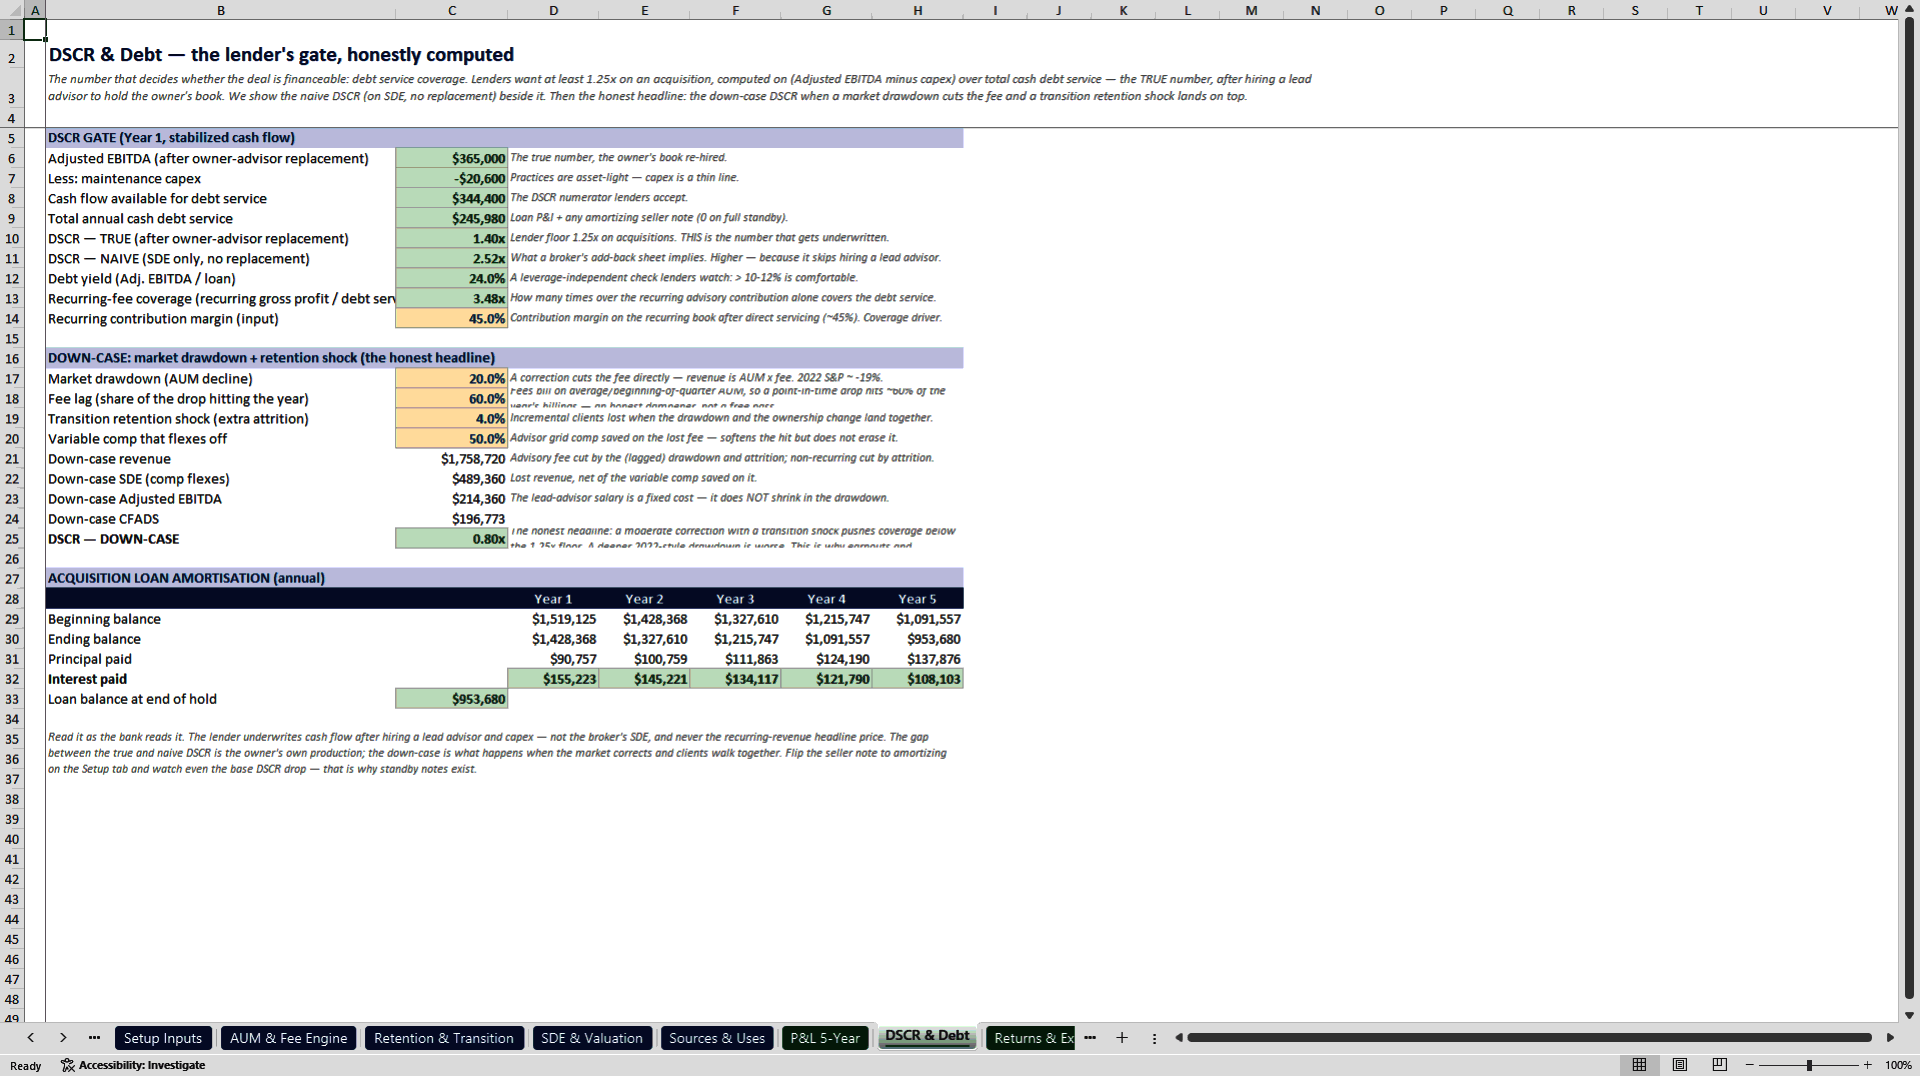
- Model the risk that is specific to fee-based advice: a 20% market drawdown, damped by the fee-billing lag and stacked on transition attrition, pushes the DSCR to 0.80x.
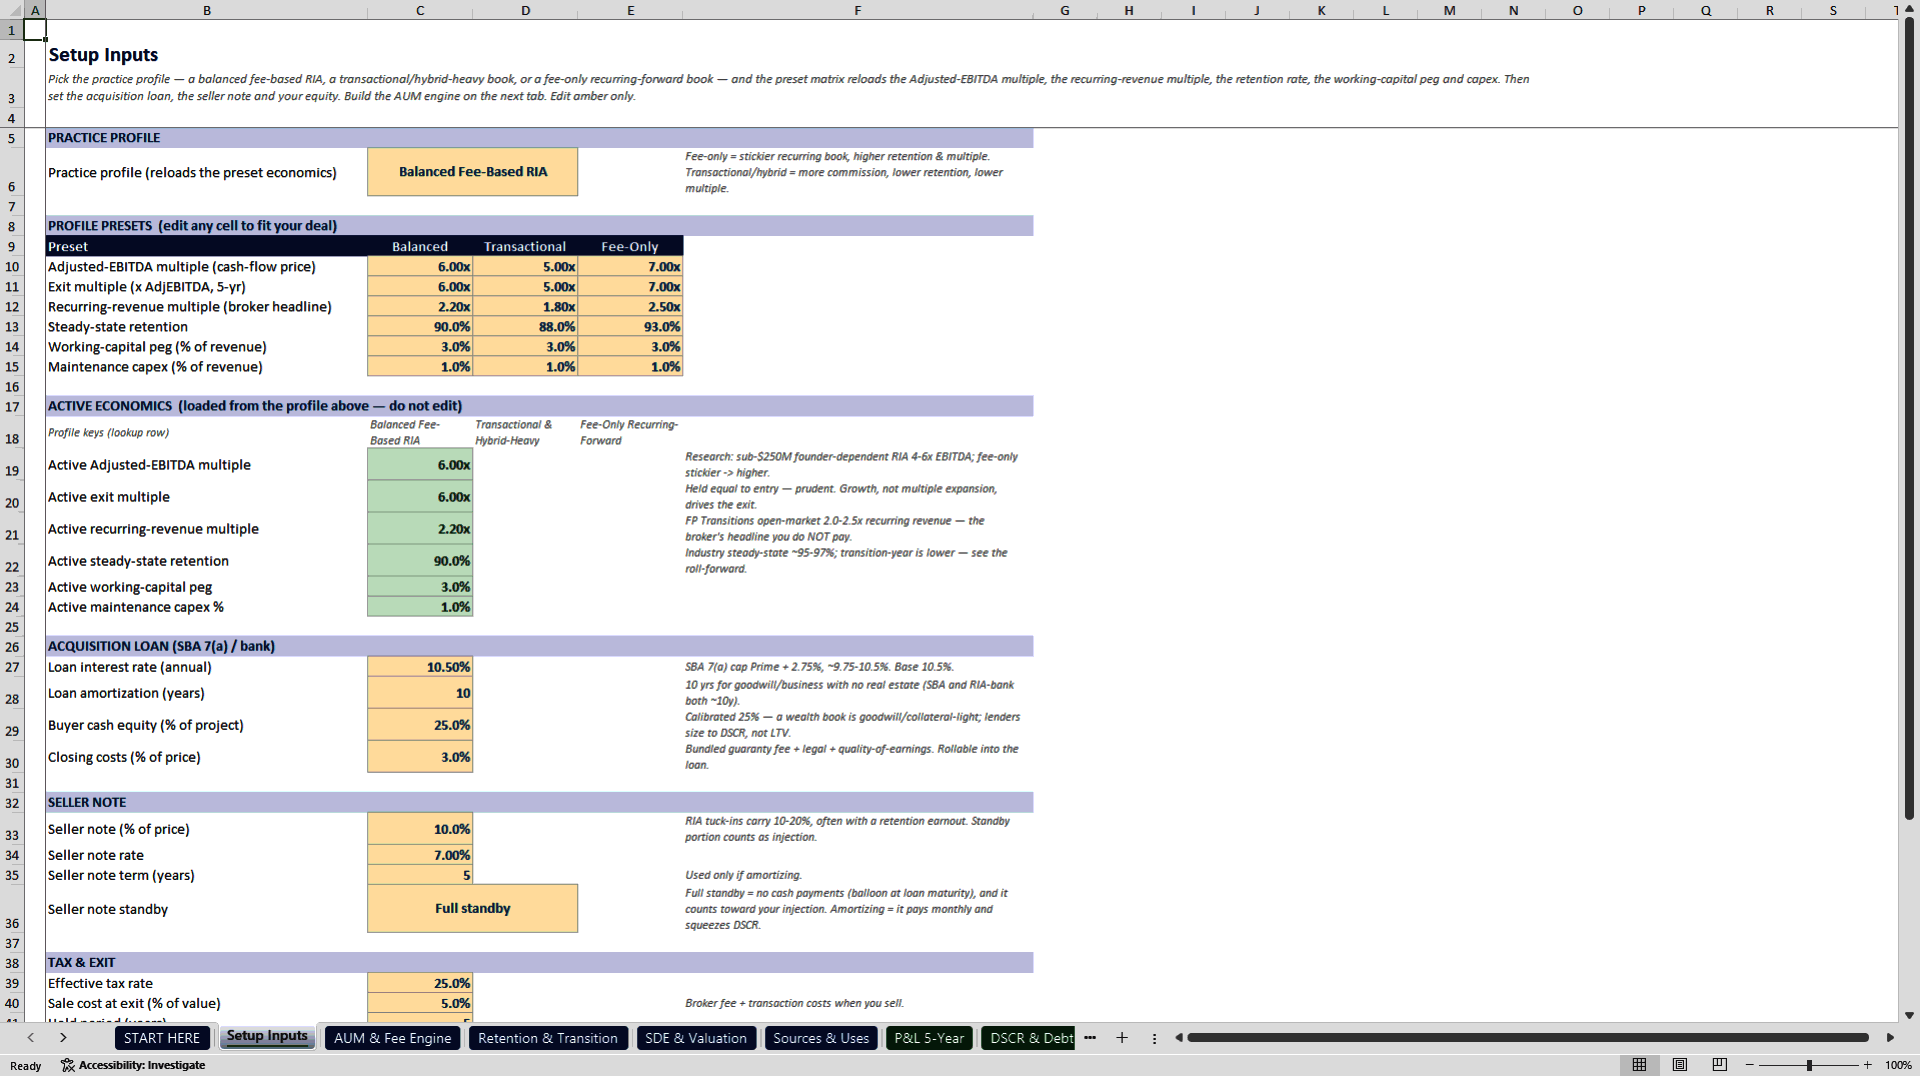
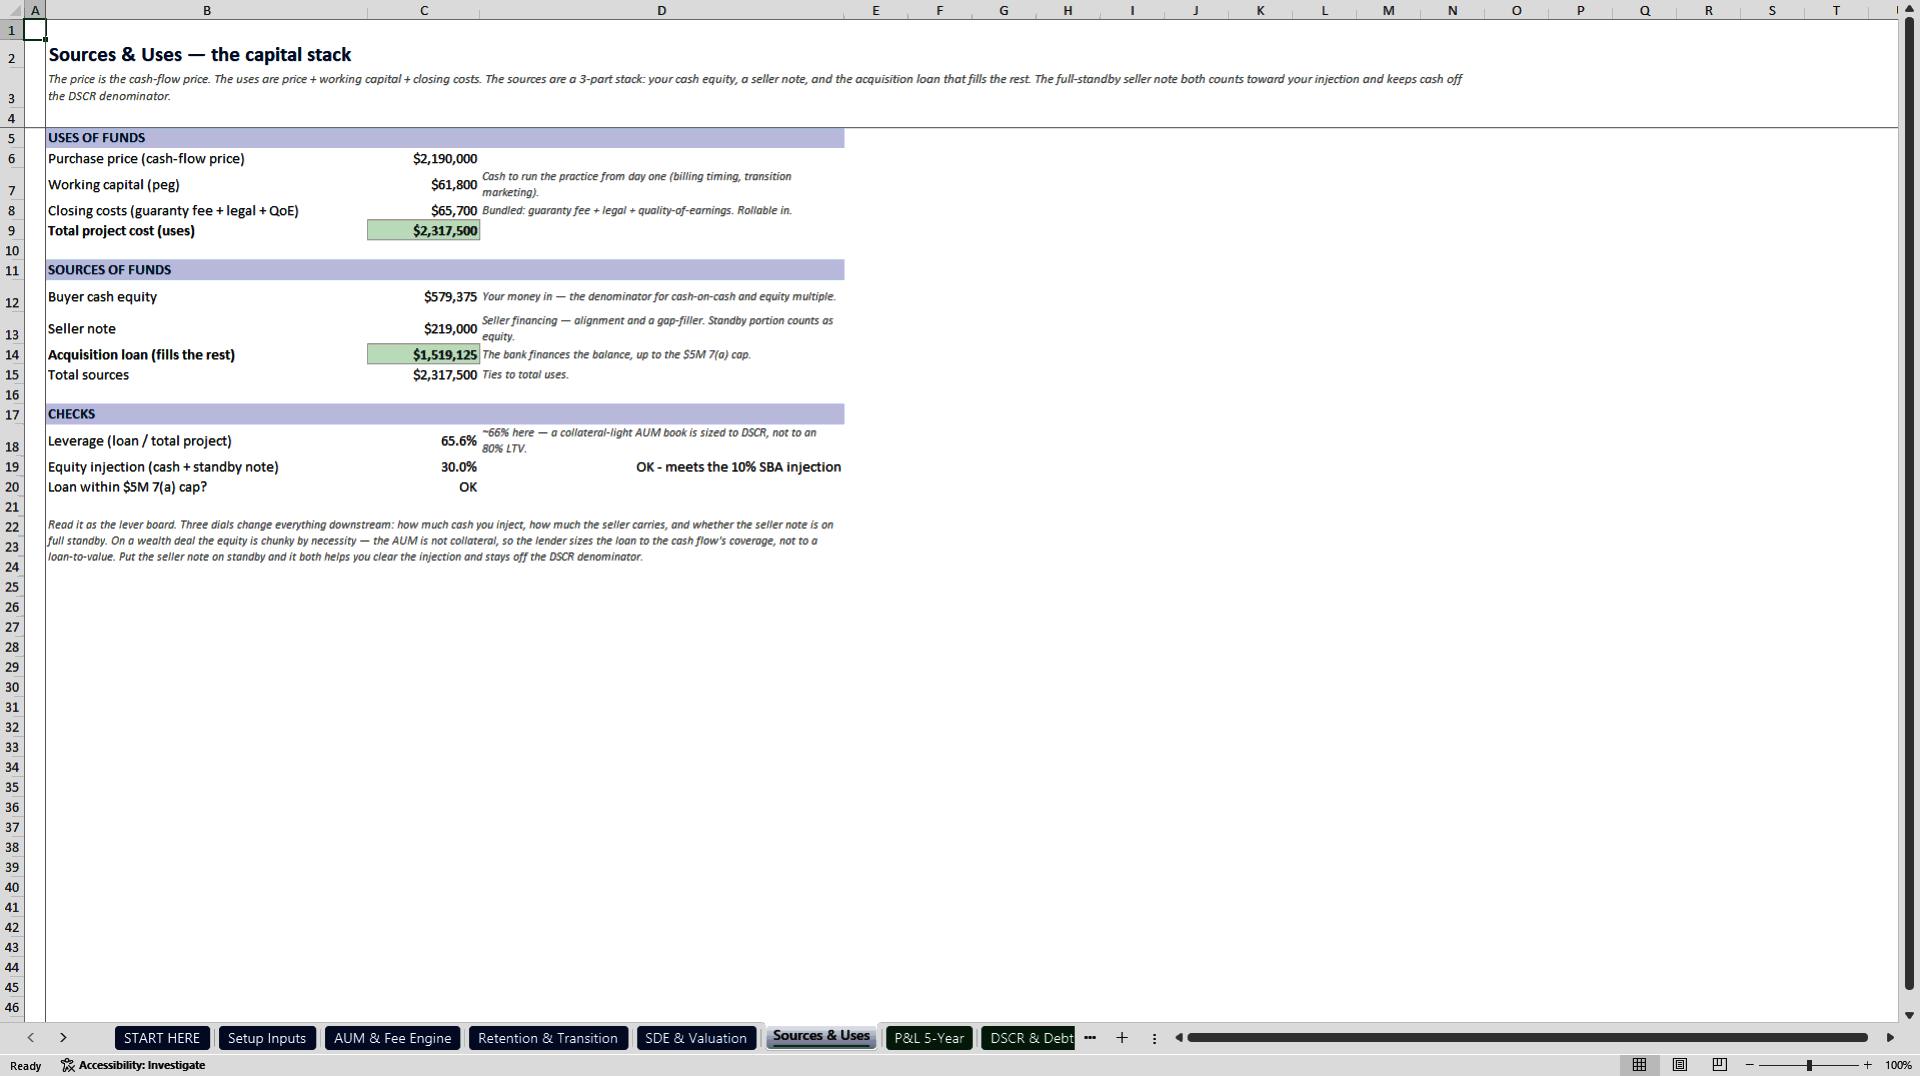
- Use the seller note as a coverage lever, switching between full standby and amortising, with the loan sized to DSCR rather than to collateral, since a client book is collateral-light.
WEALTH MANAGEMENT EXCEL DESCRIPTION
This model is for a solo or junior buyer, or an aggregator making an add-on, acquiring a registered investment advisor or wealth-management practice with an SBA 7(a) loan. It is the file you hand the lender.
The valuation error it intercepts is the multiple itself. A broker prices a retiring advisor's $200M book on a revenue multiple: at 2.2x recurring revenue that is $4.18M. A bank prices the same book on the cash flow that survives after a real advisor replaces the owner's own production, at about $275,000 of compensation. Underwritten that way the practice pencils at $2.19M, which is 6.0x Adjusted EBITDA. The model shows the two prices side by side with the DSCR at each, and the roughly $2.0M gap is the whole decision.
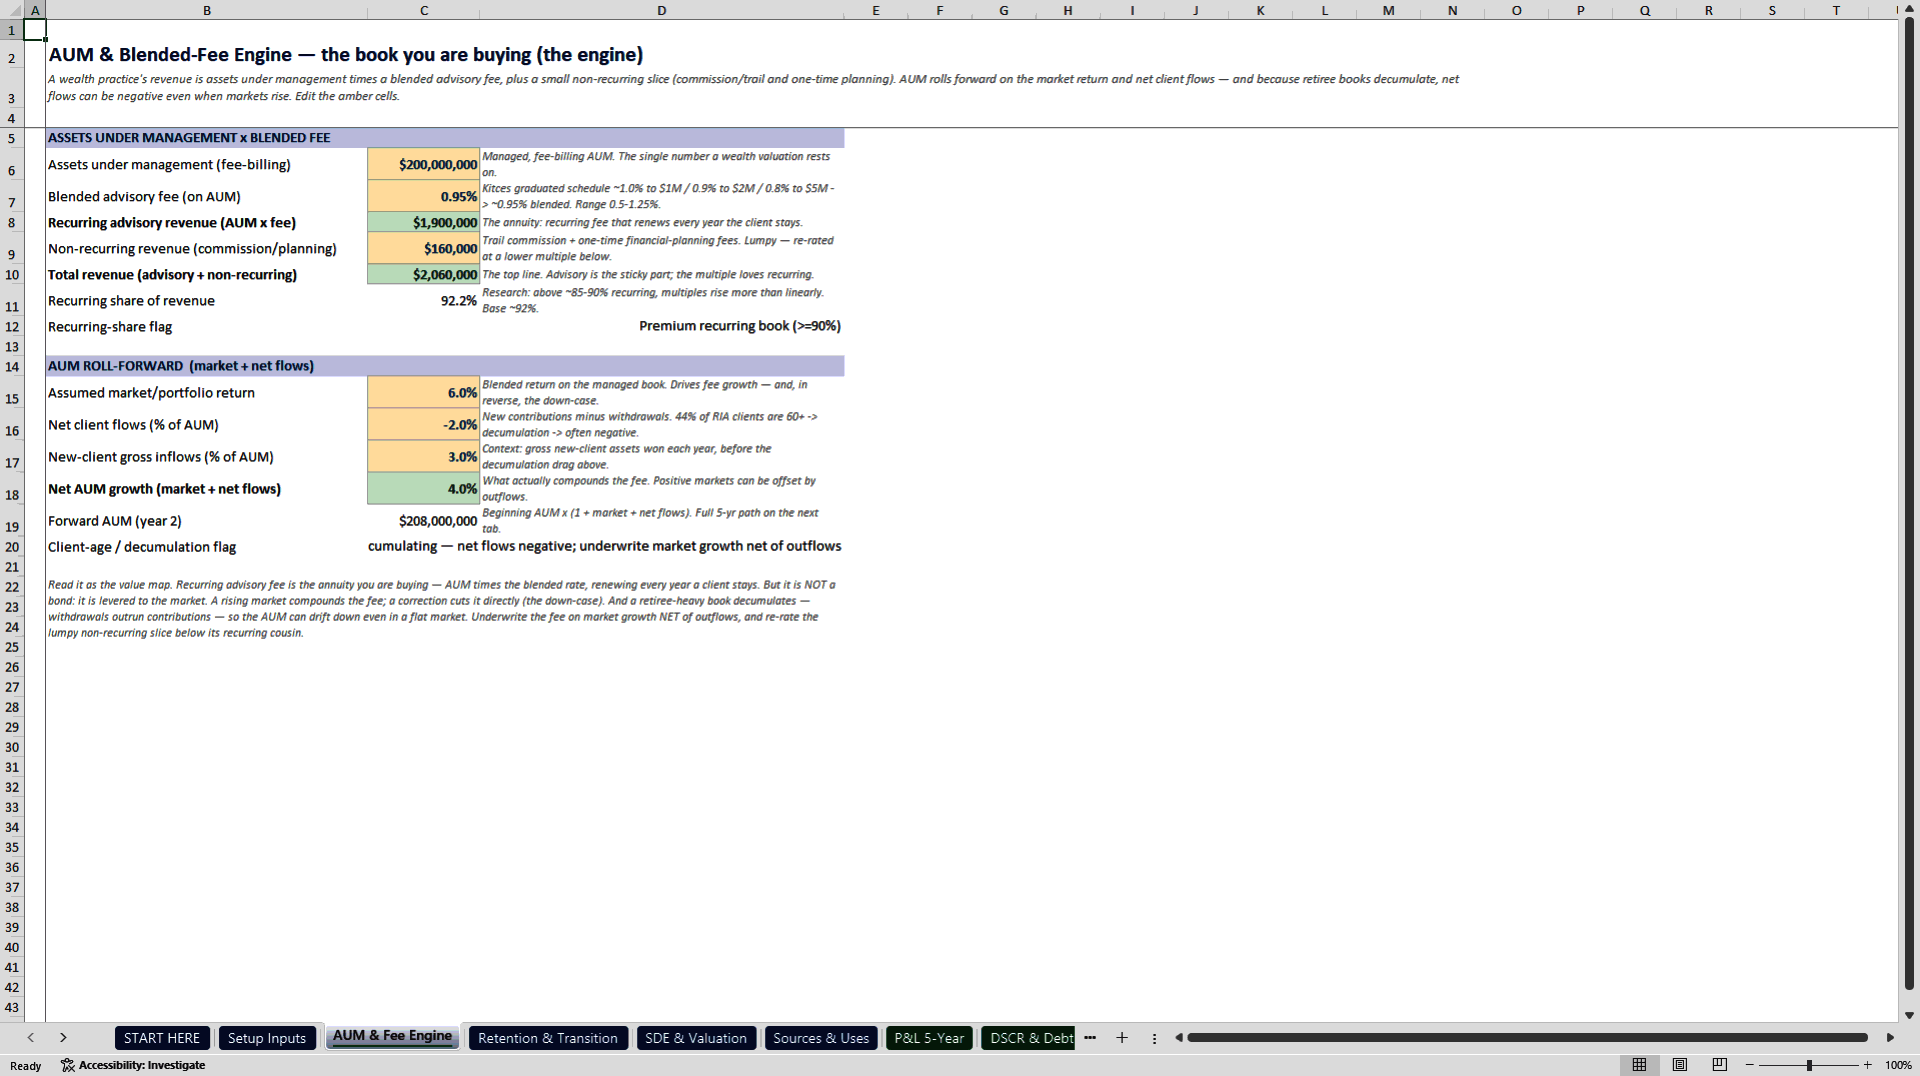
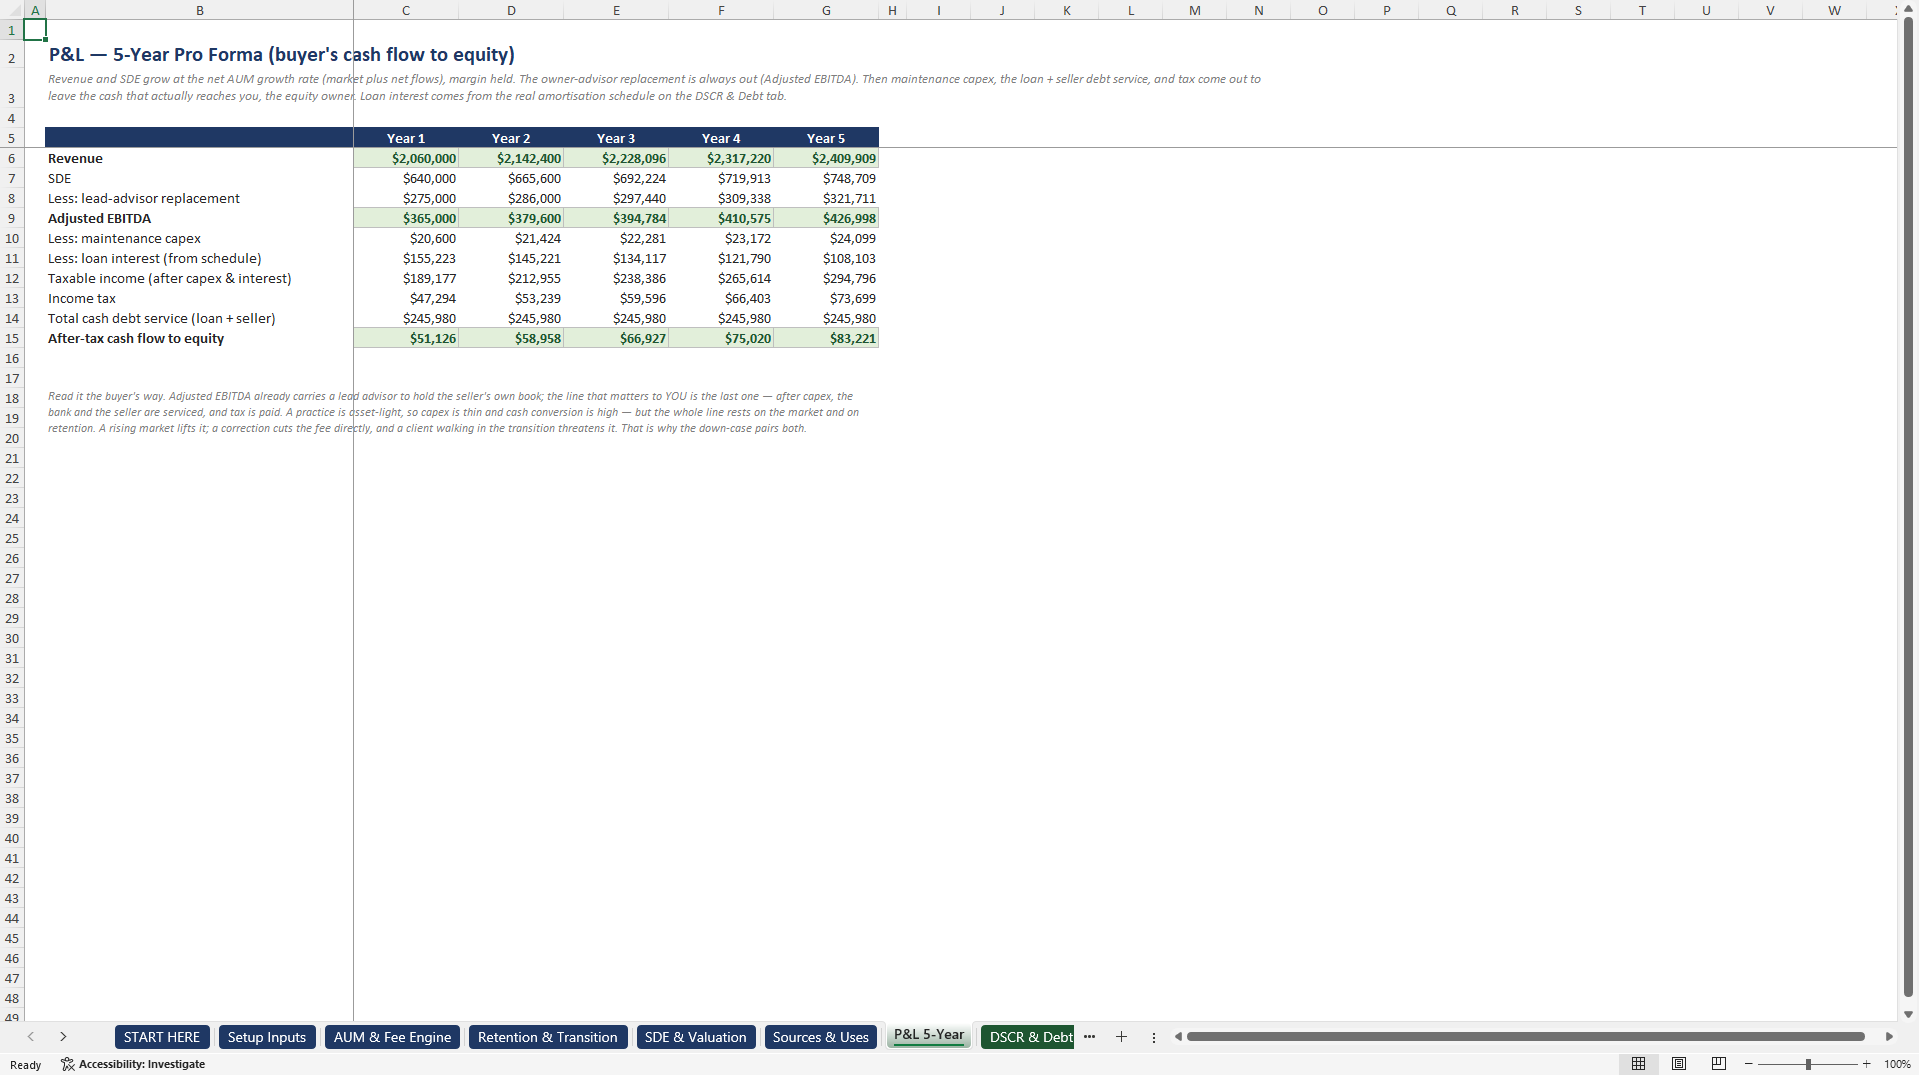
How the engine works. AUM of $200M runs through a graduated fee schedule to a blended rate near 0.95%, producing recurring advisory revenue, with planning and retainer fees and any transactional business added on their own lines; the recurring share is 92%. A retention and transition roll-forward carries client attrition explicitly, at 90-95% when a custodian move is handled well and 78-82% when it is botched, and an earnout can be tied to a 95%-at-month-24 benchmark. Because advisory fees are AUM-linked, the down-case is a market drawdown rather than a generic haircut: a 20% fall, damped by the fee-billing lag and combined with transition attrition, drives the DSCR to 0.80x, below a 1.25x floor. The base case shows a true DSCR of 1.40x against a naive broker-style 2.52x. The SBA 7(a) stack combines buyer equity, a seller note with a full-standby or amortising toggle used as a DSCR lever, and a loan sized to coverage; leverage lands near 66%, which the model states plainly, because a wealth book is goodwill-heavy and collateral-light, so a lender sizes to cash flow rather than to loan-to-value.
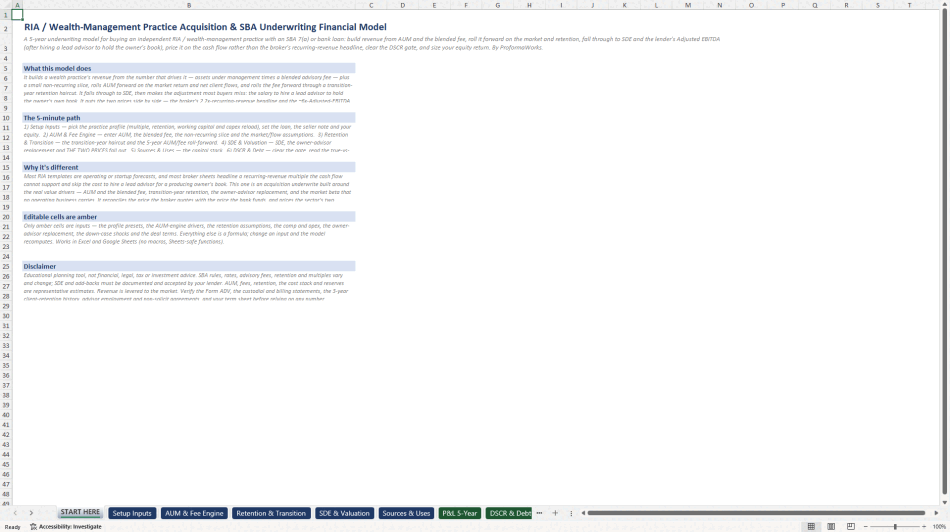
Inside are 11 tabs over a five-year horizon: the AUM roll-forward and blended-fee engine, revenue mix, retention and transition, valuation with both prices, the capital stack, a DSCR and debt gate with recurring-fee coverage and debt yield, the market-drawdown down-case, returns, three profiles ranging from transactional and hybrid-heavy at 5.0x to fee-only recurring-forward at 7.0x, and a dashboard. Every assumption is editable and highlighted, with no macros, so the file also opens in Google Sheets, and a 24-page PDF guide explains what each number means.
What it does not claim. SDE near 31% and Adjusted EBITDA near 18% are deliberately unflattering. There is no live IRR by design, and MOIC is flagged as leverage-amplified. It is an educational planning tool, not investment or financial advice.
Got a question about the product? Email us at support@flevy.com or ask the author directly by using the "Ask the Author a Question" form. If you cannot view the preview above this document description, go here to view the large preview instead.
Source: Best Practices in Wealth Management, Integrated Financial Model Excel: RIA & Wealth Management Practice Acquisition Model Excel (XLSX) Spreadsheet, ProformaWorks
ABOUT THE AUTHOR

ProformaWorks builds acquisition-grade financial models for Main Street and lower-middle-market businesses - the kind of deal financed with an SBA 7(a) loan or a small commercial facility.
Every model answers one question: does this deal pencil at the bank? That means SDE or NOI rebuilt from the seller's own numbers, the add-backs a lender will and will not accept, a debt-service
... [read more]
Ask the Author a Question
You must be logged in to contact the author.




























