 Click main image to view in full screen.
Price Elasticity Estimator: Breakeven and Profit Impact – Excel XLSX
Excel (XLSX) + supplemental PDF


BENEFITS OF THIS DOWNLOADABLE EXCEL DOCUMENT
- Estimates price elasticity for up to 100 products from your own weekly sales
- Shows whether a price change raises gross profit, with breakeven and a confidence range
- Checks your data first, then plans a different price change for each product
PRICING STRATEGY EXCEL DESCRIPTION
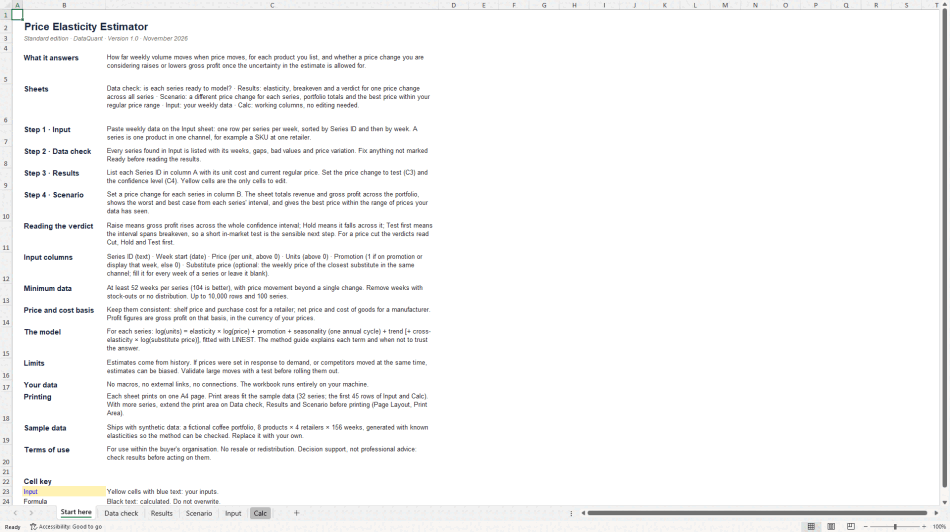
This Excel workbook estimates the price elasticity of each of your products from your own weekly sales history, then tells you whether a price change you are considering raises or lowers gross profit once the uncertainty in the estimate is taken into account.
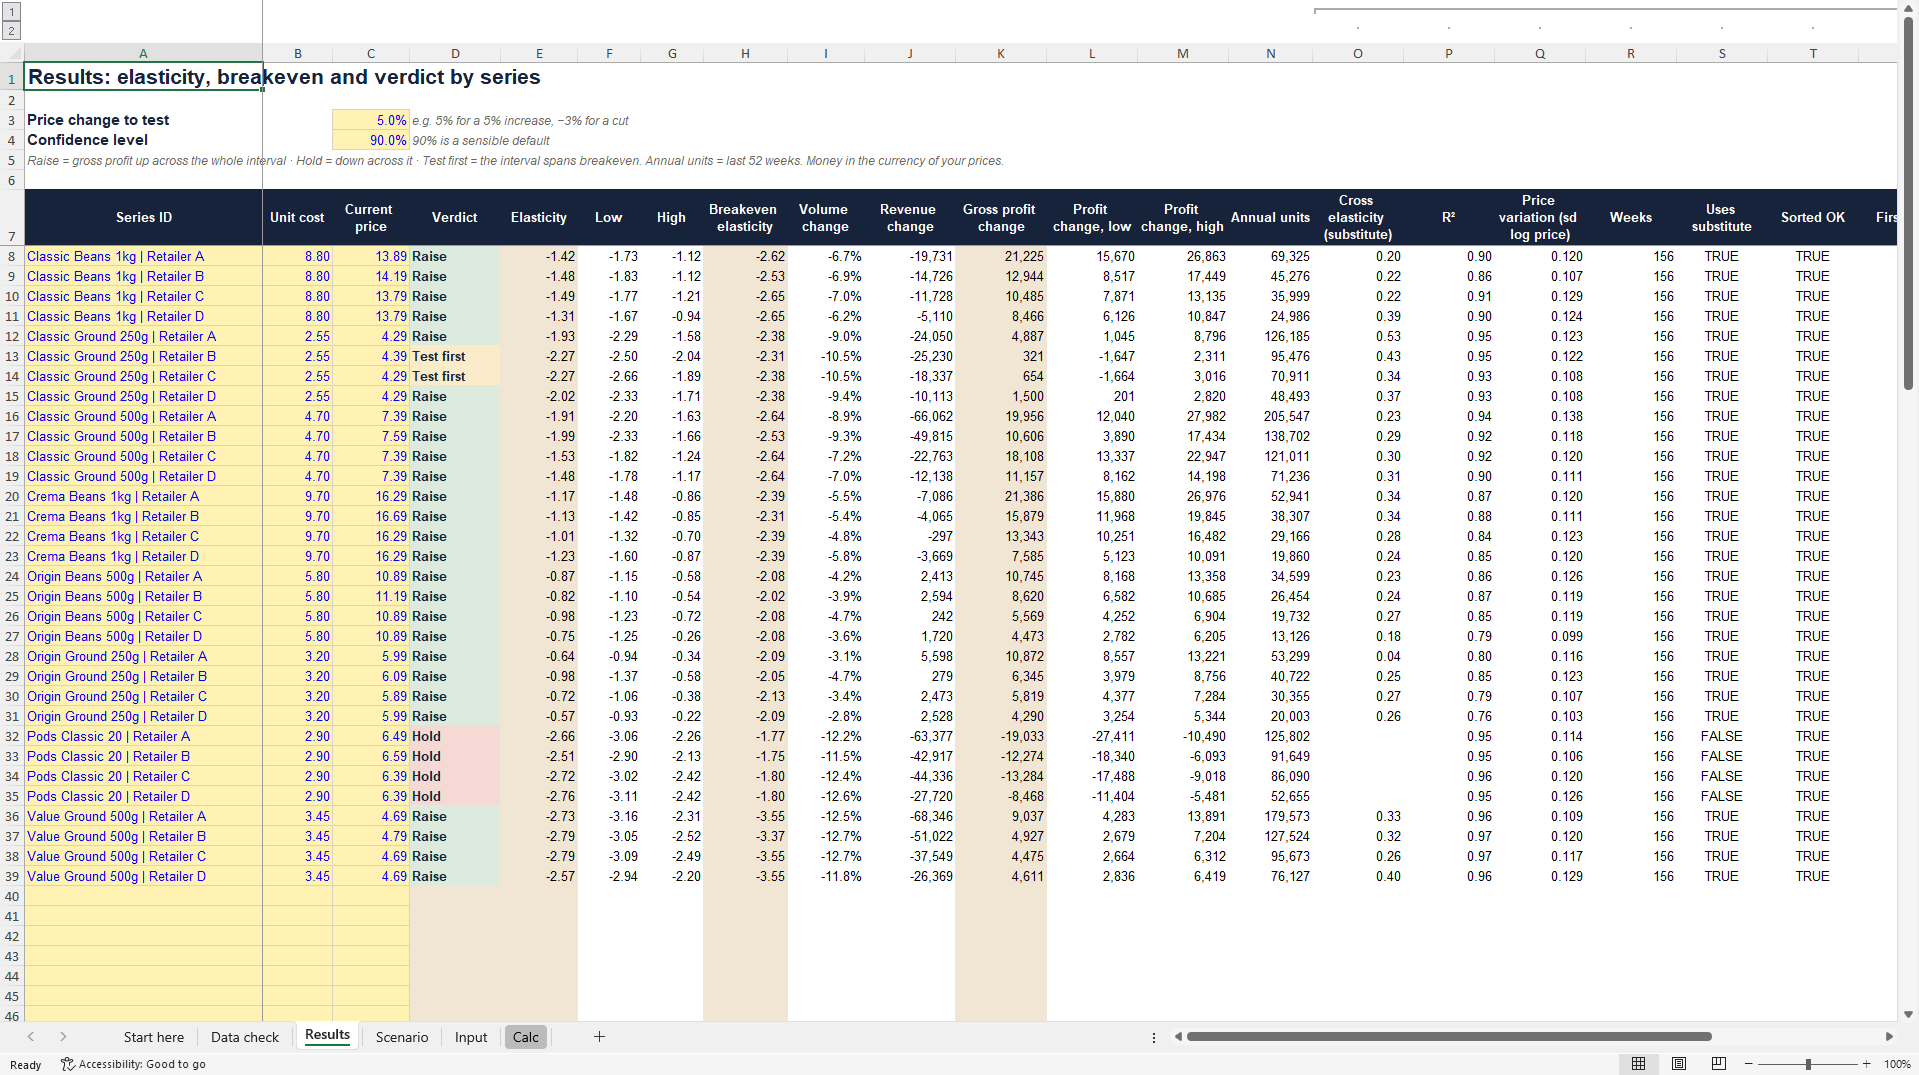
For every series (one product in one channel), it fits a log-log regression with Excel's LINEST function, controlling for promotions, seasonality, trend and, optionally, the price of the closest substitute. It returns the elasticity with a confidence interval, the breakeven elasticity for the price change you set, the change in volume, revenue and gross profit over a year, and a verdict: Raise, Hold or Test first.
The workbook has six sheets:
• Start here: instructions and the cell key.
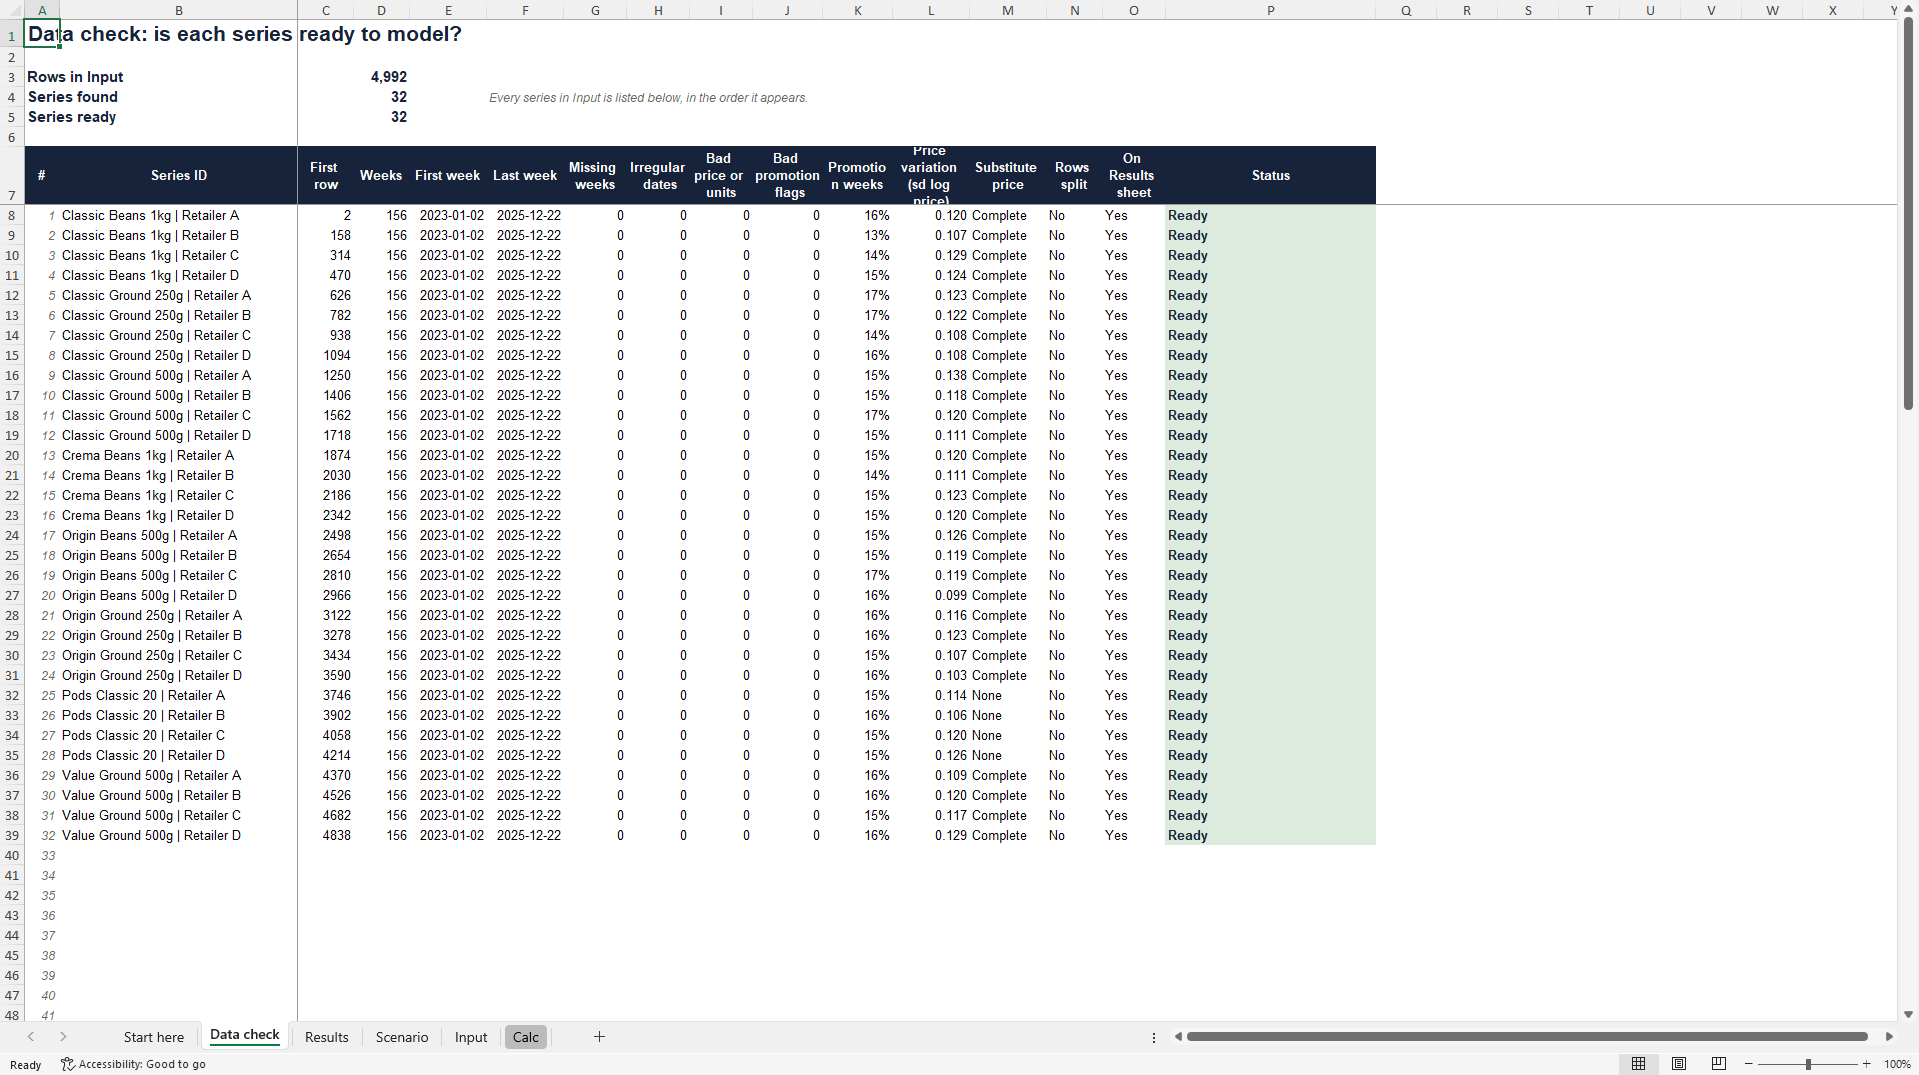
• Data check: lists every series in your data with its weeks, gaps, bad values, promotion share and price variation, and gives each a status, so problems are fixed before results are read.
• Results: elasticity, interval, breakeven and verdict for one price change applied to every series.
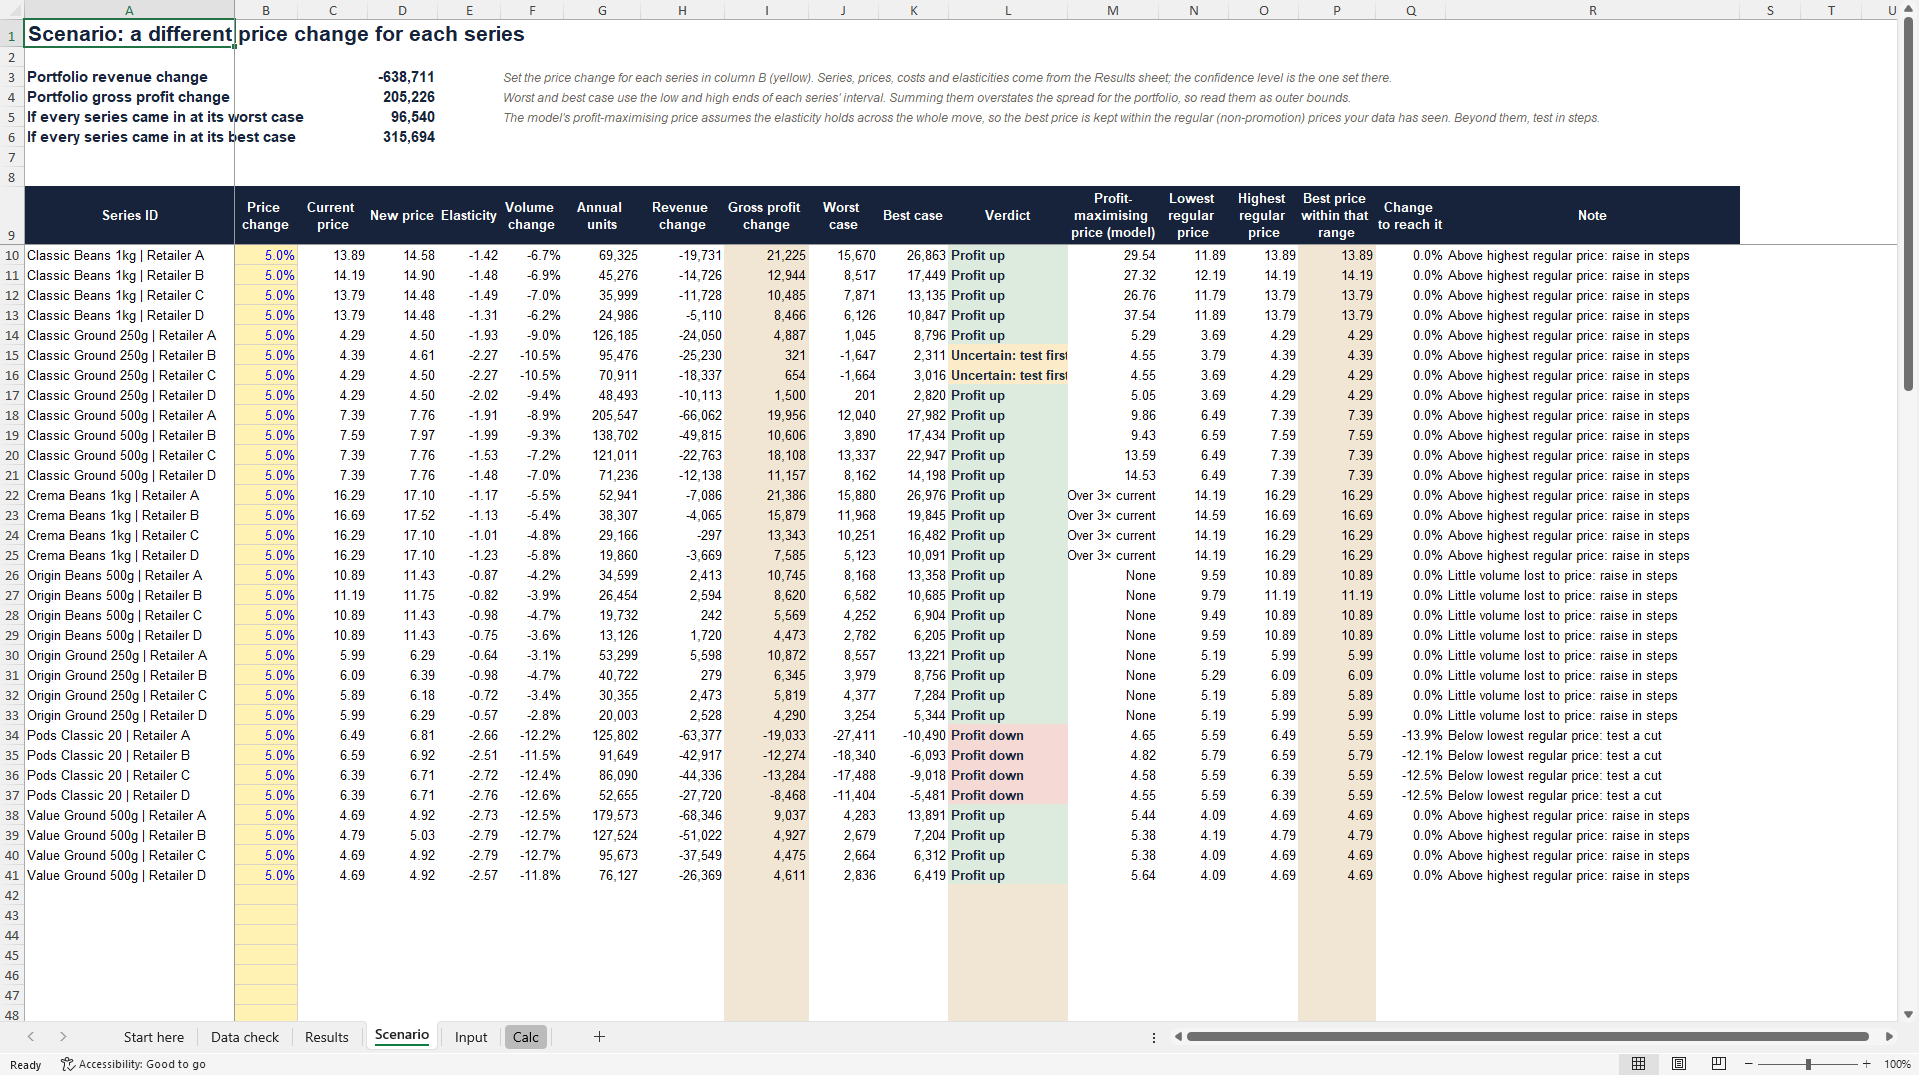
• Scenario: a different price change for each series, portfolio totals for revenue and gross profit, worst and best case, and the best price within the range of regular prices your data has seen.
• Input: up to 10,000 weekly rows and 100 series.
• Calc: working columns, no editing needed.
It ships with synthetic sample data for a fictional coffee portfolio (8 products, 4 retailers, 156 weeks), generated with known elasticities. On that data the estimates came within 0.14 of the planted values on average, and 31 of 32 confidence intervals contained the true value.
The secondary document is a 9-page method guide (PDF). It covers how to prepare your data, what each check and status means, how the model works, how to read every output, a worked example on the sample data, and when not to trust the answer.
Formulas only: no macros, no external links, no data connections. Built with standard functions available in Excel 2010 and later, Microsoft 365 and LibreOffice Calc. Works in any currency, as long as price and unit cost are on the same basis.
Suited to pricing, revenue management, category management and commercial finance teams in manufacturers, wholesalers and retailers.
Got a question about the product? Email us at support@flevy.com or ask the author directly by using the "Ask the Author a Question" form. If you cannot view the preview above this document description, go here to view the large preview instead.
Source: Best Practices in Pricing Strategy, Break Even Analysis Excel: Price Elasticity Estimator: Breakeven and Profit Impact Excel (XLSX) Spreadsheet, DataQuant
ABOUT THE AUTHOR

DataQuant is an analytics consultancy for manufacturers, distributors and retailers, focused on pricing, promotions, forecasting and working capital. We build decision tools that run on the client's own data, explain their assumptions in plain language and say when an answer should not be trusted. Every method is tested first on synthetic data with known answers, so its accuracy is measured ... [read more]
Ask the Author a Question
You must be logged in to contact the author.