This collection of HR KPIs is compiled by former McKinsey, BCG, Deloitte, EY, and Capgemini consultants based on best practices in Human Resource Management & Talent Management.
This presentation provides a comprehensive set of 800+ KPIs, ensuring that Human Resource Strategies are evidence-based, increasing the effectiveness of programs, such as DEI, Training, and Talent Management.
It offers a ready-to-use, extensive collection of KPIs, saving significant time and effort in research and compilation.
The wide range of KPIs allows for tailored selection and customization to fit specific industry needs and organizational goals, enhancing the relevance and impact of HR and Workforce and Talent Management initiatives.
DESCRIPTION
This product (KPI Compilation: 800+ Human Resource & Talent Management KPIs) is a 168-slide PPT PowerPoint presentation slide deck (PPTX), which you can download immediately upon purchase.
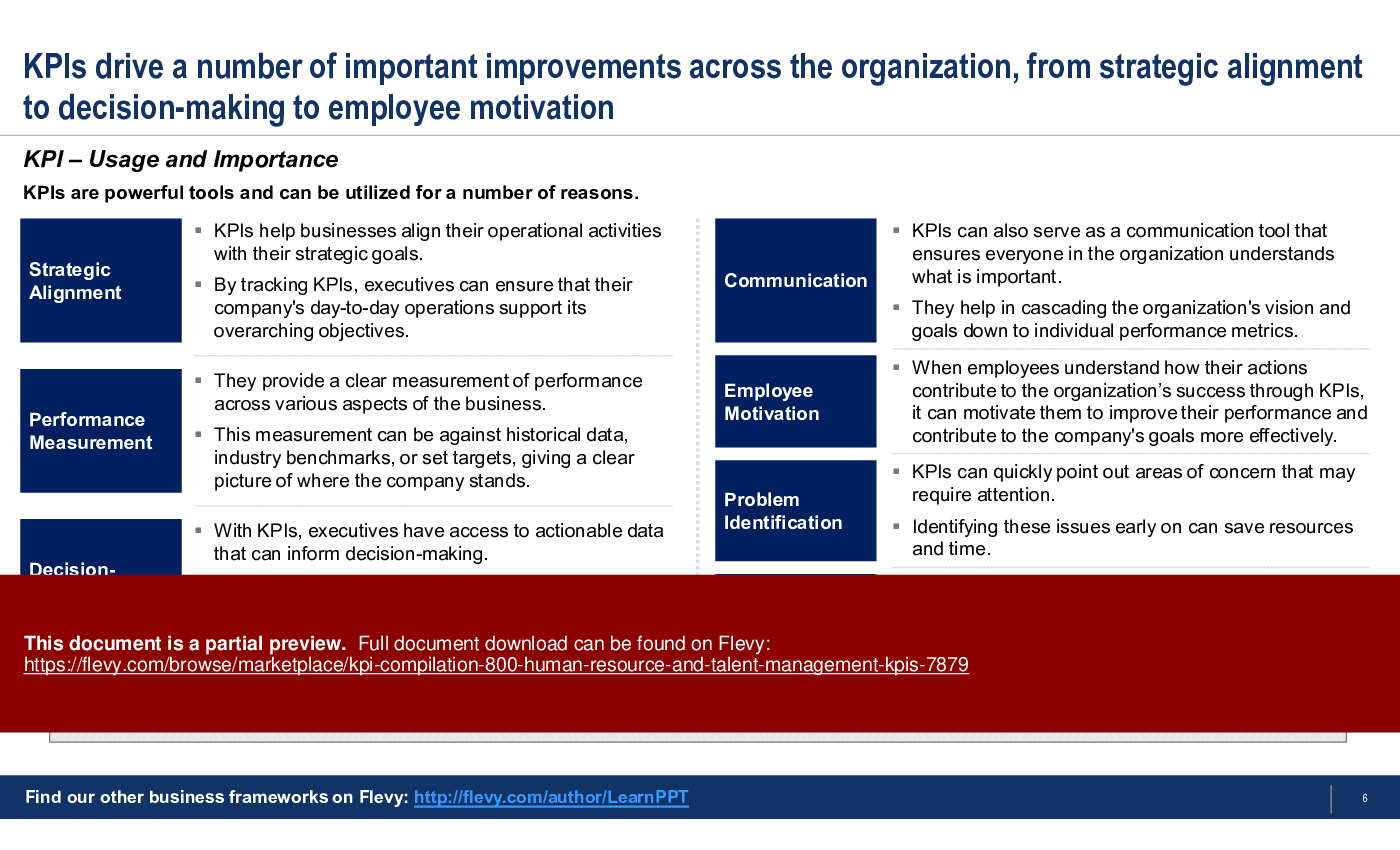
This presentation is a comprehensive collection of Key Performance Indicators (KPI) related to Human Resources and Talent Management. A KPI is a quantifiable measure used to evaluate the success of an organization, employee, or process in meeting objectives for performance.
KPIs are typically implemented at various levels within an organization, from the highest strategic level down to individual departments and teams. KPIs in Human Resources can provide deep insights into workforce dynamics, informing Strategic Planning, Talent Management, and Decision Making.
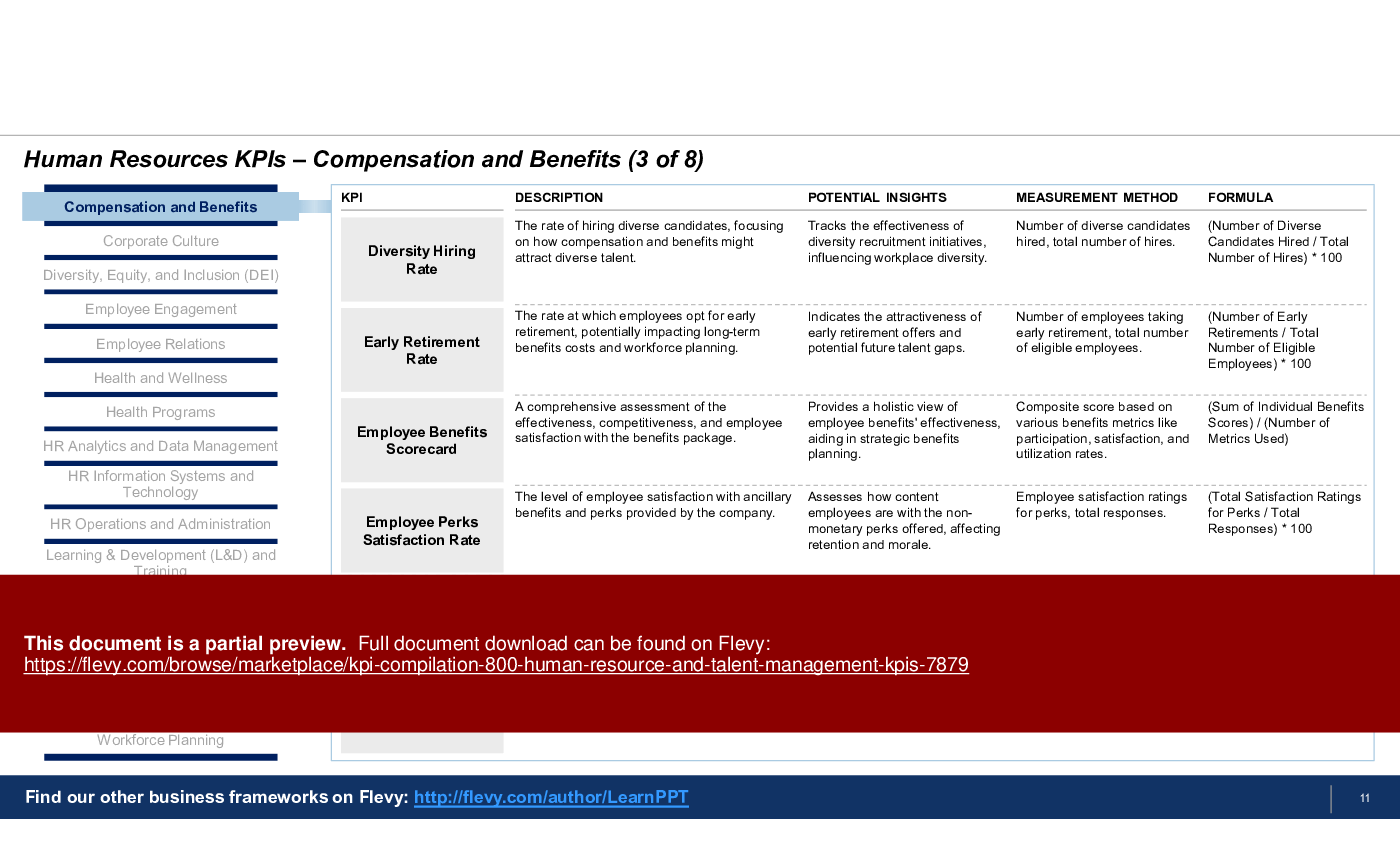
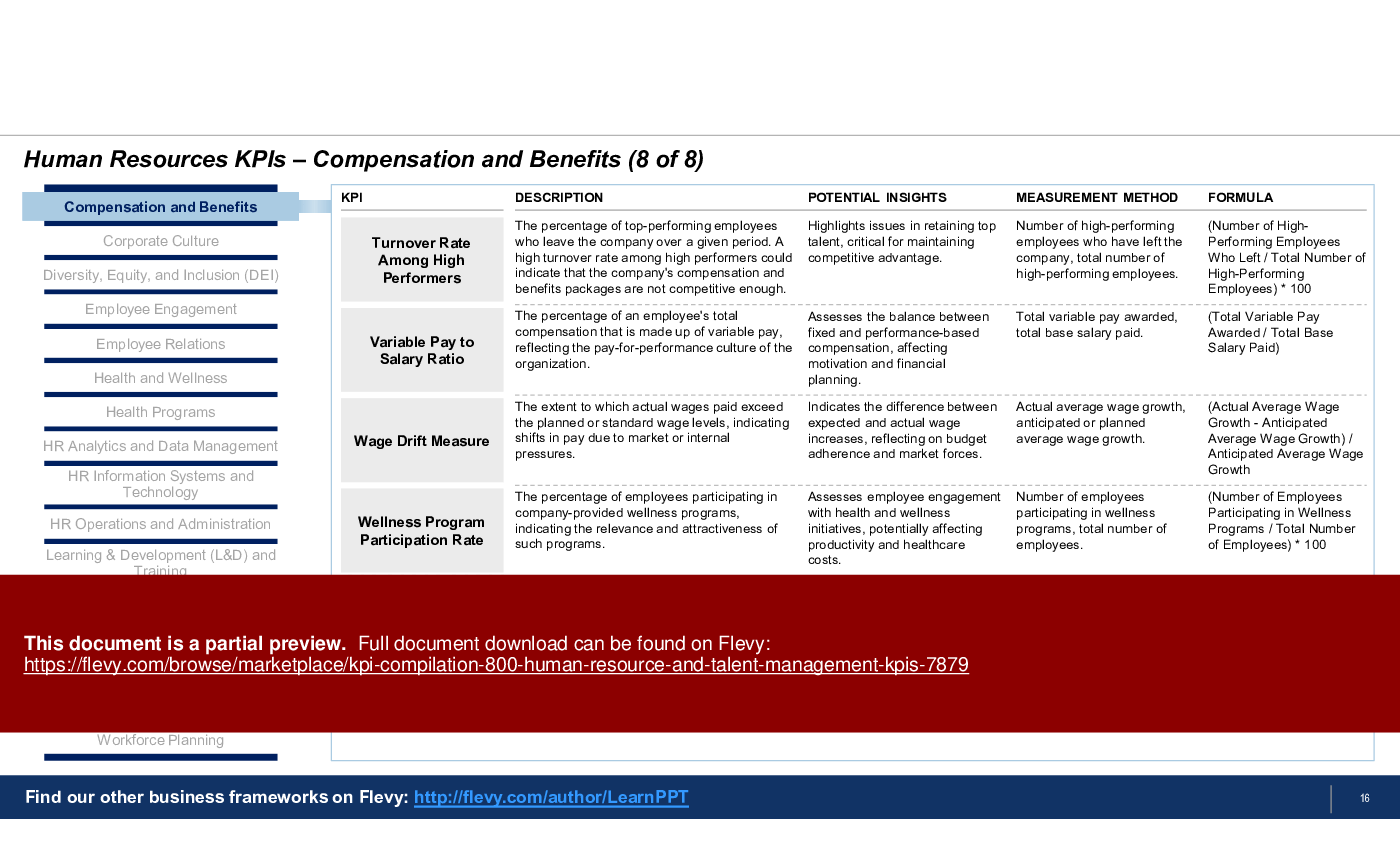
In total, we have compiled over 800+ HR KPIs in this PowerPoint presentation, categorized into the following 16 groups:
1. Compensation and Benefits – KPIs in this category help ensure competitive pay structures and benefits offerings, which are crucial for attracting and retaining top talent.
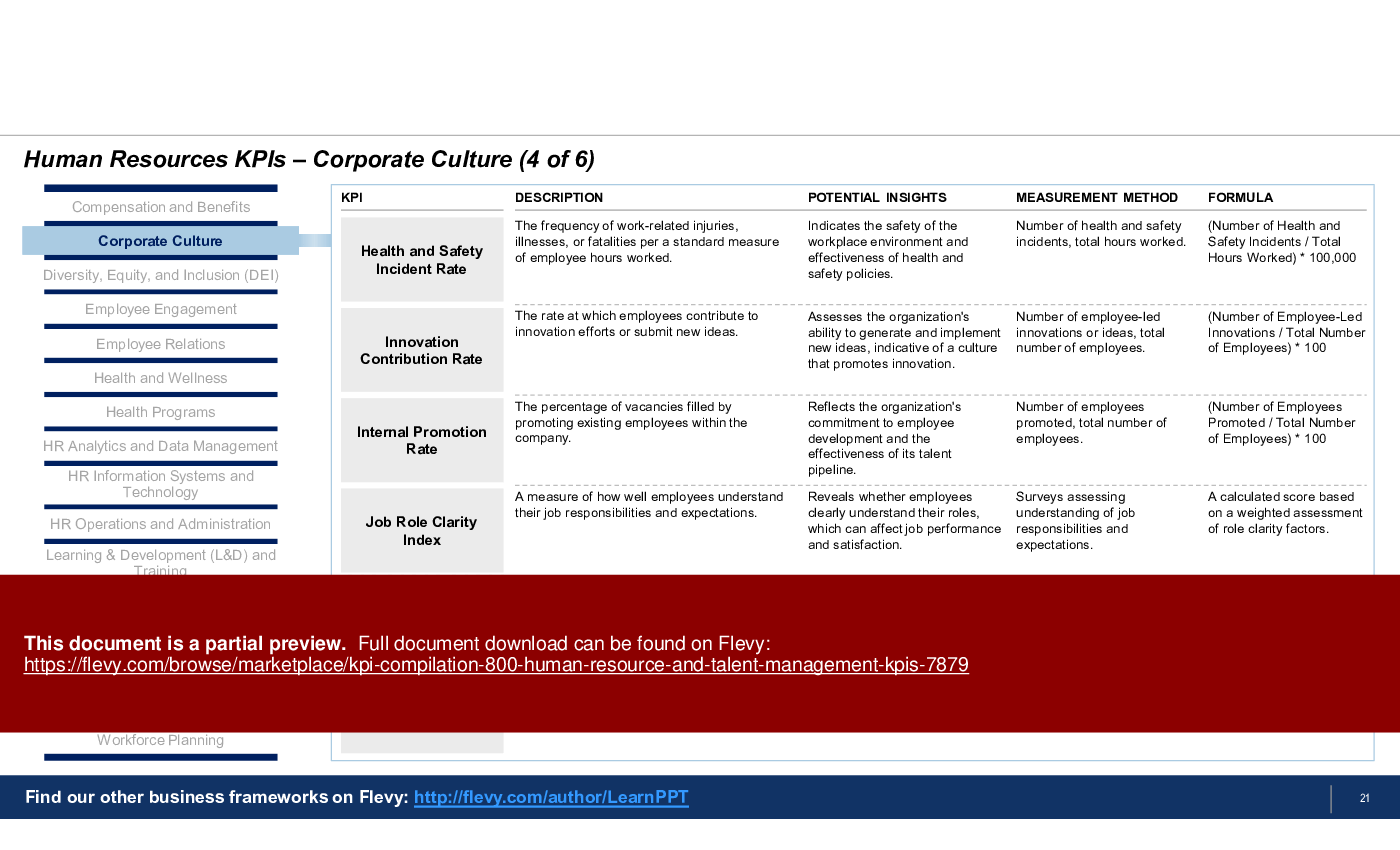
2. Corporate Culture – These KPIs measure the alignment of employee values with company values, providing insight into how culture influences Employee Productivity and Employee Retention.
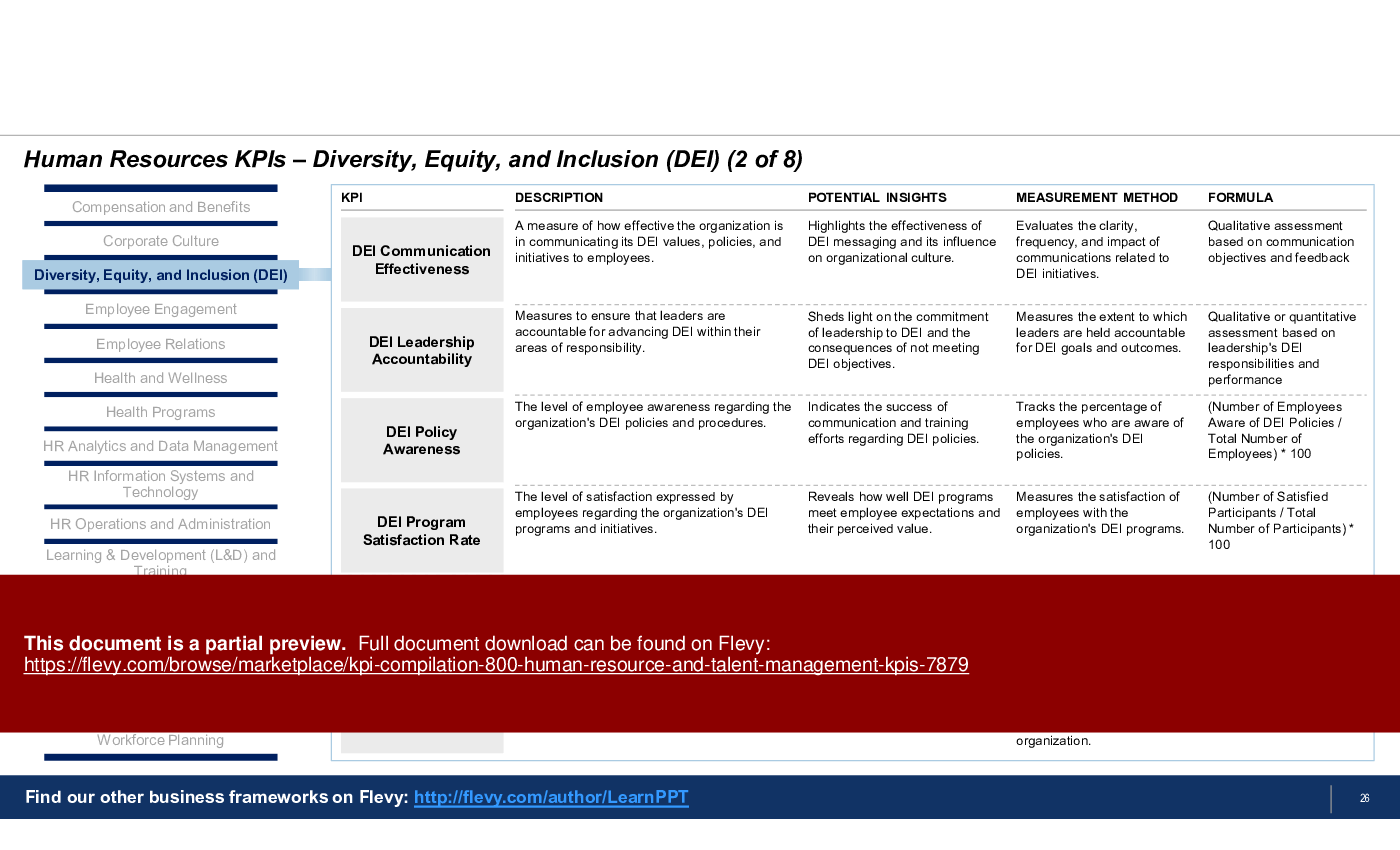
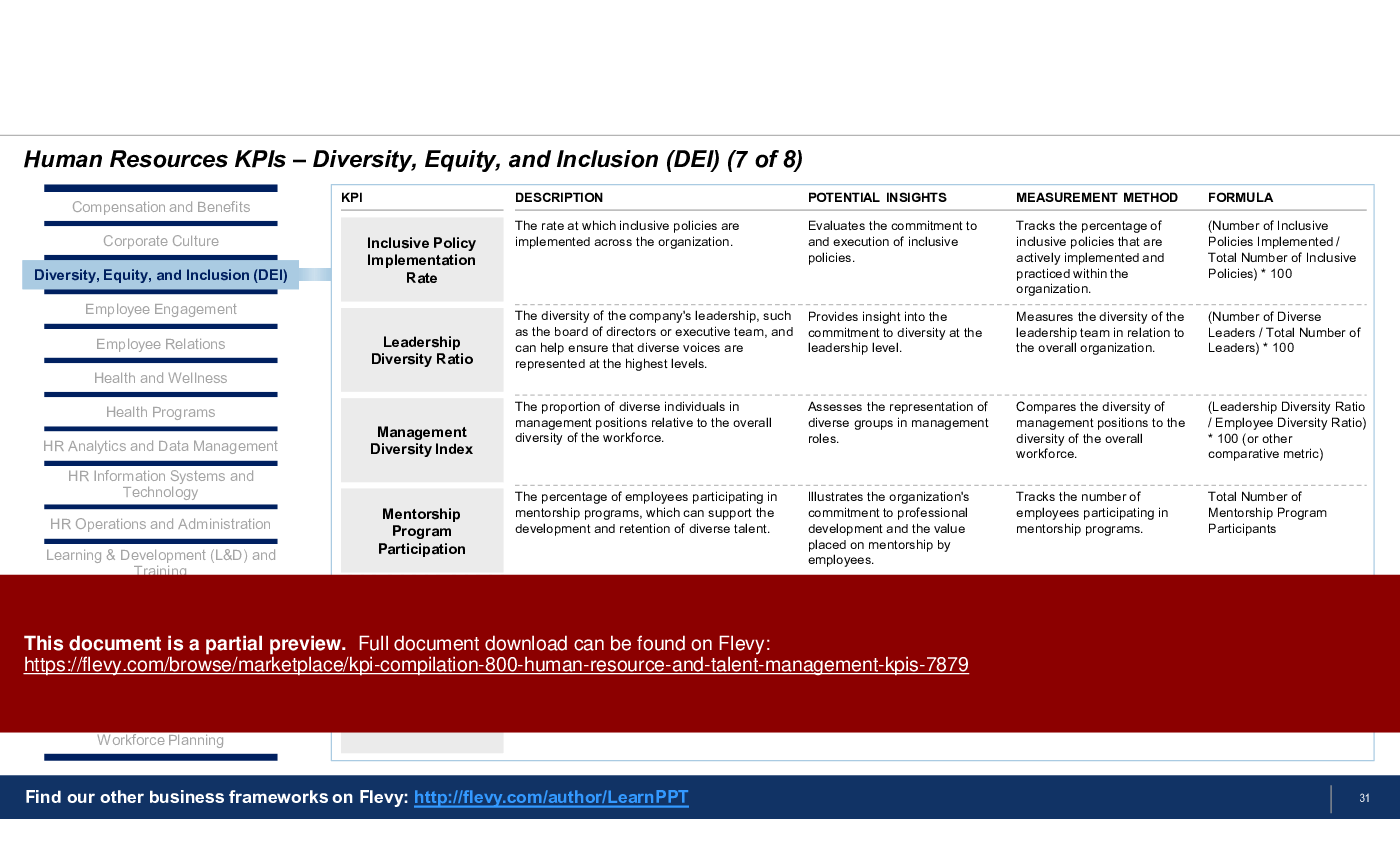
3. Diversity, Equity, and Inclusion (DEI) – DEI KPIs track the effectiveness of initiatives aimed at creating a diverse, fair, and inclusive workplace environment.
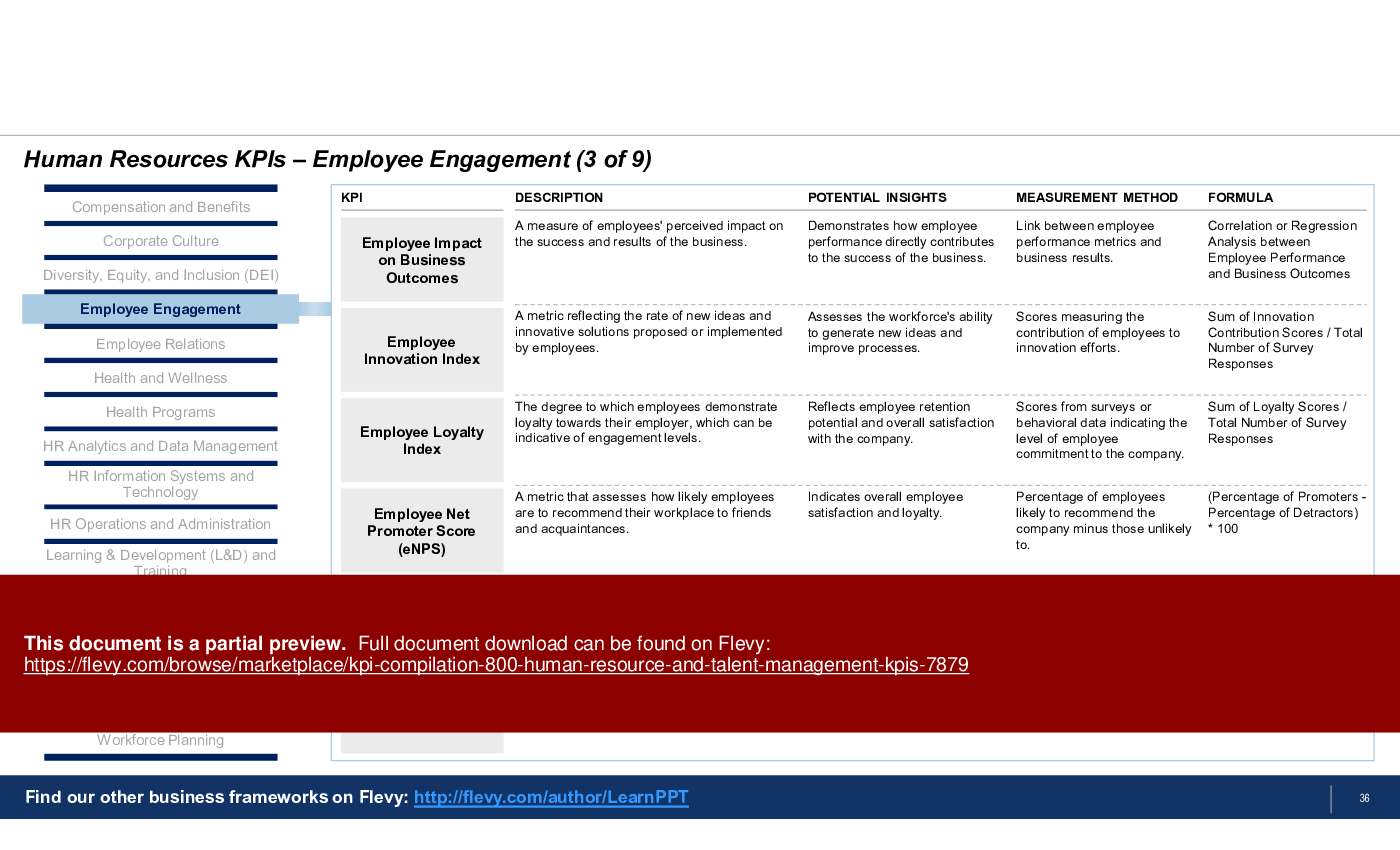
4. Employee Engagement – KPIs focused on Employee Engagement provide data on how invested employees are in their work and the company, which correlates with Productivity and Employee Satisfaction.
5. Employee Relations – This set of KPIs helps identify the quality of interactions between staff and management, aiming to foster a positive work environment and reduce conflict.
6. Health and Wellness – These KPIs assess the impact of company programs on employee health outcomes, contributing to a healthier, more productive workforce.
7. Health Programs – KPIs measure the usage and effectiveness of health-related programs, ensuring employees have the support they need to maintain their well-being.
8. HR Analytics and Data Management – These KPIs evaluate the effectiveness of HR data systems in providing actionable insights into Workforce Management and Strategy Development.
9. HR Information Systems and HR Technology – KPIs for HR technology track the efficiency and impact of HR systems on overall HR Service Delivery and Operational Effectiveness.
10. HR Operations and Administration – KPIs in this area assess the efficiency and quality of HR processes and services, driving administrative improvements and better resource allocation.
11. Learning & Development (L&D) and Training – L&D KPIs measure the return on investment in training programs, aligning employee growth with organizational goals.
12. Organizational Health – KPIs related to organizational health monitor the overall vitality and capability of the organization to endure and thrive in the marketplace.
13. Performance Management – Performance Management KPIs offer insights into how effectively Employee Performance is being measured and managed in alignment with business objectives.
14. Talent Acquisition and Recruiting – KPIs in Talent Acquisition help gauge the effectiveness of recruiting processes and the quality of new hires, impacting the company's long-term success.
15. Talent Management – These KPIs track the success of HR Strategies employed to develop, retain, and utilize employees to meet current and future business objectives.
16. Workforce Planning – Workforce Planning KPIs help anticipate and manage staffing needs, ensuring the right talent is in place to meet strategic business initiatives.
Many Fortune 500 companies engage top management consulting firms, like McKinsey, BCG, and Deloitte, to identify and implement KPIs, acknowledging their critical role in driving performance and strategic alignment, despite the significant investment this process entails.
This PowerPoint presentation also includes an introduction on KPIs, covering topics like KPI selection guidelines and common usages.
This extensive compilation of KPIs serves as a vital resource for organizations aiming to enhance their HR strategies and drive measurable outcomes. By leveraging these insights, executives can make informed decisions that align talent management efforts with overarching business goals, ensuring a robust and engaged workforce.
Got a question about the product? Email us at support@flevy.com or ask the author directly by using the "Ask the Author a Question" form. If you cannot view the preview above this document description, go here to view the large preview instead.
Source: Best Practices in Human Resources, Performance Management, HR Strategy, Key Performance Indicators PowerPoint Slides: KPI Compilation: 800+ Human Resource & Talent Management KPIs PowerPoint (PPTX) Presentation Slide Deck, LearnPPT Consulting
This PPT slide presents a set of key performance indicators (KPIs) focused on HR analytics and data management. It outlines various metrics that assess the effectiveness of HR data systems in providing insights into workforce management and strategy development. Each KPI is accompanied by a description, potential insights, measurement methods, and formulas for calculation.
The first KPI, "360-Degree Feedback Completion Rate," measures the percentage of completed feedback assessments. This metric reflects the organization's commitment to comprehensive performance evaluations and helps identify obstacles in completion rates. The formula provided allows for straightforward calculation based on the number of completed surveys relative to the total required.
Next, the "Absenteeism Rate" indicates the percentage of working days lost due to employee absence, which can impact productivity. Understanding this rate is crucial for managing workplace reliability and addressing potential issues related to job satisfaction.
The "Attrition Rate" tracks the percentage of employees leaving the organization, offering insights into organizational stability and workforce satisfaction. This metric aids in planning for replacements and hiring strategies.
The "Career Path Ratio" assesses the number of defined career paths against employee roles, revealing the effectiveness of career development programs. The "Compensation Competitiveness Ratio" compares the organization’s compensation packages to market averages, indicating whether strategies are sufficient to attract and retain talent.
Lastly, the "Cost per Hire" metric evaluates the total recruitment costs divided by the number of hires, providing a clear view of the efficiency and cost-effectiveness of the hiring process. Collectively, these KPIs serve as essential tools for organizations aiming to enhance their HR strategies and workforce management practices.
This PPT slide presents a detailed overview of key performance indicators (KPIs) specifically related to HR information systems and technology. It outlines various metrics that organizations can utilize to assess the efficiency and impact of their HR systems on service delivery and operational effectiveness. Each KPI is accompanied by a description, potential insights, measurement methods, and formulas for calculation.
The first KPI, "Average HRIS Training Time," measures how long it takes for employees to complete training on the HR information system. This metric is crucial for identifying training efficiency and pinpointing areas for improvement. The second KPI, "Average Time to Complete HRIS Tasks," assesses the usability of the HR system by tracking the time taken to finish specific HR-related tasks. This helps gauge the system's user-friendliness.
"Benefits Administration Accuracy" evaluates how effectively employee benefits are managed within the HR system, providing insights into the reliability of the benefits administration process. The "Cost Savings through Automation" KPI highlights the financial benefits of automating HR processes, emphasizing the potential for cost reduction and efficiency gains.
Data accuracy is another critical KPI, as it assesses the quality of information stored in the HR system, which is vital for informed decision-making. Lastly, "Employee Career Development" tracks the effectiveness of the HR system in supporting employee growth initiatives, ensuring that organizations can monitor and facilitate career progression.
Overall, this slide serves as a comprehensive resource for organizations looking to enhance their HR technology strategies by focusing on measurable outcomes and operational improvements.
This PPT slide presents a series of Key Performance Indicators (KPIs) that assess how corporate culture aligns with employee values, ultimately influencing productivity and retention. Each KPI is accompanied by a description and potential insights, providing a clear framework for understanding the metrics.
The first KPI, "360-Degree Feedback Completion Rate," measures the percentage of completed feedback assessments. This metric reflects employee engagement in the feedback process and can indicate the level of openness within the organization. A high completion rate suggests a culture that values communication and employee input.
Next, the "Absenteeism Rate" tracks the percentage of workdays missed without valid reasons. This KPI helps identify patterns of absence, which can signal underlying issues affecting employee morale or engagement. Understanding absenteeism is crucial for addressing potential retention challenges.
The "Career Path Ratio" compares available career advancement opportunities to the number of employees seeking growth. This metric indicates the organization's commitment to employee development and can highlight areas for improvement in internal career progression.
The "Change Readiness Index" assesses how prepared the organization and its employees are to adapt to change. This KPI is vital for organizations looking to implement new strategies or processes, as it measures adaptability and responsiveness.
"Conflict Resolution Effectiveness" evaluates how well workplace conflicts are resolved, shedding light on the organization's collaborative environment. A high effectiveness score suggests a healthy culture that can manage disputes constructively.
Lastly, the "Cross-Departmental Collaboration" KPI measures the frequency and quality of collaboration between departments. This insight is essential for fostering a cooperative culture that enhances overall organizational performance.
These KPIs collectively provide a comprehensive view of how corporate culture impacts employee engagement and retention, making them valuable for any organization aiming to enhance its workplace environment.
This PPT slide presents a detailed overview of key performance indicators (KPIs) related to health and wellness within an organization. It emphasizes the importance of these metrics in evaluating the effectiveness of employee programs aimed at improving health outcomes and productivity. Each KPI is accompanied by a description, potential insights, measurement methods, and formulas for calculation.
The first KPI, Absenteeism Rate, measures the percentage of employees absent due to illness or injury. This metric is crucial for identifying trends that may indicate underlying issues within the workplace, such as employee dissatisfaction or health-related concerns. The formula provided allows for straightforward calculation, facilitating ongoing monitoring.
Next, the Alcohol and Substance Abuse Recovery Rate assesses the success of recovery programs for employees dealing with substance abuse. This KPI offers insights into the effectiveness of support systems in place, helping organizations understand their impact on employee recovery and overall workplace morale.
Average Sick Days Per Employee provides a broader view of employee health by indicating the average number of sick days taken. This metric can highlight potential wellness needs and inform initiatives aimed at improving employee health.
The Back Injury Rate focuses on workplace ergonomics, measuring the incidence of back injuries among employees. This KPI is essential for evaluating the effectiveness of safety practices and ergonomic interventions.
Behavioral Health Claim Rate and Biometric Screening participation are also included, revealing the prevalence of mental health issues and employee engagement in preventive health practices, respectively. These insights can guide organizations in tailoring their health programs to better meet employee needs.
Overall, the slide serves as a foundational resource for organizations looking to enhance their health and wellness initiatives, providing actionable metrics that can drive strategic decision-making.
This PPT slide presents a structured overview of key performance indicators (KPIs) related to compensation and benefits within human resources. Each KPI is accompanied by a description, potential insights, measurement methods, and formulas for calculation. This format allows for a clear understanding of how each metric contributes to the broader objectives of attracting and retaining talent.
The first KPI, Absenteeism Rate, highlights the importance of monitoring employee absence, which can directly affect productivity and operational efficiency. The formula provided allows organizations to quantify this metric, offering a straightforward way to assess its impact.
Next, the Average Salary Increase Rate indicates how well an organization is managing salary adjustments over time. This can reflect the company's strategy in retaining talent and responding to market conditions. The insights derived from this KPI can inform salary review processes and retention strategies.
The Benefits Cost as a Percentage of Payroll presents a financial perspective, showing how much of the payroll budget is allocated to employee benefits. This metric is crucial for assessing the sustainability and cost-effectiveness of benefits packages.
The Benefits Participation Rate and Benefits Utilization Rate KPIs focus on employee engagement with available benefits. High participation and utilization rates suggest that employees find value in the offerings, which can enhance overall job satisfaction and loyalty.
Lastly, the Bonus Payout Ratio provides insight into the effectiveness of incentive programs, linking employee performance to compensation. This can help organizations evaluate their reward systems and align them with performance goals.
Overall, the slide serves as a valuable resource for HR leaders aiming to optimize their compensation and benefits strategies, ensuring they align with organizational goals and employee needs.
This PPT slide presents key performance indicators (KPIs) focused on employee engagement, which are essential for understanding how committed employees are to their roles and the organization. It outlines various metrics that correlate employee involvement with productivity and satisfaction levels.
The KPIs listed include Absenteeism Rate, Career Path Ratio, Company Mission & Values Alignment, Cross-Departmental Collaboration, Diversity & Inclusion Progress, and Employee Advocacy. Each KPI is accompanied by a description that explains its significance. For instance, the Absenteeism Rate reflects employee morale and potential issues related to engagement or health. The Career Path Ratio indicates how effectively employees are advancing within the organization, which can signal the success of development programs.
The slide also highlights potential insights derived from these metrics. For example, the Company Mission & Values Alignment measures how well employees resonate with the organization's core values, which can impact overall commitment. Cross-Departmental Collaboration assesses the frequency of interdepartmental interactions, revealing opportunities for innovation and teamwork.
Measurement methods and formulas are provided for each KPI, ensuring clarity on how these metrics can be quantified. This structured approach allows organizations to track their employee engagement levels systematically, enabling data-driven decisions that can enhance workplace culture and performance.
Overall, the slide serves as a comprehensive guide for organizations looking to assess and improve employee engagement through targeted metrics. It emphasizes the importance of measuring these aspects to foster a more invested workforce, ultimately leading to better organizational outcomes.
This collection of HR KPIs is compiled by former McKinsey, BCG, Deloitte, EY, and Capgemini consultants based on best practices in Human Resource Management & Talent Management.
We are a team of management consultants trained by top tier global consulting firms (including McKinsey, BCG, Deloitte, EY, Capgemini) with a collective experience of several decades. We specialize in business frameworks based on real-life consulting engagements.
We have served 100s of clients that range from Fortune 500 companies to tech startups to
... [read more] $1B+ private companies.
Utilize our consulting frameworks to apply structured thinking & analysis to address your business challenges, uncover strategic insights, and implement workable solutions. Our PowerPoint presentations follow traditional consulting slide design formats, starting with a clear slide headline. Easily customize and repurpose our slides for your own business presentations.
Beyond business frameworks & methodologies, we also offer PowerPoint templates and other business templates. Our templates are professionally designed and have been used in thousands of deliverables & work products across hundreds of clients.
Since 2012, we have provided best practices to over 10,000 businesses and organizations of all sizes, from startups and small businesses to the Fortune 100, in over 130 countries.
Read Customer Testimonials
"I am extremely grateful for the proactiveness and eagerness to help and I would gladly recommend the Flevy team if you are looking for data and toolkits to help you work through business solutions."
– Trevor Booth, Partner, Fast Forward Consulting
"The wide selection of frameworks is very useful to me as an independent consultant. In fact, it rivals what I had at my disposal at Big 4 Consulting firms in terms of efficacy and organization."
– Julia T., Consulting Firm Owner (Former Manager at Deloitte and Capgemini)
"I have used Flevy services for a number of years and have never, ever been disappointed. As a matter of fact, David and his team continue, time after time, to impress me with their willingness to assist and in the real sense of the word. I have concluded in fact
that it is not at all just a repository of documents/resources but, in the way that David and his team manage the firm, it is like dealing with consultants always ready to assist, advise and direct you to what you really need, and they always get it right.
I am an international hospitality accomplished senior executive who has worked and lived during the past 35 years in 23 countries in 5 continents and I can humbly say that I know what customer service is, trust me.
Aside from the great and professional service that Flevy's team provide, their wide variety of material is of utmost great quality, professionally put together and most current.
Well done Flevy, keep up the great work and I look forward to continue working with you in the future and to recommend you to a variety of colleagues around the world.
"
– Roberto Pelliccia, Senior Executive in International Hospitality
"I have found Flevy to be an amazing resource and library of useful presentations for lean sigma, change management and so many other topics. This has reduced the time I need to spend on preparing for my performance consultation. The library is easily accessible and updates are regularly provided. A wealth of great information."
– Cynthia Howard RN, PhD, Executive Coach at Ei Leadership
"FlevyPro provides business frameworks from many of the global giants in management consulting that allow you to provide best in class solutions for your clients."
– David Harris, Managing Director at Futures Strategy
"FlevyPro has been a brilliant resource for me, as an independent growth consultant, to access a vast knowledge bank of presentations to support my work with clients. In terms of RoI, the value I received from the very first presentation I downloaded paid for my subscription many times over! The
quality of the decks available allows me to punch way above my weight – it's like having the resources of a Big 4 consultancy at your fingertips at a microscopic fraction of the overhead.
"
– Roderick Cameron, Founding Partner at SGFE Ltd
"Flevy is our 'go to' resource for management material, at an affordable cost. The Flevy library is comprehensive and the content deep, and typically provides a great foundation for us to further develop and tailor our own service offer."
– Chris McCann, Founder at Resilient.World
"Flevy.com has proven to be an invaluable resource library to our Independent Management Consultancy, supporting and enabling us to better serve our enterprise clients.
The value derived from our [FlevyPro] subscription in terms of the business it has helped to gain far exceeds the investment made, making a subscription a no-brainer for any growing consultancy – or in-house strategy team."
– Dean Carlton, Chief Transformation Officer, Global Village Transformations Pty Ltd.
Save with Bundles
This document is available as part of the following discounted bundle(s):
Download our free compilation of 50+ slides and templates on Organizational Design, Change Management, and Corporate Culture. Methodologies include ADKAR, Burke-Litwin Change Model, McKinsey 7-S, Competing Values Framework, etc.