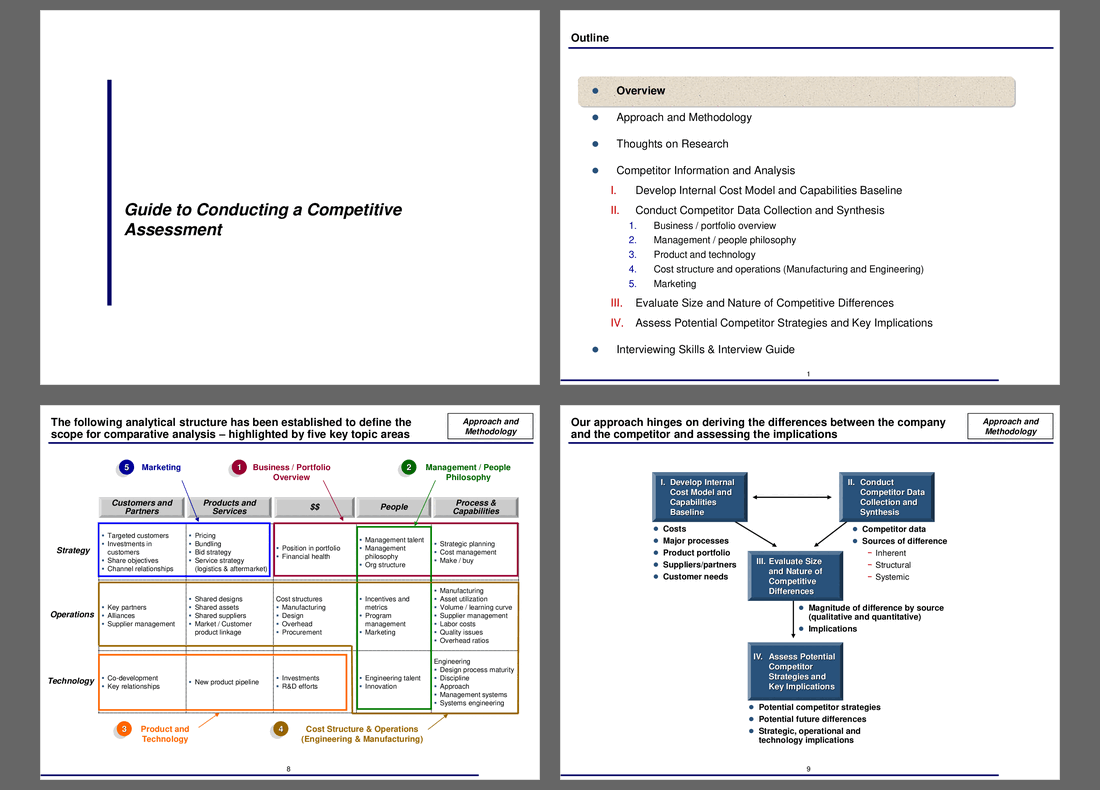

Guide to Competitive Assessment – PowerPoint PPT Template
PowerPoint (PPT) 122 Slides
COMPETITIVE ANALYSIS PPT TEMPLATE DESCRIPTION
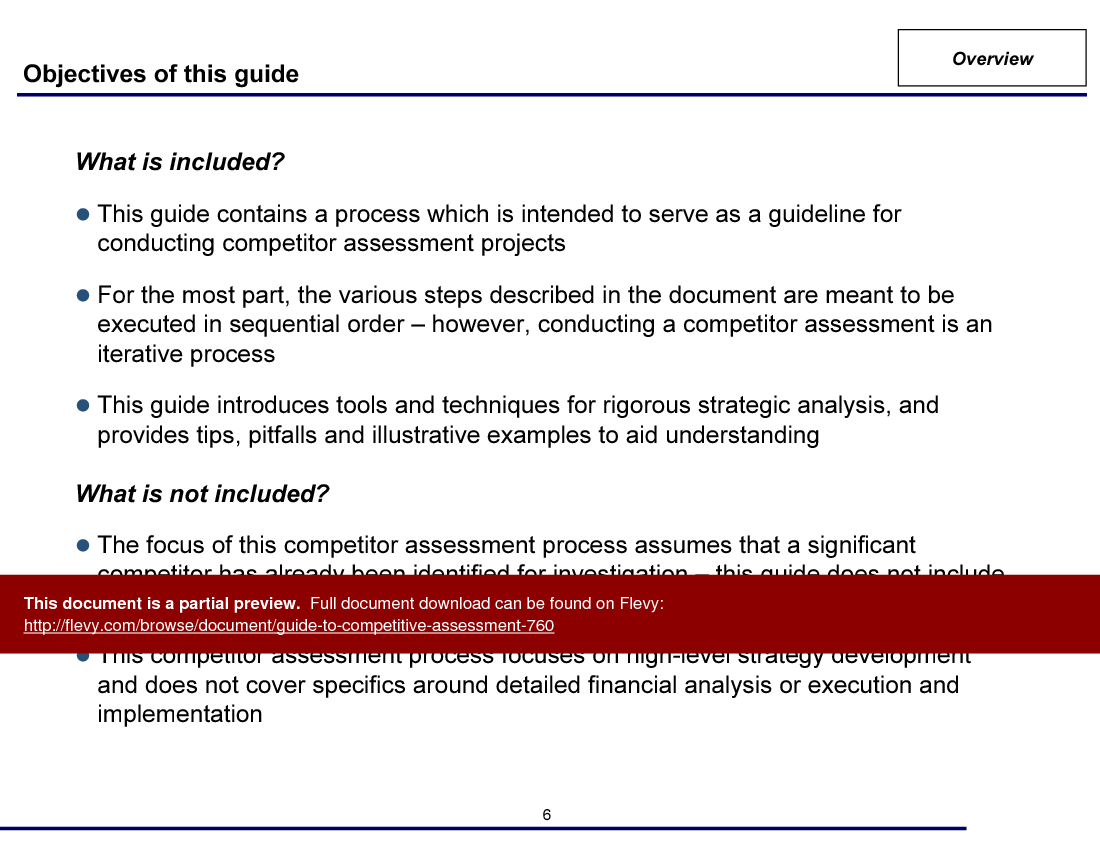
This guide is developed to provide a structured approach for conducting a high quality competitive analysis. It provides a detailed approach and methodology for competitor assessment in five key topic areas:
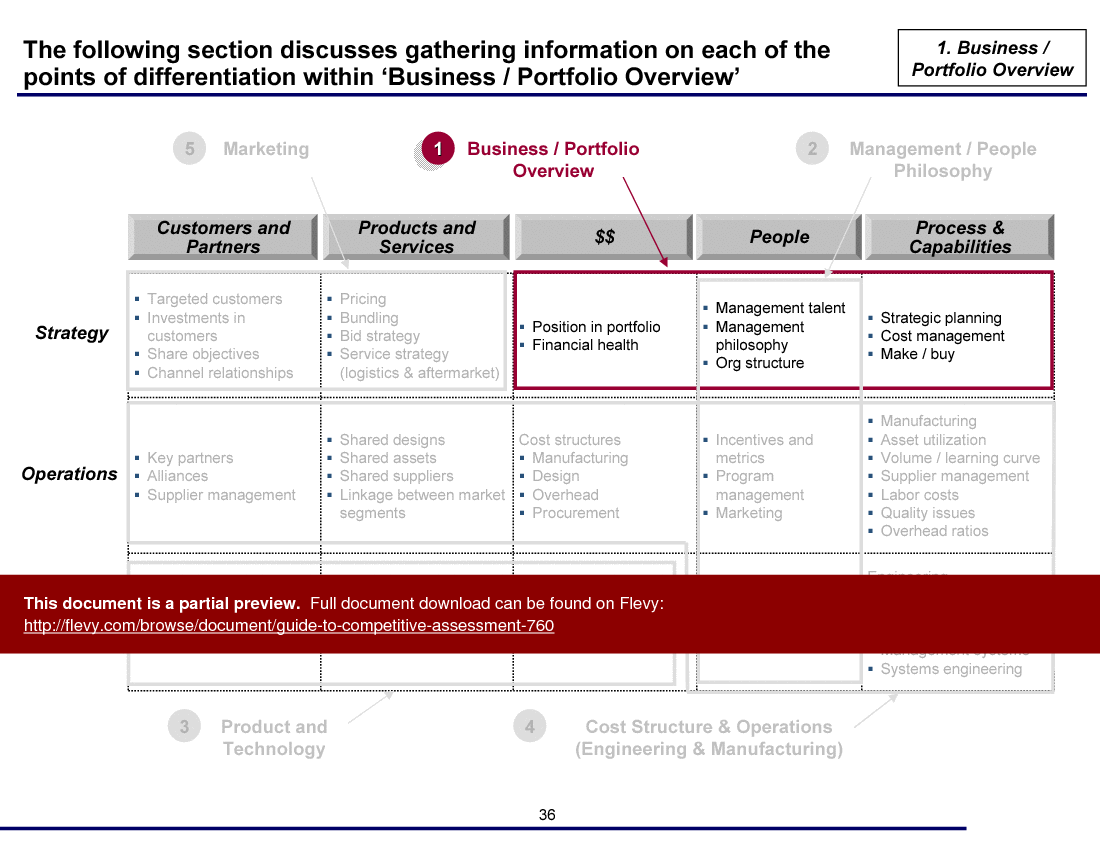
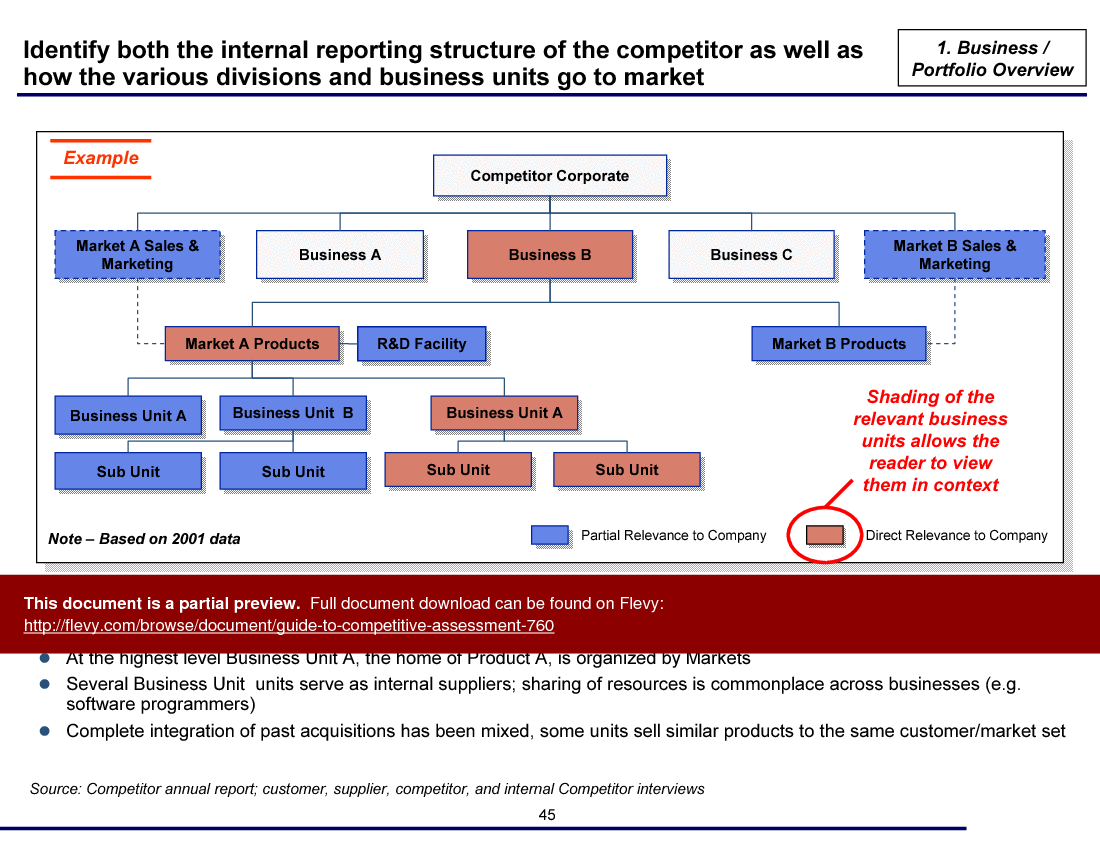
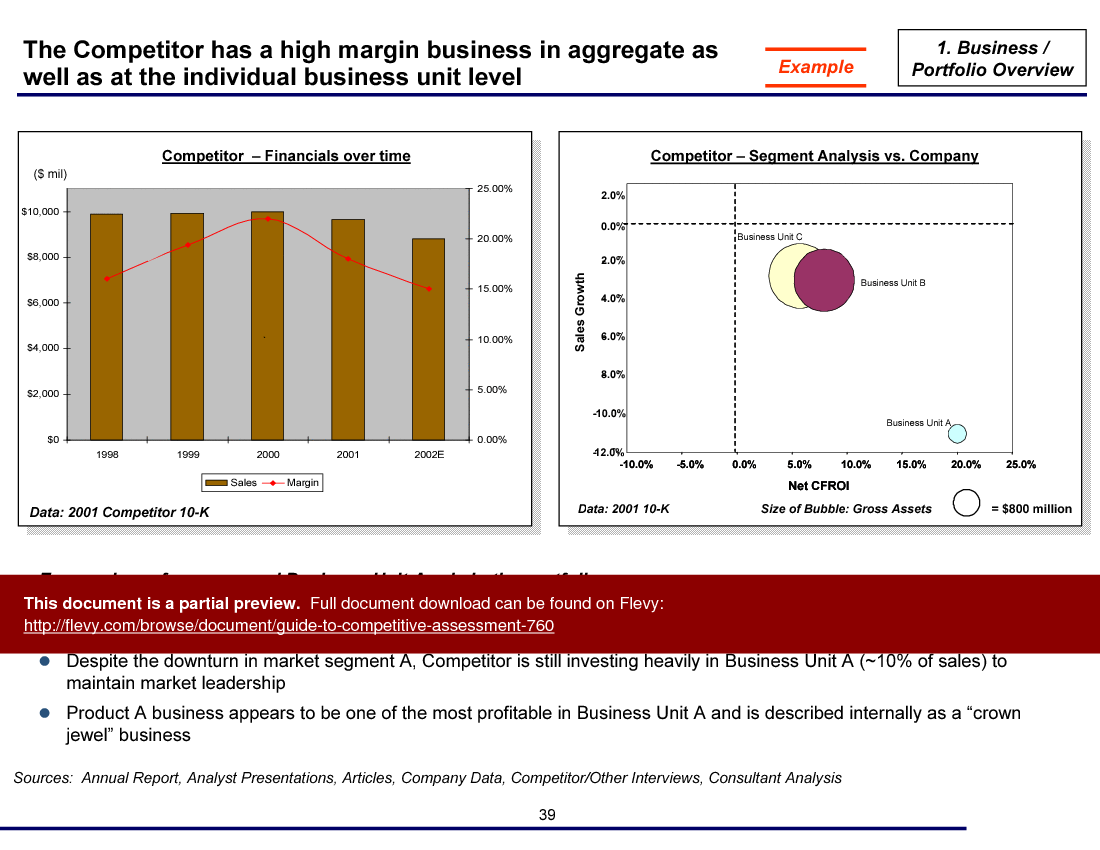
• Business/Portolio Overview.
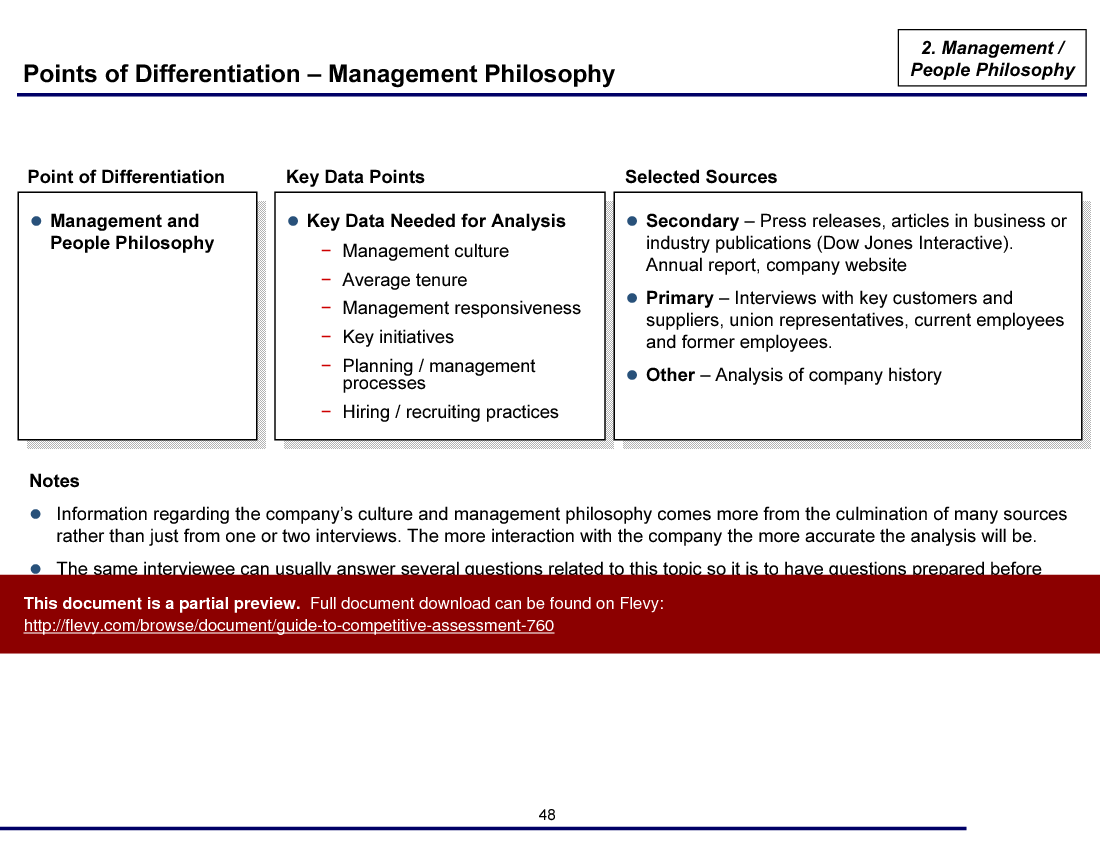
• Management & People.
• Product/Service & Technology.
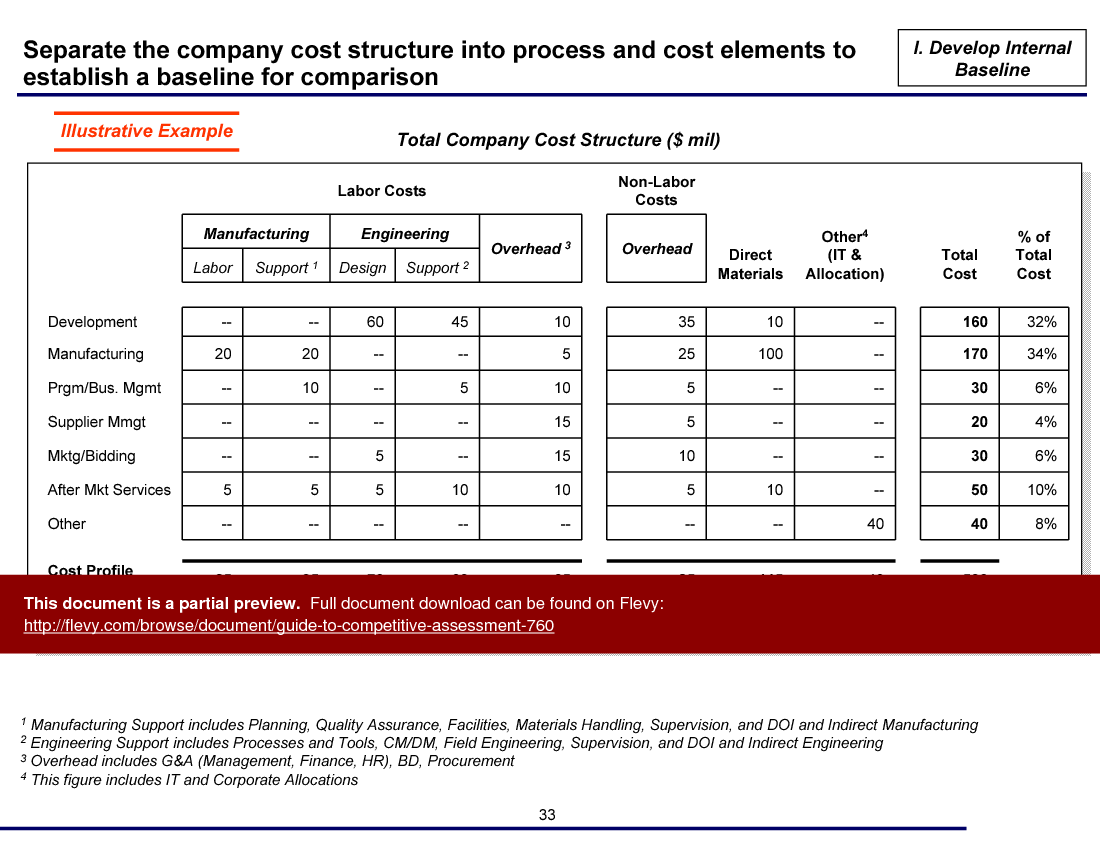
• Cost Structure & Operations.
• Marketing & Sales.
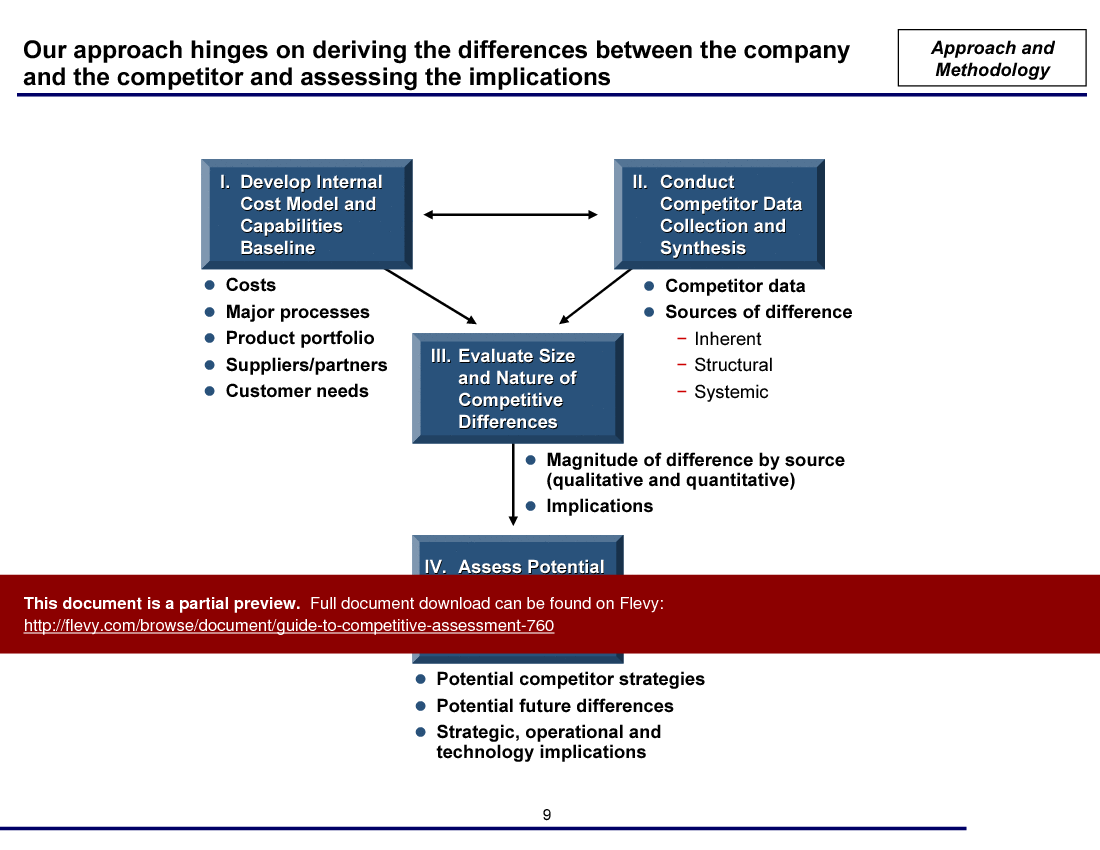
The competitor and information analysis is divided into several steps:
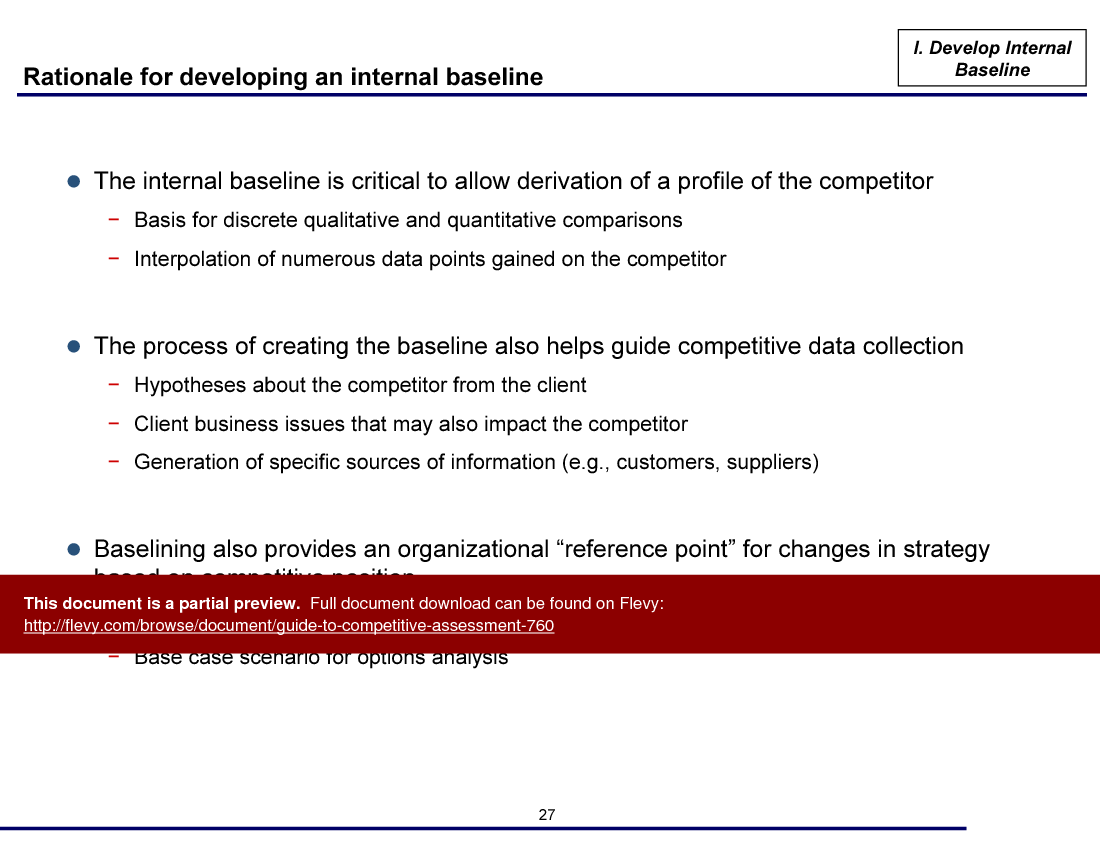
• Develop internal cost model and capability baseline.
• Conduct competitor data collection and synthesis.
• Evaluate size and nature of competitive differences.
• Assess potential competitor strategies and implications.
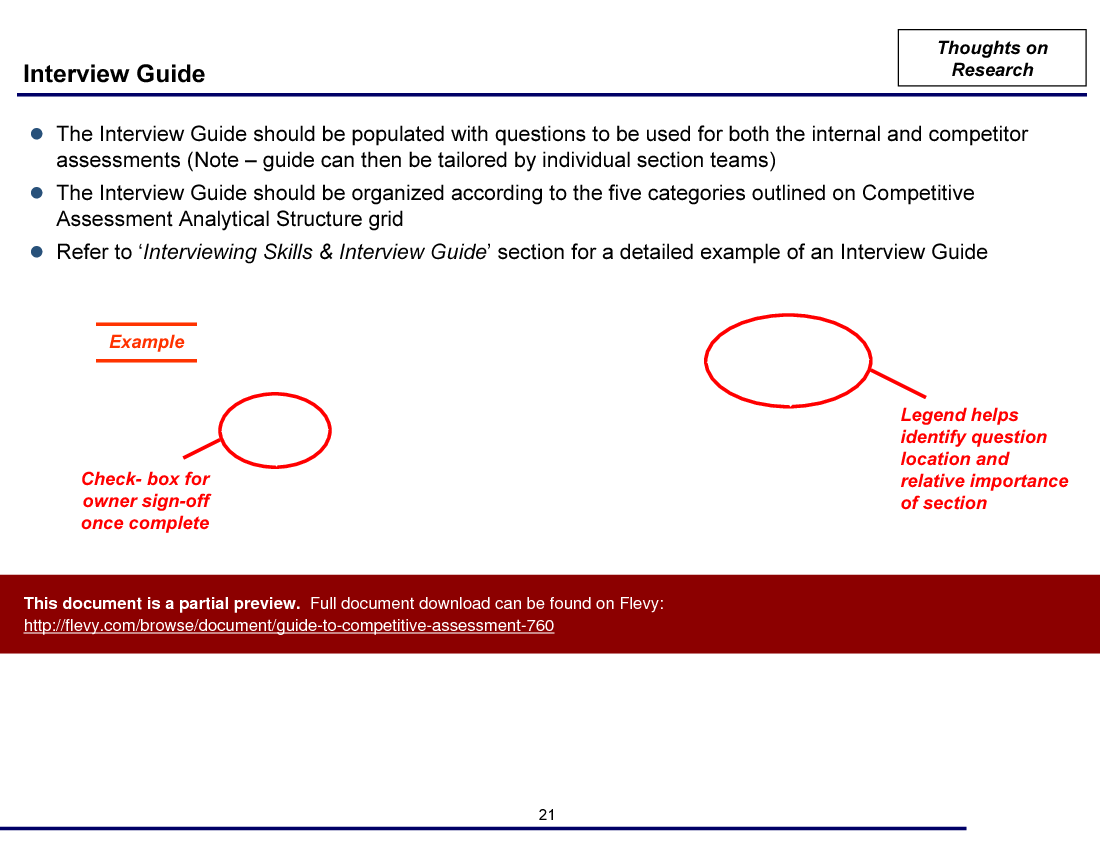
Each steps contain detail description of activities, examples, and tools used. The document also includes an interview guide for the user to jump-start the process.
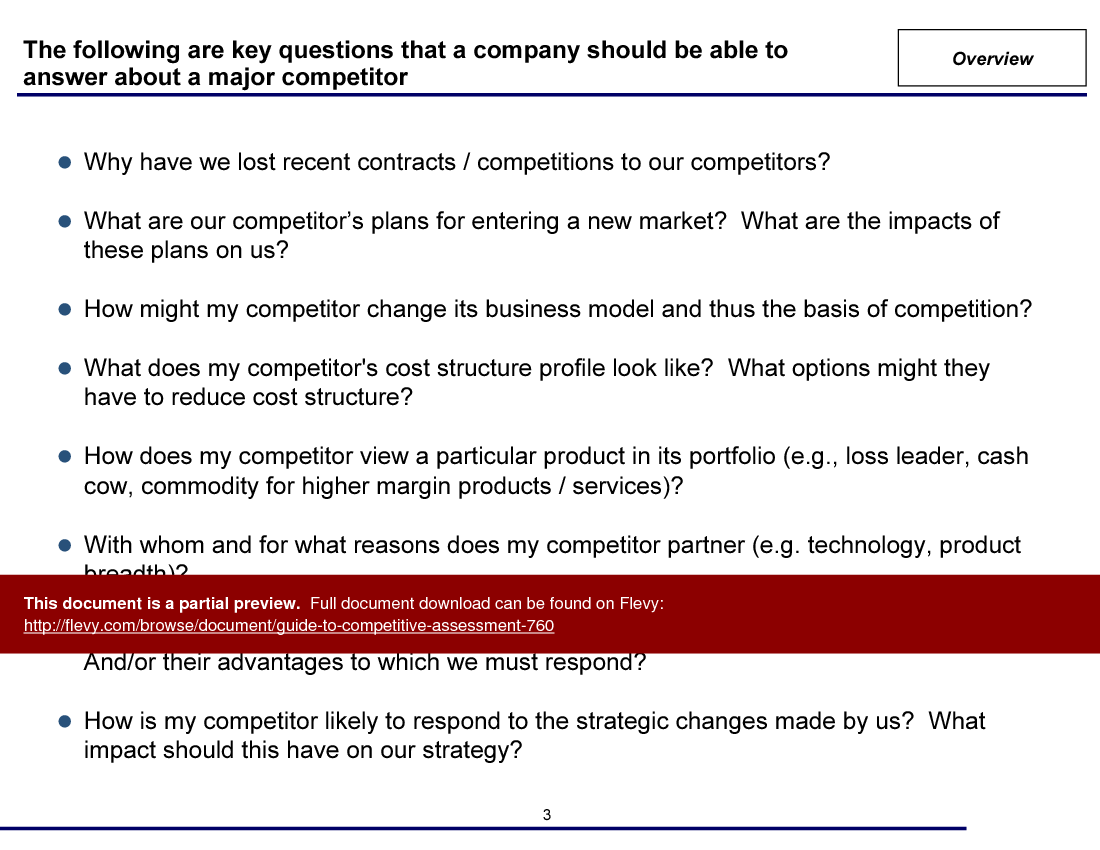
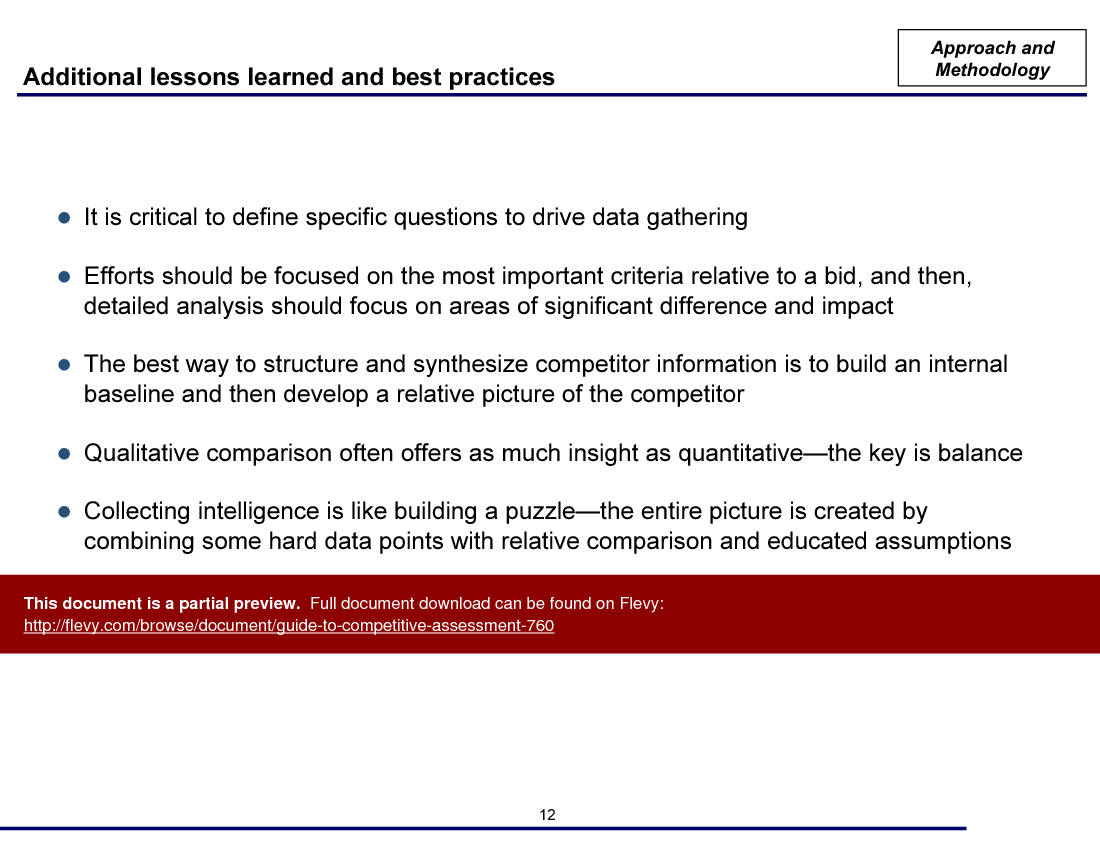
This guide goes beyond just theoretical frameworks by providing practical insights and real-world examples. It includes detailed questions that companies should be able to answer about their competitors, such as understanding why recent contracts were lost or how competitors plan to enter new markets. These questions are designed to provoke critical thinking and strategic planning.
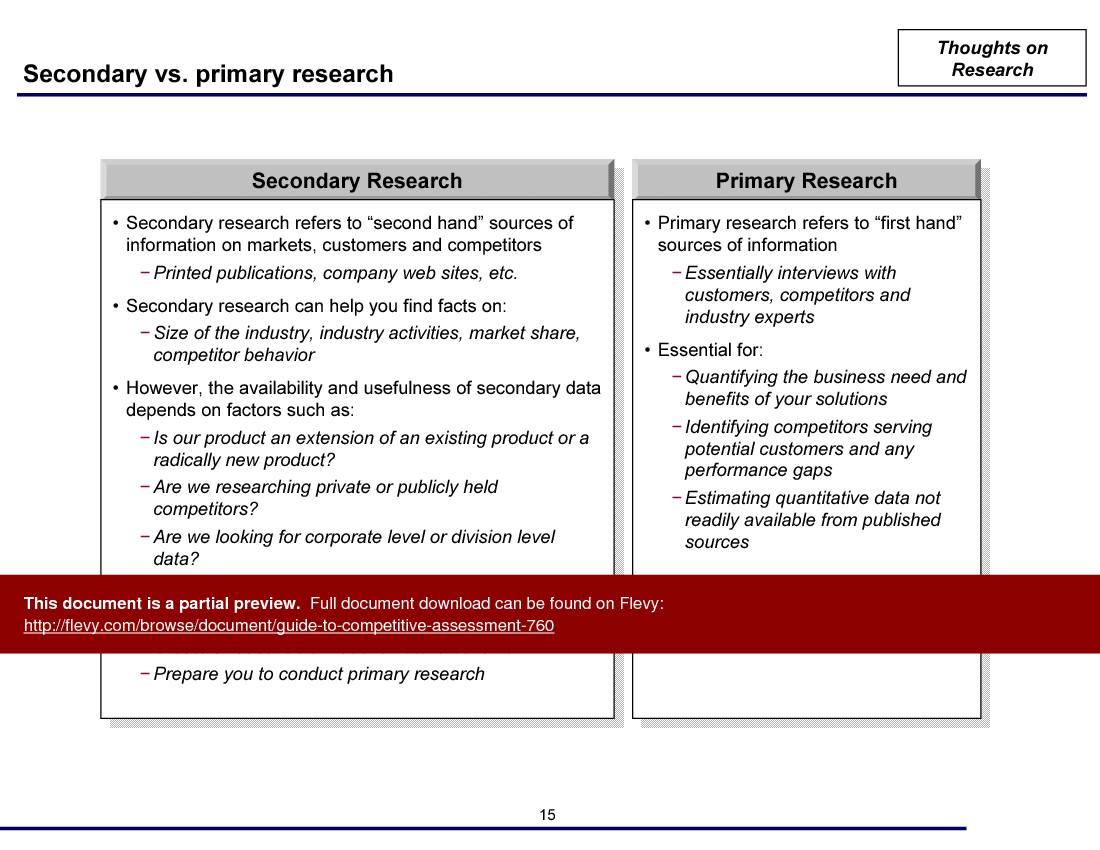
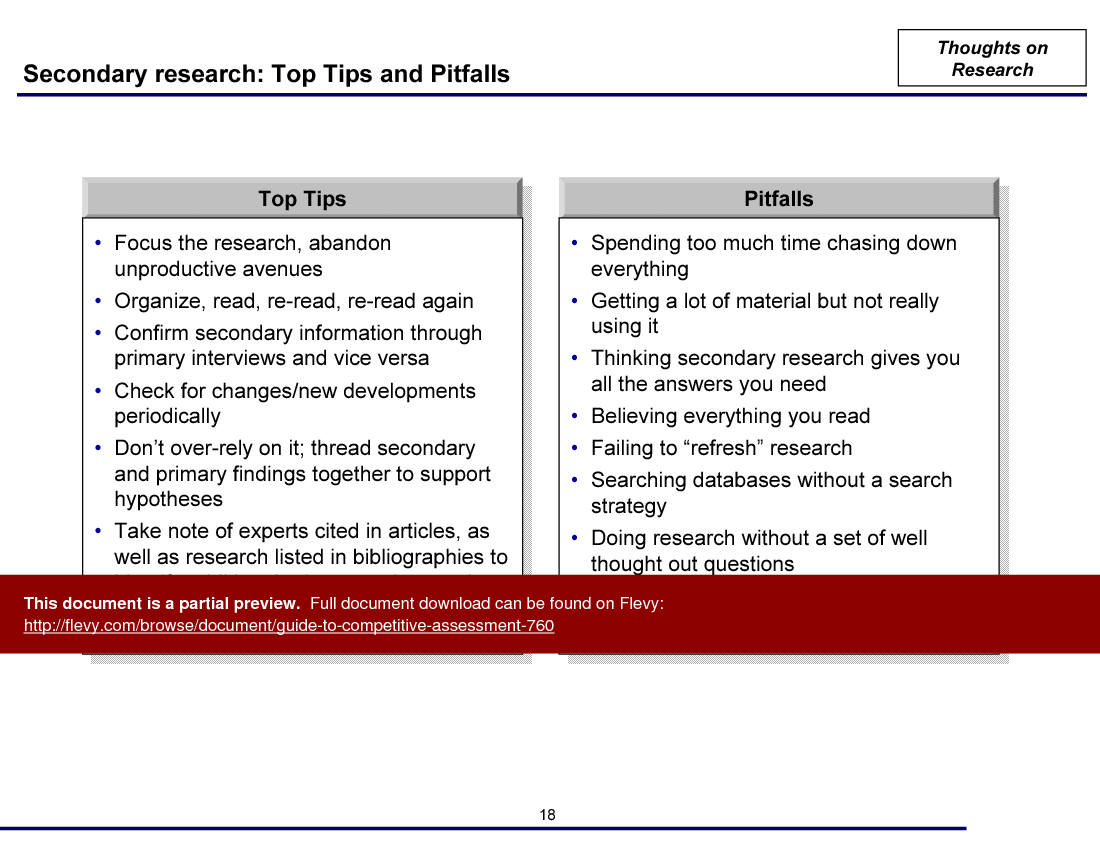
Another key feature of this guide is its focus on both secondary and primary research. It outlines the importance of using various sources of information, from printed publications to direct interviews with industry experts and competitors. This dual approach ensures a comprehensive understanding of the competitive landscape, enabling more informed decision-making.
The guide also emphasizes the importance of qualitative and quantitative comparisons. It provides methodologies for evaluating the size and nature of competitive differences, considering factors like cost structure and operational efficiency. This balanced approach helps in building a robust competitive strategy, tailored to the unique challenges and opportunities of your industry.
Got a question about the product? Email us at support@flevy.com or ask the author directly by using the "Ask the Author a Question" form. If you cannot view the preview above this document description, go here to view the large preview instead.
PRESENTATION DEEP DIVE ANALYSIS
This deep-dive analysis was generated from the full 122-slide PowerPoint presentation.
COMPETITIVE ANALYSIS PPT TEMPLATES
Source: Best Practices in Competitive Analysis PowerPoint Slides: Guide to Competitive Assessment PowerPoint (PPT) Presentation Slide Deck, Documents & Files
