
CISO Board Reporting Kit: Operational Velocity Dashboard – Excel XLSX
Excel (XLSX) + supplemental PDF
BENEFITS OF THIS DOWNLOADABLE EXCEL DOCUMENT
- Automates the Math: Instantly turns your raw incident logs into defensible MTTR metrics and trend lines without complex formula writing.
- Translates Tech to Value: Replaces boring technical stats with a clear "Velocity Narrative" that proves ROI to non-technical executives.
- Justifies the Budget: Visually demonstrates how faster response times on "Critical" threats reduce financial liability, helping you defend your resource requests.
CYBER SECURITY EXCEL DESCRIPTION
Are you struggling to prove the ROI of your security team to non-technical executives?
The biggest mistake security leaders make is presenting Activity (e.g., "We patched 500 servers") instead of Outcome (e.g., "We reduced risk exposure time by 80%").
The Operational Velocity Dashboard is a "Consultant-Grade" reporting toolkit designed to translate complex incident data into the one metric the Board cares about: Speed.
What Problem Does This Solve?
Eliminates Excel Fatigue: No more manual formula writing. Paste your raw logs, and the engine calculates MTTR (Mean Time to Respond) automatically.
Visualizes Risk vs. Speed: The dynamic charts separate "Critical" incidents from the noise, proving that your team prioritizes the most dangerous threats first.
Controls the Narrative: Includes a 1-page Executive Script teaching you exactly what to say to defend your budget and explain the charts without using technical jargon.
What is Included?
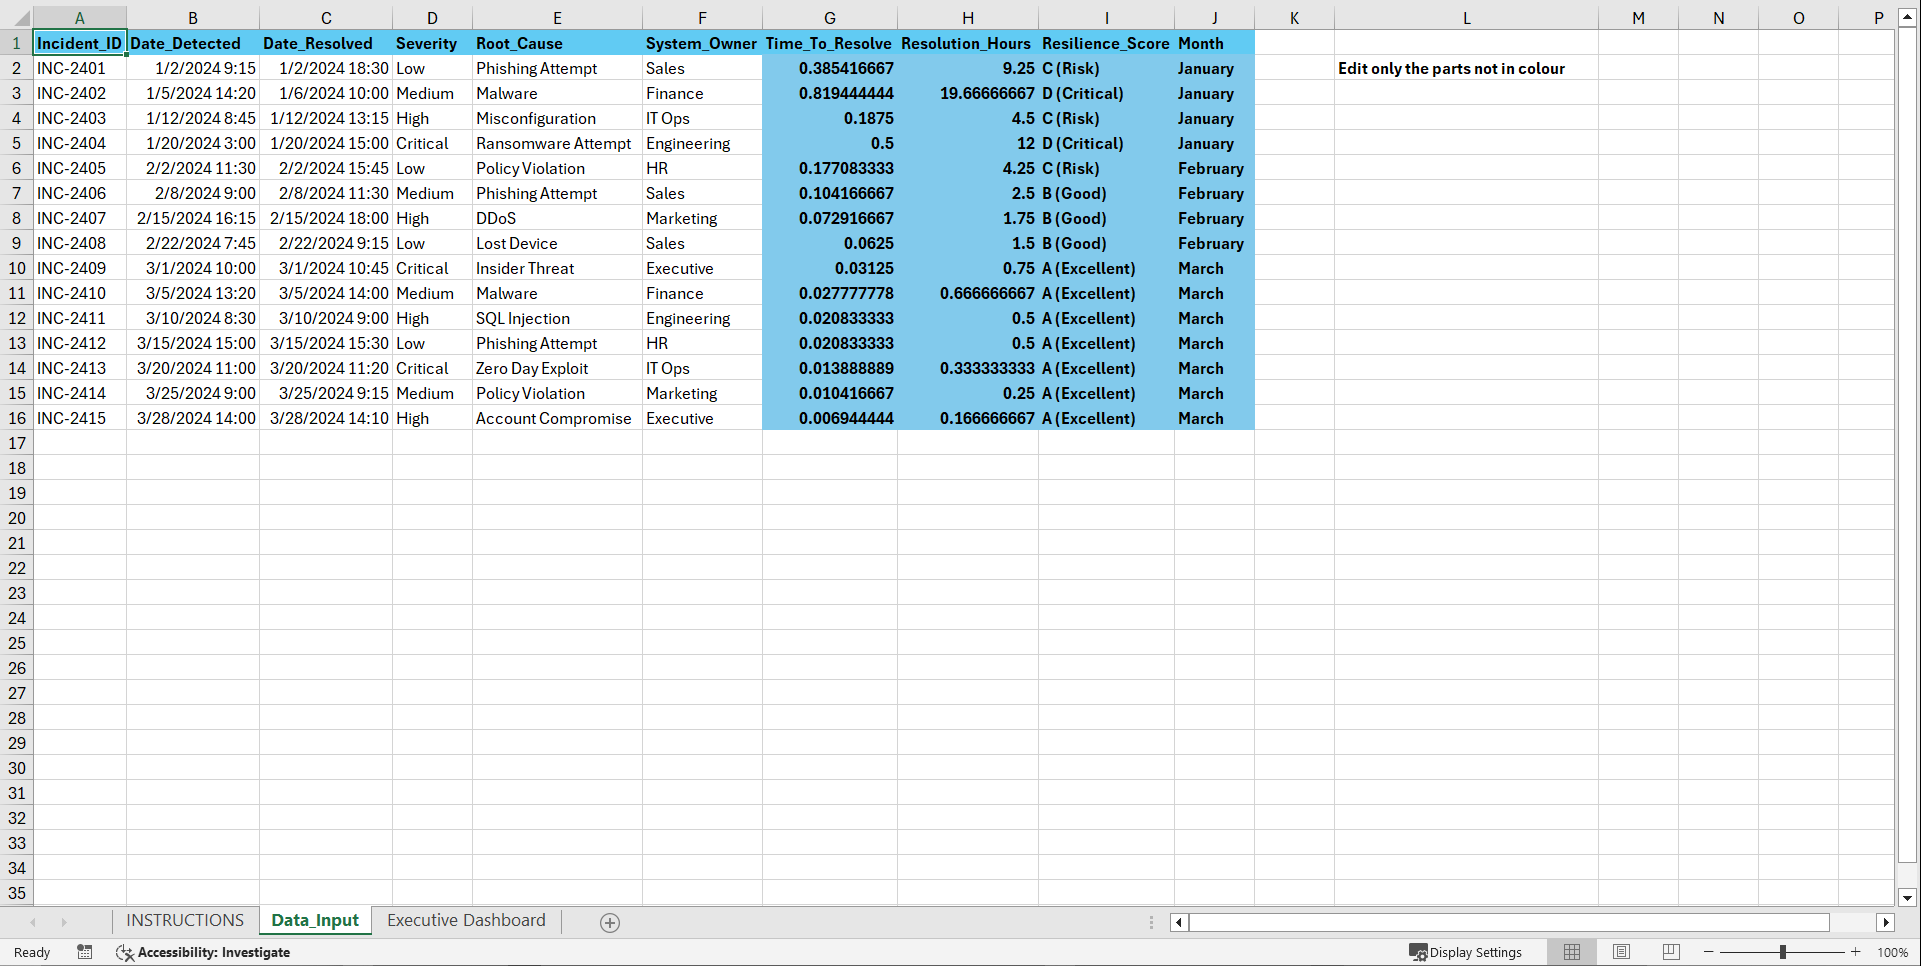
1. The Logic Engine (Excel .xlsx) A pre-built, macro-free Excel dashboard.
Input: Paste your raw incident data (Date Detected, Date Resolved, Severity).
Output: Instant trend lines showing Response Velocity categorized by Severity (Critical vs. High).
Features: Auto-grading system (assigns A/B/C grades to incidents) and Trend Analysis.
2. The Executive Narrative (PDF) A concise, 1-page "Cheat Sheet" for the CISO.
Strategic scripts to explain the data to a CFO/CEO.
How to answer the "Gotcha" question: "Why do we have so many Critical incidents?"
The "BLUF" (Bottom Line Up Front) summary for 2-minute presentations.
Who is this for?
CISOs and Security Directors preparing for Quarterly Business Reviews (QBRs).
vCISOs and Consultants who need a standardized reporting format for multiple clients.
SOC Managers who need to visualize team performance efficiency.
Instant Download. Turn your data into strategy today.
Got a question about the product? Email us at support@flevy.com or ask the author directly by using the "Ask the Author a Question" form. If you cannot view the preview above this document description, go here to view the large preview instead.
Source: Best Practices in Cyber Security Excel: CISO Board Reporting Kit: Operational Velocity Dashboard Excel (XLSX) Spreadsheet, Concise Cyber
