 Click main image to view in full screen. Unlock all 14 preview images:
CEO Performance KPI Dashboard Template – PowerPoint PPTX Template
PowerPoint (PPTX) 58 Slides


BENEFITS OF THIS DOWNLOADABLE POWERPOINT DOCUMENT
- Consolidates 1,104 KPIs across 37 domains into a comprehensive framework for monitoring enterprise performance and supporting executive decision-making.
- Accelerates the creation of board-ready performance reports with 58 structured slides and 143 editable PowerPoint charts featuring embedded Excel data.
- Connects financial performance, strategic execution, risk indicators, shareholder value, and proposed board decisions in one customizable executive reporting framework.
KEY PERFORMANCE INDICATORS PPT TEMPLATE DESCRIPTION
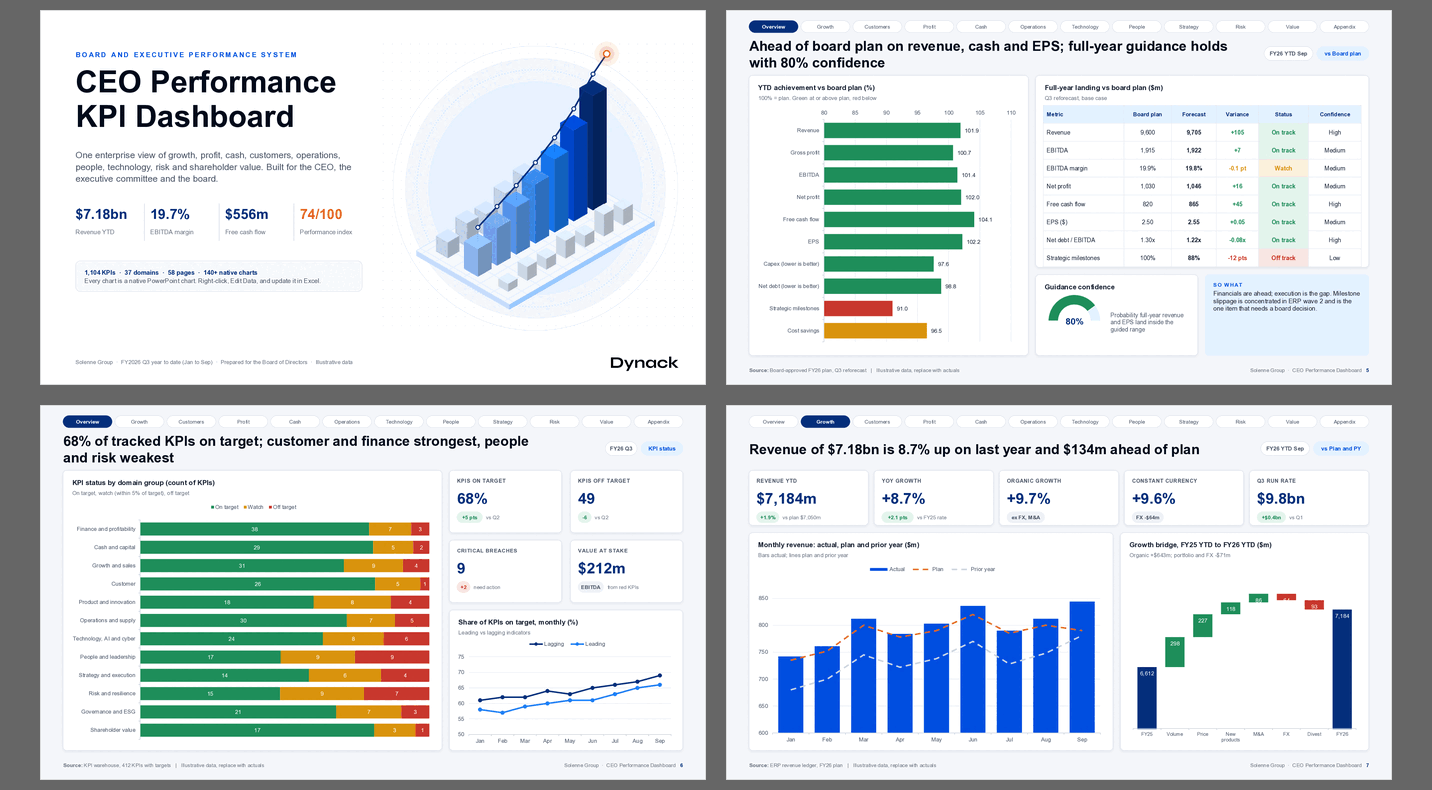
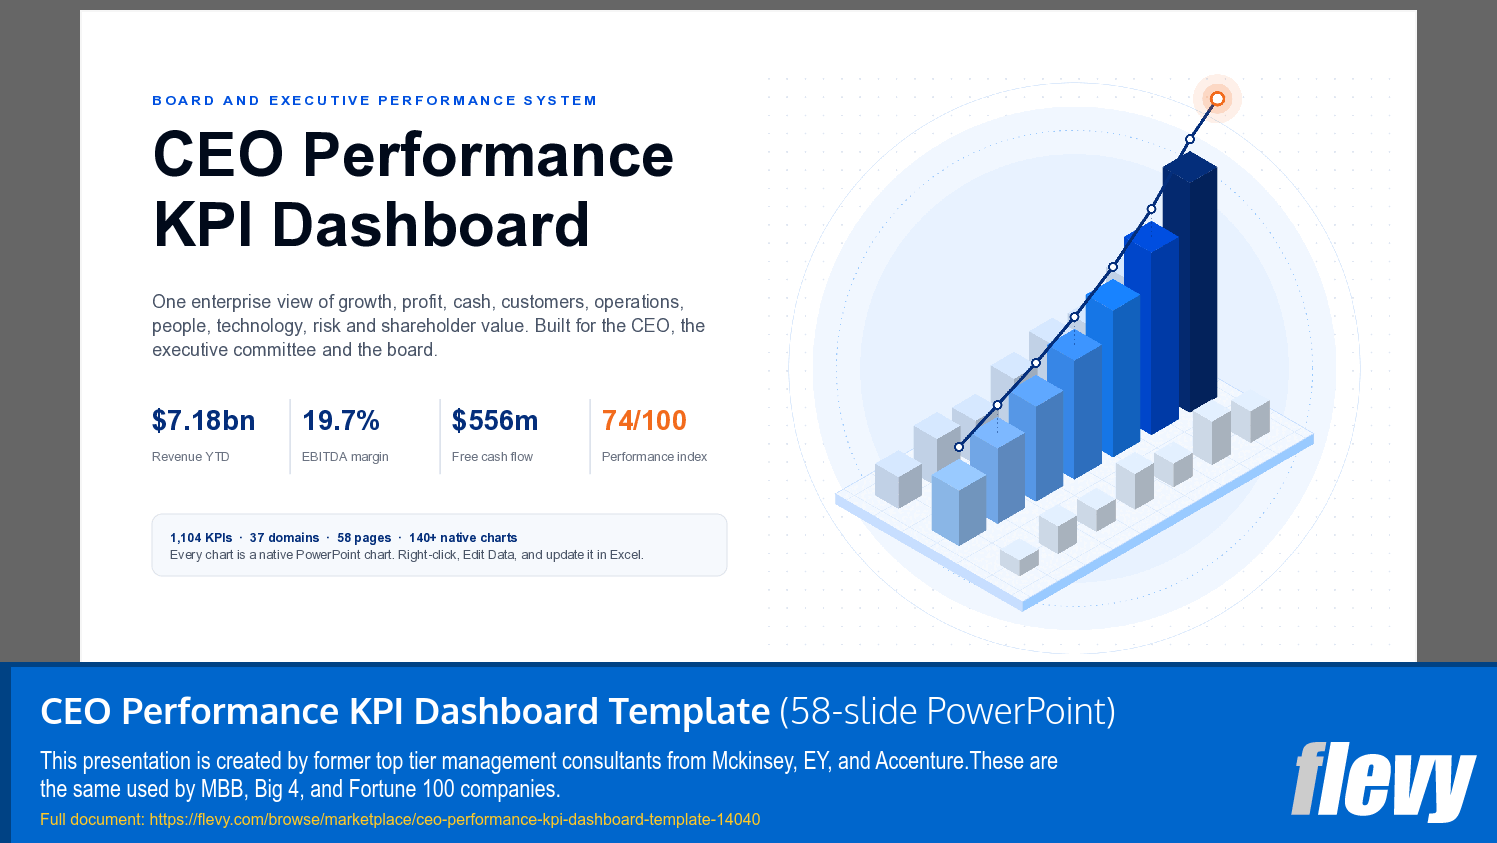
The CEO Performance KPI Dashboard Template is a comprehensive executive reporting and performance management framework designed to help CEOs, executive leadership teams, strategy professionals, and management consultants monitor enterprise performance and communicate business results effectively.
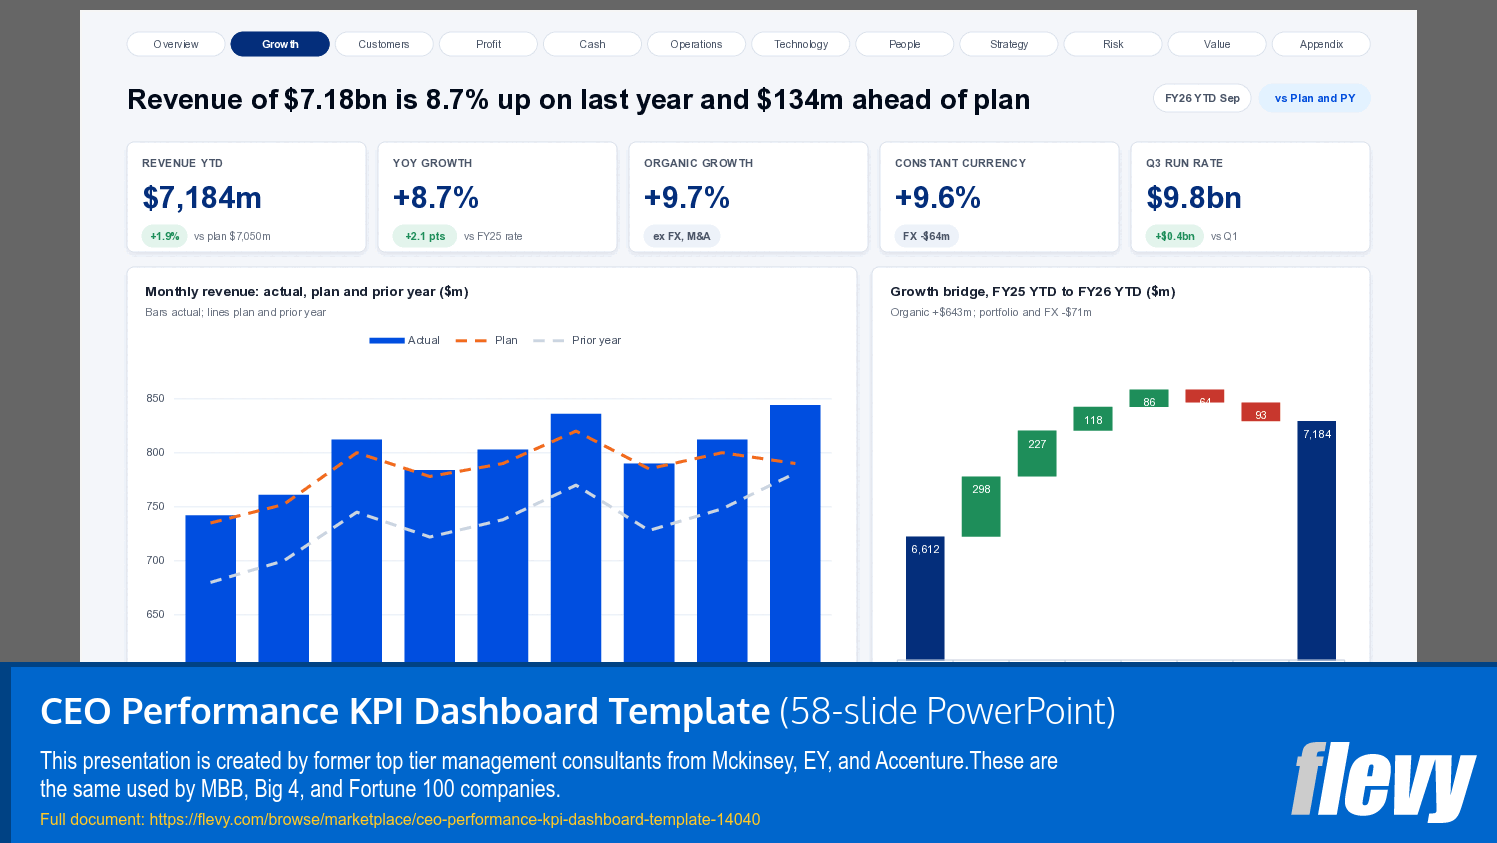
This 58-slide presentation includes 1,104 key performance indicators (KPIs) across 37 domains, supported by 143 native PowerPoint charts with embedded Excel data. It provides a structured approach to consolidating financial and non-financial performance measures into a consistent, board-ready executive reporting framework.
What Is Included
The template is organized into 12 sections covering the essential dimensions of enterprise performance. These include an enterprise performance overview, executive summary, growth and customer performance, profitability and financial performance, cash and capital management, operational performance, technology, people, strategy execution, risk management, shareholder value, and supporting KPI reference material.
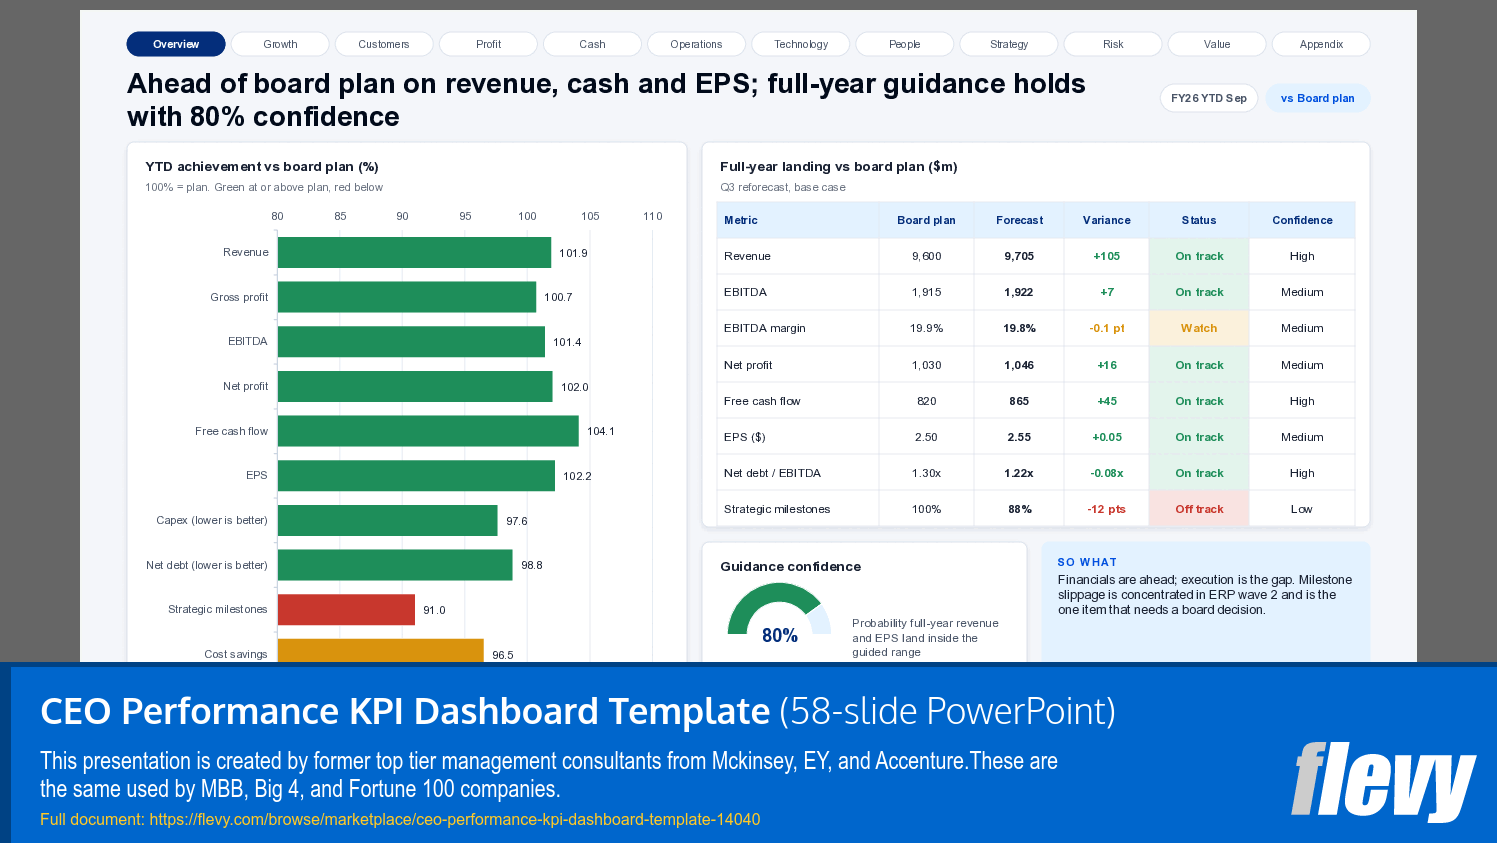
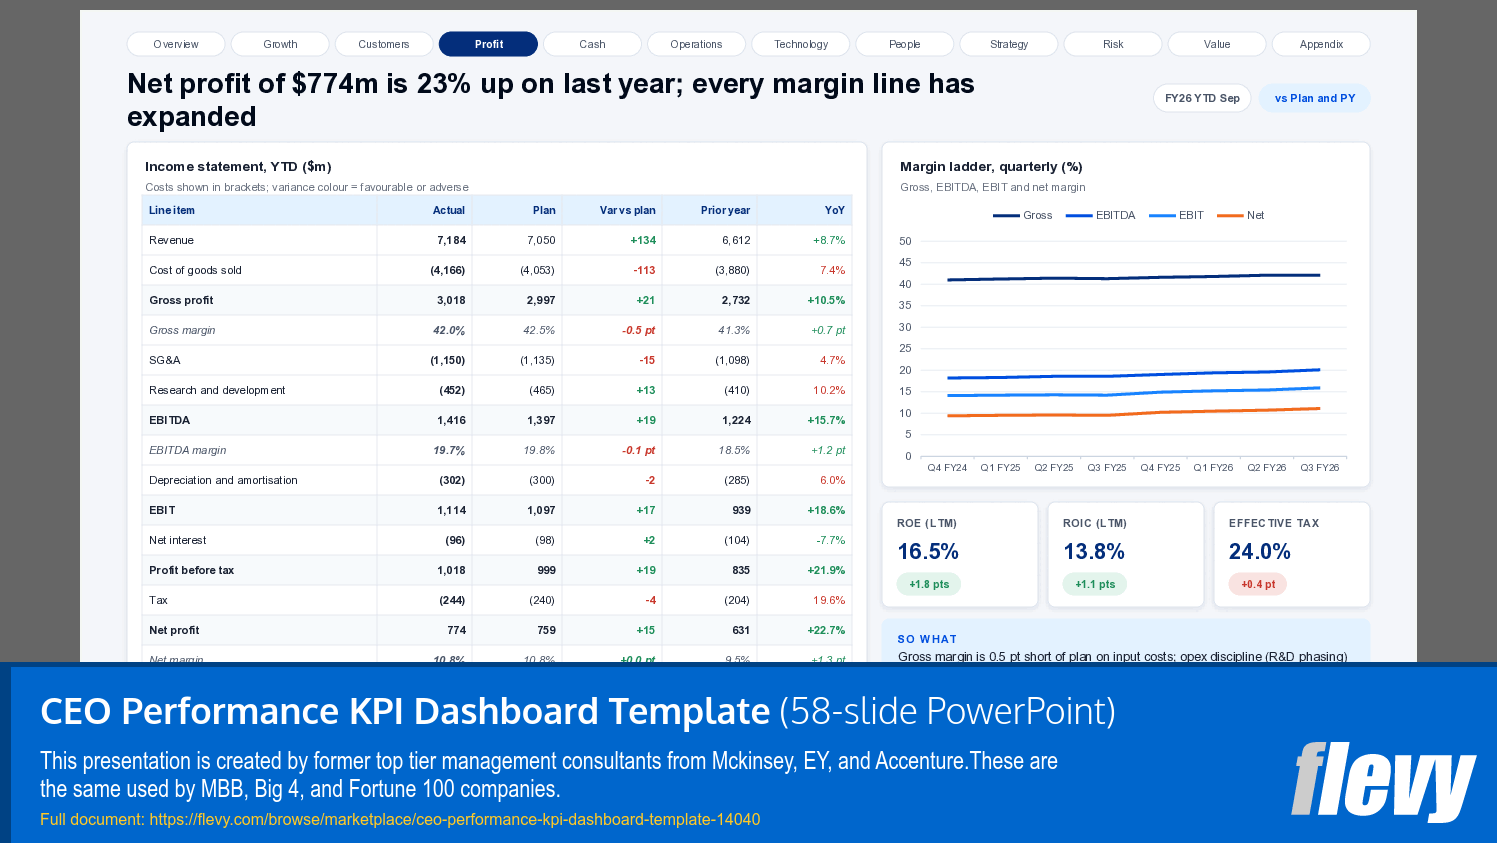
The enterprise performance overview consolidates 12 composite indices into an overall performance score and provides historical trends for executive review. Financial analysis includes revenue and EBITDA performance, cost analysis, free cash flow, liquidity, cash conversion, capital allocation, return on invested capital, and cost of capital.
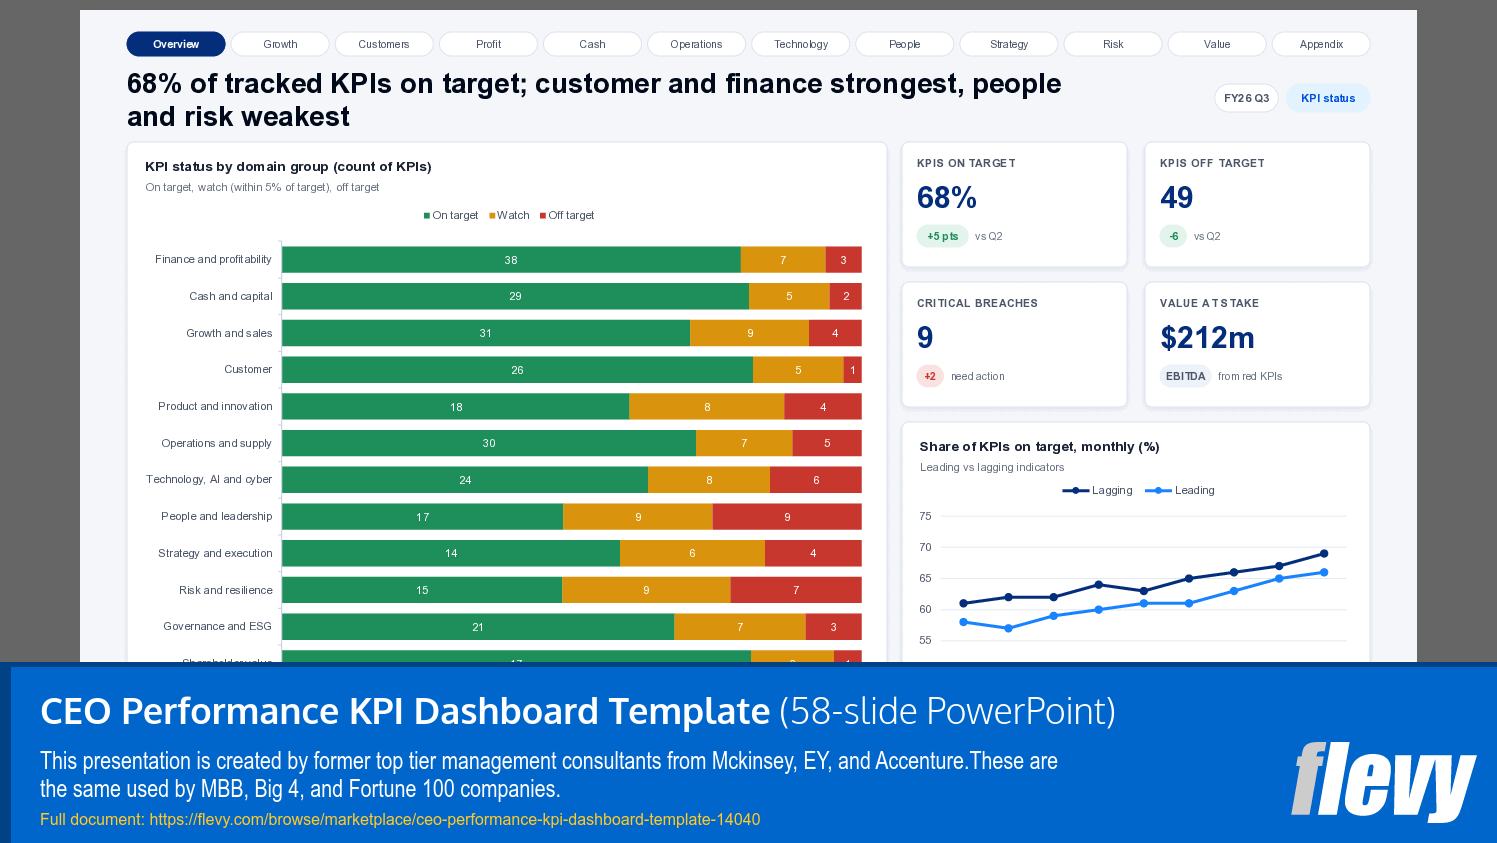
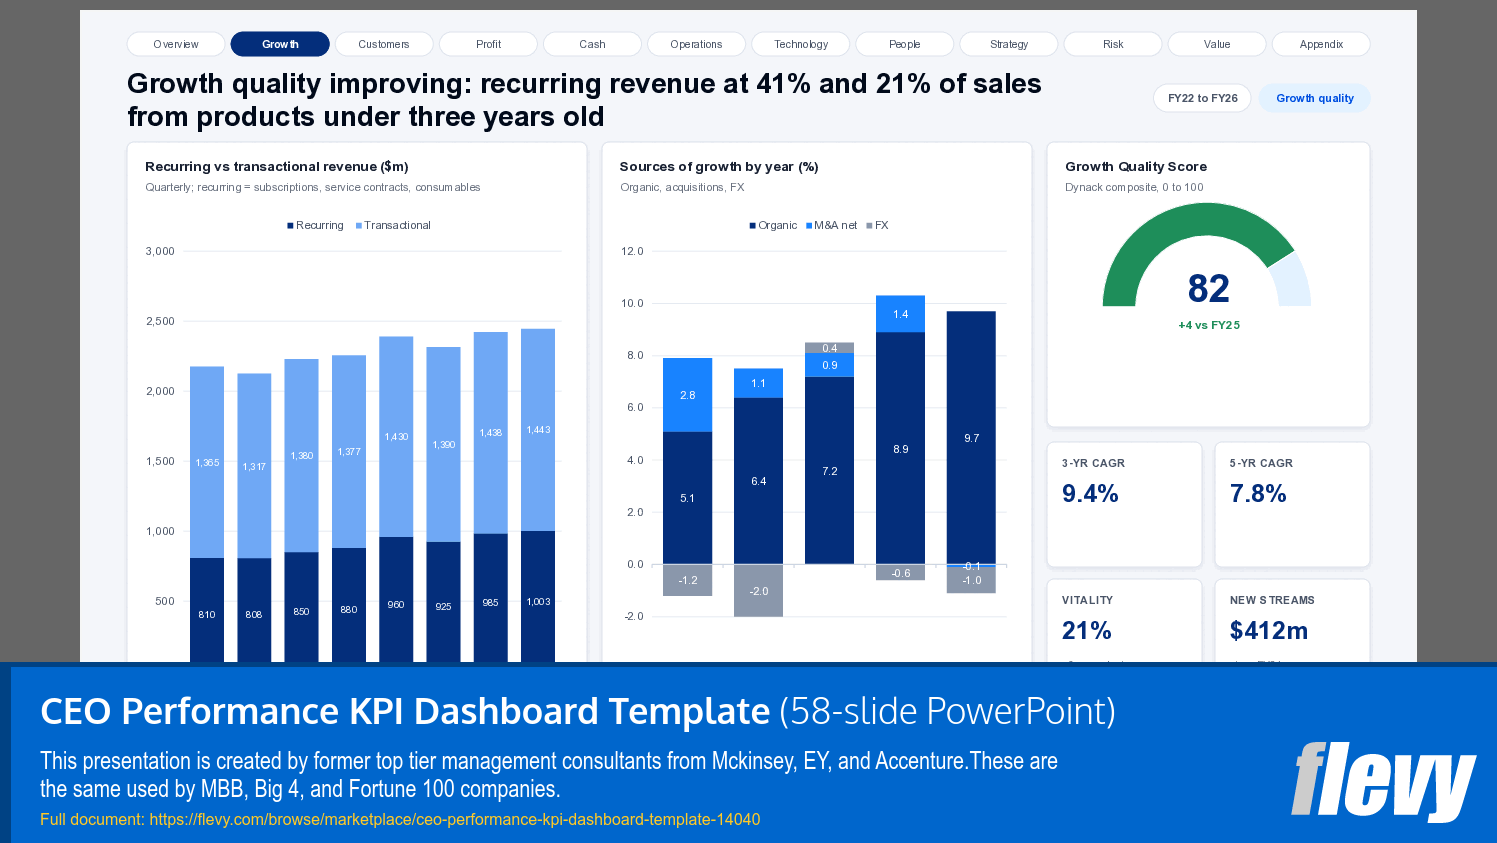
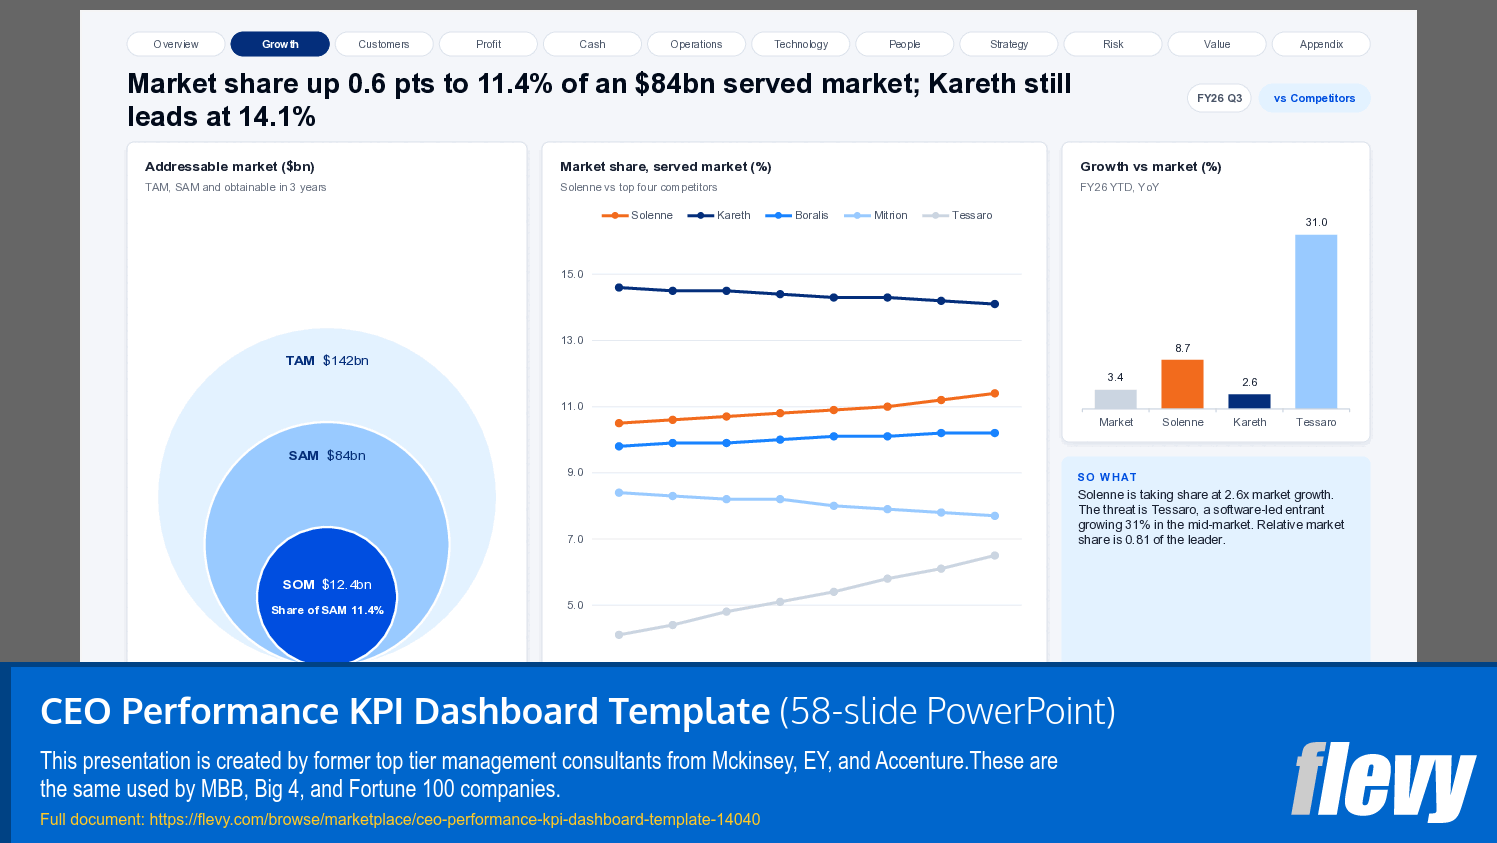
Customer and growth measures help executives assess business expansion, customer retention, satisfaction, and customer economics. Operational, technology, and people-related indicators support a broader view of organizational effectiveness and execution. Strategy and risk sections help leadership teams connect performance results with strategic priorities, potential downside scenarios, and emerging business risks.
Executive Decision Support
Beyond KPI monitoring, the template provides tools for turning performance data into management action. These include a CEO scorecard, risk heat map, scenario analysis, 16 early-warning signals with red, amber, and green thresholds, a return-on-invested-capital driver tree, a value-at-stake register, proposed board decisions, and a 90-day action plan.
A KPI Navigator maps the indicators across the 37 domains to the relevant dashboard pages, making it easier to identify appropriate measures and adapt the reporting structure to organizational requirements.
Editable and Customizable Design
The presentation includes 143 native PowerPoint charts with embedded Excel data, allowing users to update chart inputs and tailor the visualizations to their reporting needs. Users can replace illustrative figures with actual company data, customize chart titles and commentary, modify slide layouts, and remove sections that do not apply to their organizations.
The presentation provides a consistent foundation for executive reviews, quarterly business performance meetings, board presentations, strategic planning discussions, and management reporting engagements.
Who Should Use This Template?
This resource is suitable for CEOs, chief of staff teams, corporate strategy professionals, business performance managers, finance leaders, management consultants, and executive reporting teams. It is particularly useful for organizations seeking a comprehensive starting point for consolidating multiple functional reports into one executive-level view of business performance.
Format and Implementation
The primary deliverable is an editable PowerPoint presentation compatible with Microsoft PowerPoint 2016 or later and Microsoft 365 on Windows and Mac. Embedded chart data can be edited through the associated Excel functionality. Compatibility with Google Slides and Keynote may vary, and some charts may become static images.
This is a manually updated reporting template rather than a live business intelligence dashboard connected to enterprise data systems. The illustrative sample-company data should be replaced with validated organizational information before the presentation is used for actual management or board decisions.
Overall, the template offers a structured, customizable framework for monitoring enterprise performance, identifying emerging issues, evaluating value creation, and translating business results into actionable executive and board-level discussions.
Got a question about the product? Email us at support@flevy.com or ask the author directly by using the "Ask the Author a Question" form. If you cannot view the preview above this document description, go here to view the large preview instead.
Source: Best Practices in Key Performance Indicators, CEO PowerPoint Slides: CEO Performance KPI Dashboard Template PowerPoint (PPTX) Presentation Slide Deck, Dynack
ABOUT THE AUTHOR

Strategic intelligence for teams that move fast.
Dynack gives founders, operators, consultants, and business leaders the frameworks, templates, and playbooks that previously required a $50,000 consulting engagement to access. We strip out the gatekeeping and the fees. What remains is pure strategic utility, instantly downloadable and immediately usable.
Ask the Author a Question
You must be logged in to contact the author.