Check out our FREE Resources page – Download complimentary business frameworks, PowerPoint templates, whitepapers, and more.

Time Series Visuals: Line Charts, Column Charts, Area Charts   13-slide PPT PowerPoint presentation (PPT)
$25.00

Time Series Visuals: Line Charts, Column Charts, Area Charts (13-slide PPT PowerPoint presentation (PPT)) Preview Image Time Series Visuals: Line Charts, Column Charts, Area Charts (13-slide PPT PowerPoint presentation (PPT)) Preview Image Log in to unlock full preview.
Arrow   Unlock all 12 preview images:   Login Register

Time Series Visuals: Line Charts, Column Charts, Area Charts (PowerPoint PPT)

File Type: 13-slide PPT PowerPoint presentation (PPT)

$25.00
FlevyPro price: FREE (included in subscription)


Add to Cart


BUY WITH CONFIDENCE

Immediate digital download upon purchase.
Lifetime document updates included with purchase.
Fully editable & customizable PPT document.
Trusted by over 10,000+ organizations.

DESCRIPTION

This product (Time Series Visuals: Line Charts, Column Charts, Area Charts) is a 13-slide PPT PowerPoint presentation (PPT), which you can download immediately upon purchase.

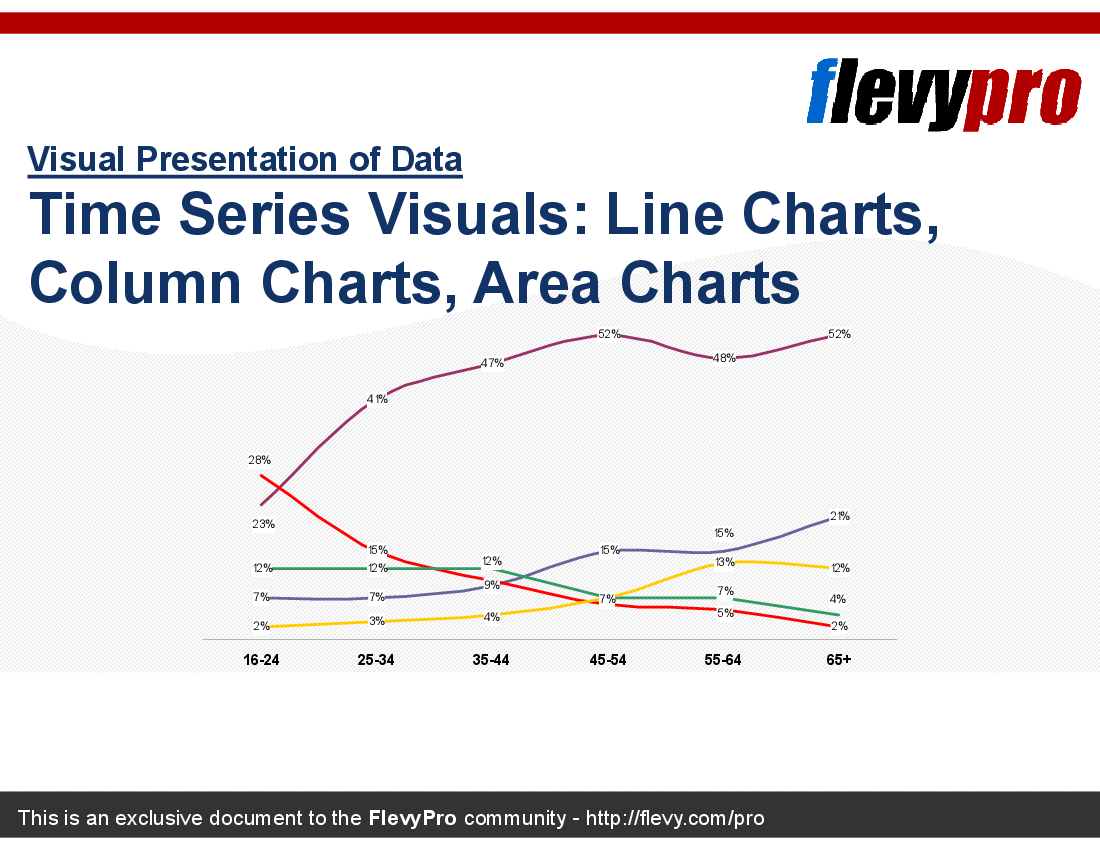
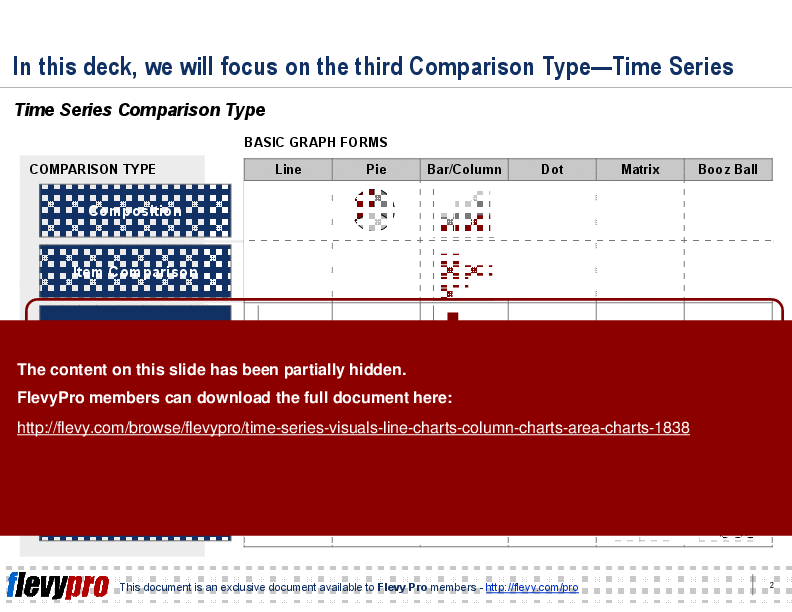
This presentation focuses on Time Series visuals: e.g., Line Charts, Column Charts, Area (AKA Surface) Charts, Line-Columns Combination Charts.

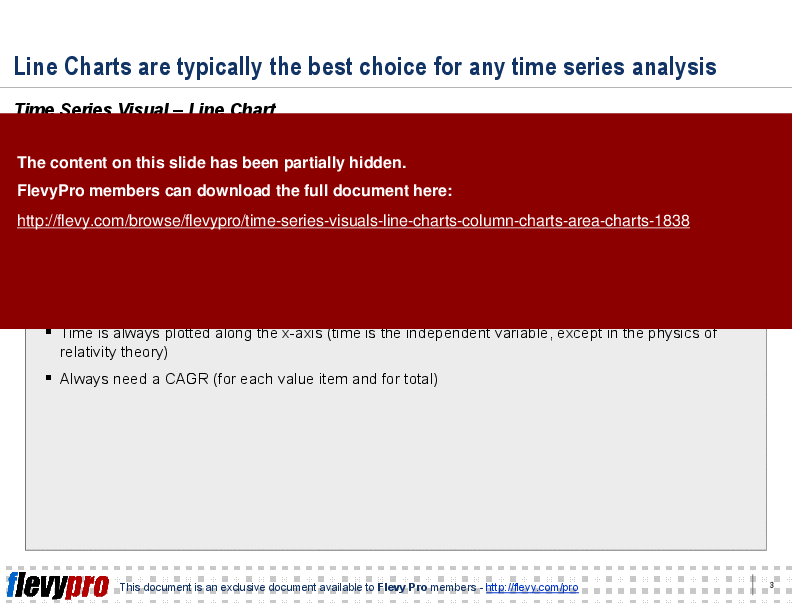
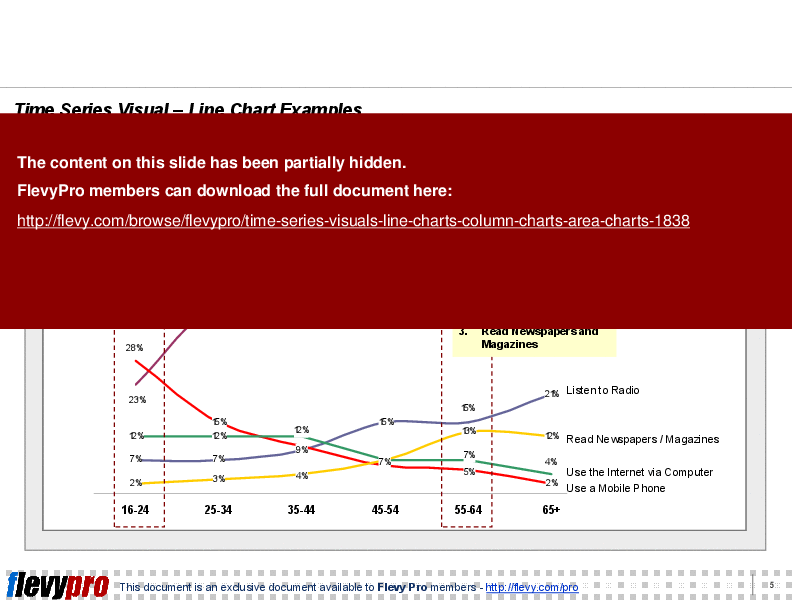
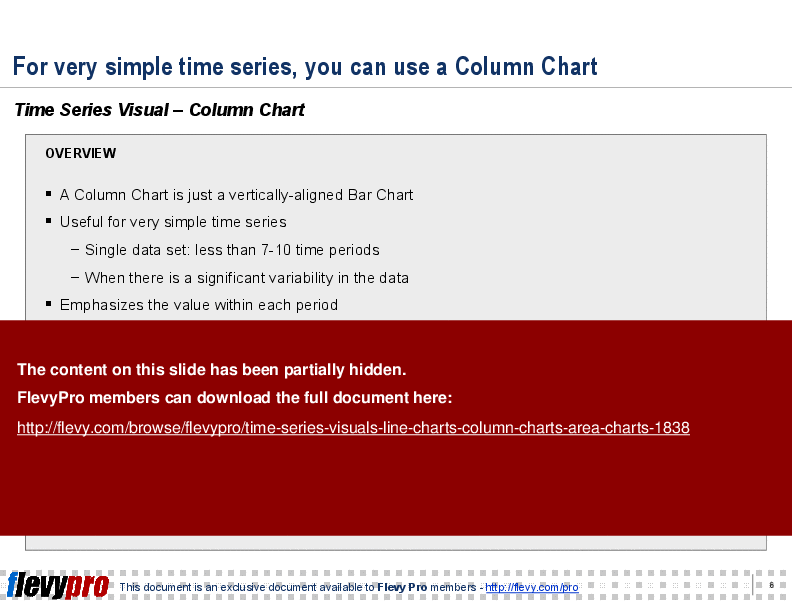
This deck provides a comprehensive guide to leveraging various time series visuals for effective data presentation. It delves into the nuances of Line Charts, highlighting their suitability for most time series analyses due to their clarity in depicting trends over time. The PPT also covers Column Charts, emphasizing their utility in showcasing data with significant variability across fewer time periods.

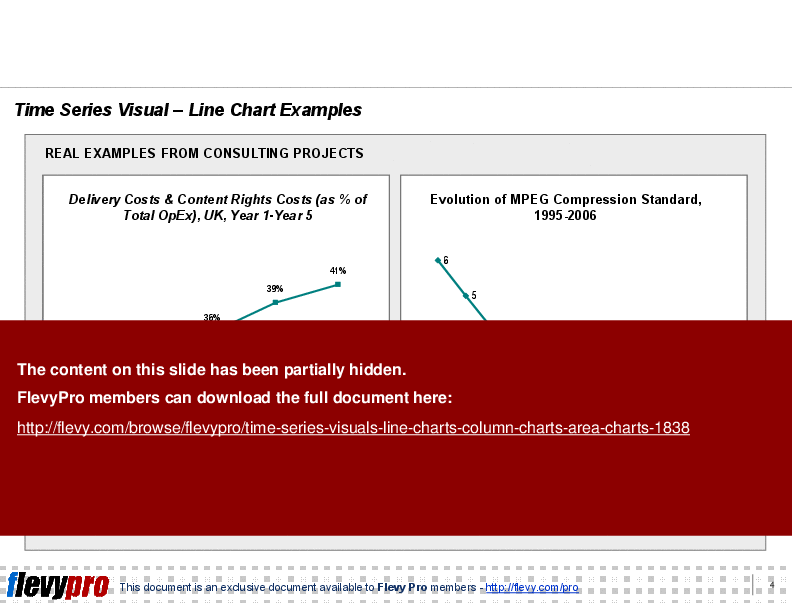
The presentation includes real-world examples from consulting projects, demonstrating practical applications of each chart type. These examples offer valuable insights into how different industries utilize these visuals to drive strategic decisions. The Area Charts section is particularly useful for illustrating the cumulative impact of multiple factors over time, making it easier to understand the relative contributions of each element.

For more complex data sets, the Line-Columns Combination Charts are discussed, showcasing their ability to display simultaneous phenomena effectively. This section is essential for analysts dealing with data that cannot be represented on a single scale. The document is a must-have for executives looking to enhance their data visualization skills and make more informed decisions based on clear, concise, and impactful charts.

Got a question about the product? Email us at flevypro@flevy.com. If you cannot view the preview above this document description, go here to view the large preview instead.

Source: Best Practices in Presentation Design, Chart Design PowerPoint Slides: Time Series Visuals: Line Charts, Column Charts, Area Charts PowerPoint (PPT) Presentation, LearnPPT Consulting


$25.00
FlevyPro price: FREE (included in subscription)


Add to Cart
  

Did you need more documents?

Consider a FlevyPro subscription from $39/month. View plans here.

For $14.00 more, you can download this document plus 2 more FlevyPro documents. That's just $13 each.

OVERVIEW

File Type: PowerPoint ppt (PPT)
Number of Slides: 13 (includes cover and all slides)

ABOUT THE AUTHOR

Author: LearnPPT Consulting
Additional documents from author: 124

We are a team of management consultants trained by top tier global consulting firms (including McKinsey, BCG, Deloitte, EY, Capgemini) with a collective experience of several decades. We specialize in business frameworks based on real-life consulting engagements.

We have served 100s of clients that range from Fortune 500 companies to tech startups to $1B+ private companies. [read more]


ABOUT FLEVYPRO

FlevyPro is a subscription service for on-demand business frameworks and analysis tools. FlevyPro subscribers receive access to an exclusive library of curated business documents—business framework primers, presentation templates, Lean Six Sigma tools, and more—among other exclusive benefits.

Click here to learn more about FlevyPro and its benefits.

Did you know?
The average daily rate of a McKinsey consultant is $6,625 (not including expenses). The average price of a Flevy document is $65.
Bundle and save! You can save up to % with bundles!

View bundle(s)


Trusted by over 10,000+ Client Organizations
Since 2012, we have provided best practices to over 10,000 businesses and organizations of all sizes, from startups and small businesses to the Fortune 100, in over 130 countries.
AT&T GE Cisco Intel IBM Coke Dell Toyota HP Nike Samsung Microsoft Astrazeneca JP Morgan KPMG Walgreens Walmart 3M Kaiser Oracle SAP Google E&Y Volvo Bosch Merck Fedex Shell Amgen Eli Lilly Roche AIG Abbott Amazon PwC T-Mobile Broadcom Bayer Pearson Titleist ConEd Pfizer NTT Data Schwab


Read Customer Testimonials


Save with Bundles

This document is available as part of the following discounted bundle(s):


Download our FREE Strategy & Transformation Framework Templates

Download our free compilation of 50+ Strategy & Transformation slides and templates. Frameworks include McKinsey 7-S, Balanced Scorecard, Disruptive Innovation, BCG Curve, and many more.