
Correlation Visuals: X-Y Scatter, Paired Bar/Column, Bubble, Radar – PowerPoint PPT Template
PowerPoint (PPT) 11 Slides FlevyPro Document
PRESENTATION DEVELOPMENT PPT TEMPLATE DESCRIPTION
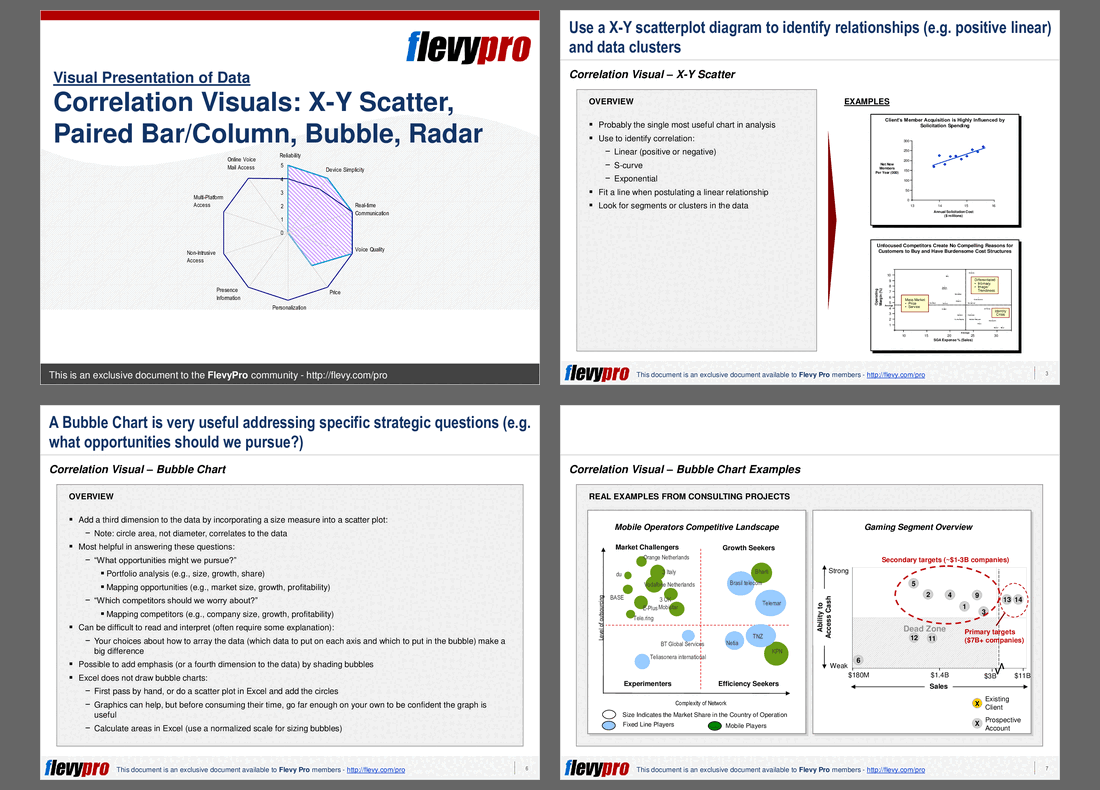
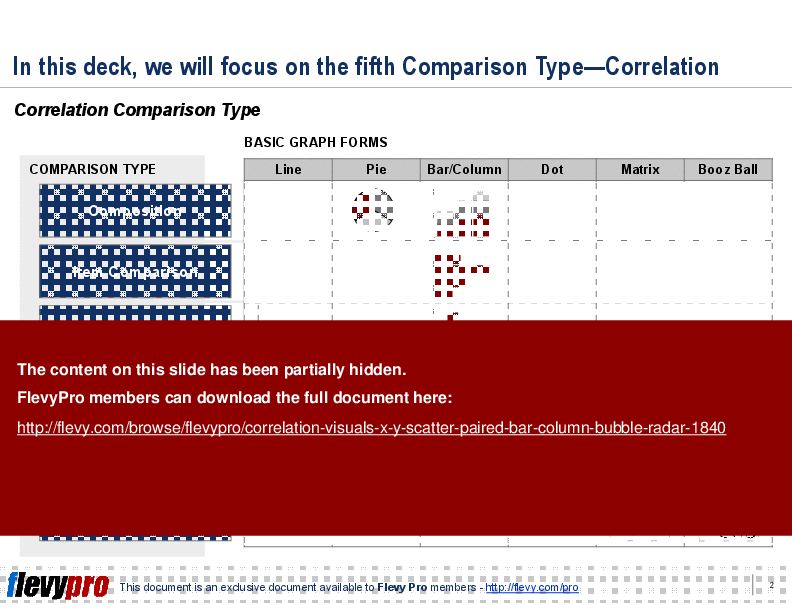
This presentation focuses on Correlation visuals: X-Y Scatterplots, Paired Bar/Column Charts, Bubble Charts, Radar Diagrams.
Unlock the power of data visualization with our comprehensive guide on Correlation Visuals. This deck delves into the intricacies of X-Y Scatterplots, Paired Bar/Column Charts, Bubble Charts, and Radar Diagrams, providing you with the tools to make data-driven decisions. Each chart type is meticulously explained with real-world examples, ensuring you can apply these techniques to your own datasets effectively.
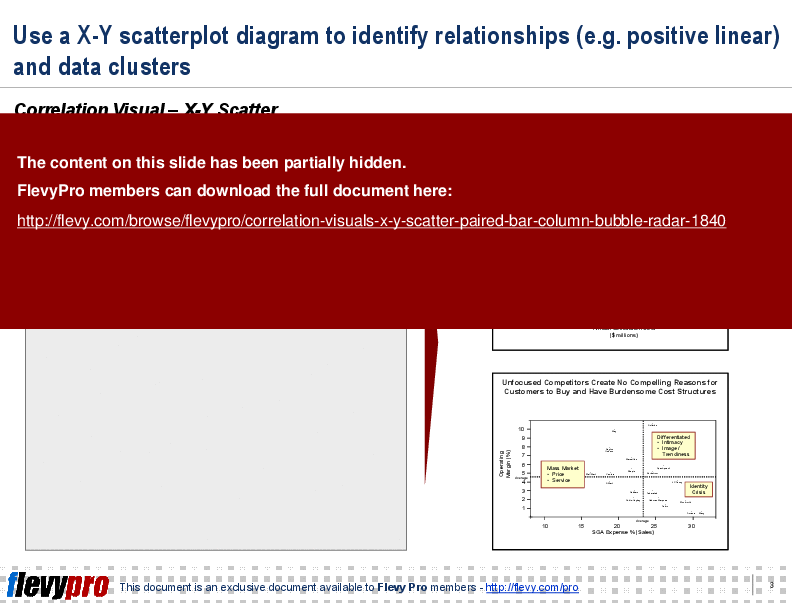
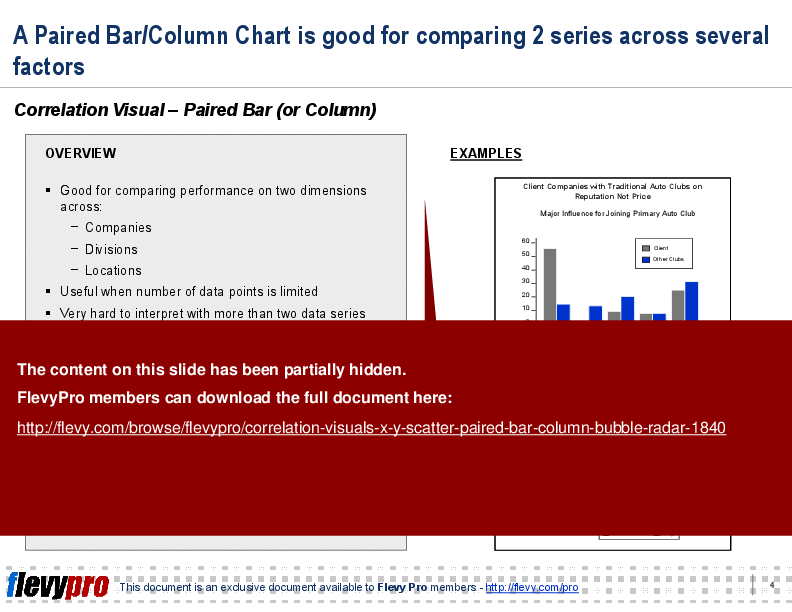
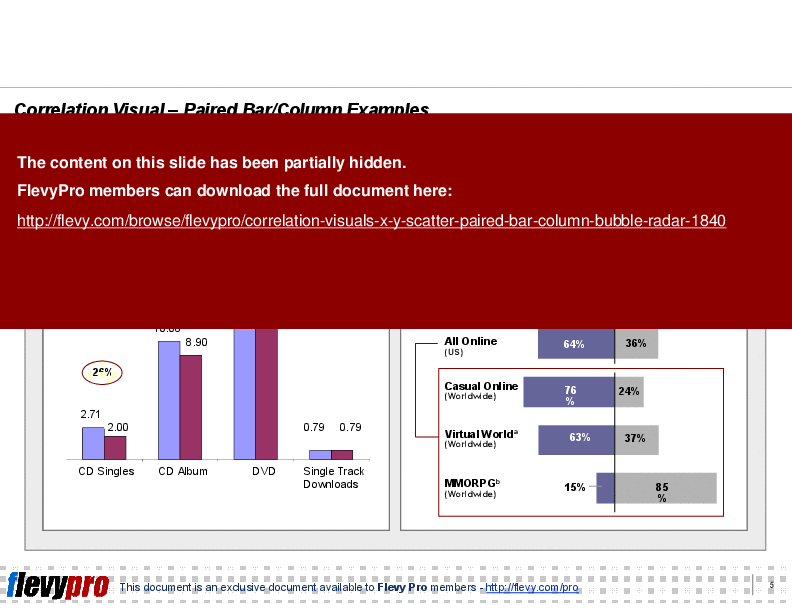
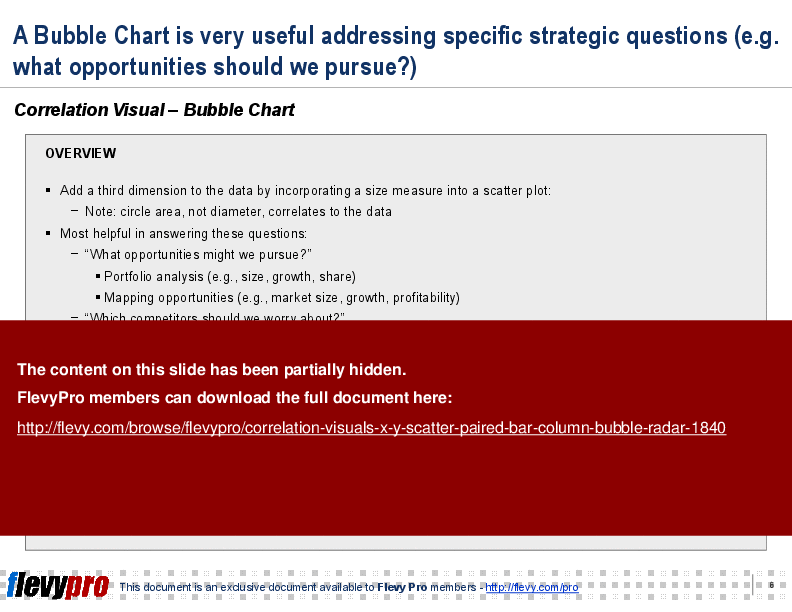
X-Y Scatterplots are essential for identifying relationships and data clusters, making them invaluable for trend analysis and forecasting. Paired Bar/Column Charts offer a robust method for comparing two series across multiple factors, ideal for performance benchmarking across companies, divisions, or locations. The Bubble Chart adds a third dimension to your data, enabling you to visualize size measures and identify strategic opportunities with ease.
Radar Diagrams allow for multi-dimensional comparisons, where each axis represents a different variable. This makes them perfect for competitive analysis and performance evaluation. With practical examples from consulting projects, this presentation equips you with the knowledge to leverage these visuals for strategic insights and enhanced decision-making.
Got a question about this document? Email us at flevypro@flevy.com.
Source: Best Practices in Presentation Development, Chart Design PowerPoint Slides: Correlation Visuals: X-Y Scatter, Paired Bar/Column, Bubble, Radar PowerPoint (PPT) Presentation Slide Deck, LearnPPT Consulting
Add to Cart
Did you need more documents?
Consider a FlevyPro subscription from $39/month. View plans here.
For $10.00 more, you can download this document plus 2 more FlevyPro documents. That's just $13 each.
