
 Click main image to view in full screen. Unlock all 9 preview images:
Startup Runway & Burn Planner: Cash-Out Date & Burn – Excel XLSX
Excel (XLSX) + supplemental PDF


BENEFITS OF THIS DOWNLOADABLE EXCEL DOCUMENT
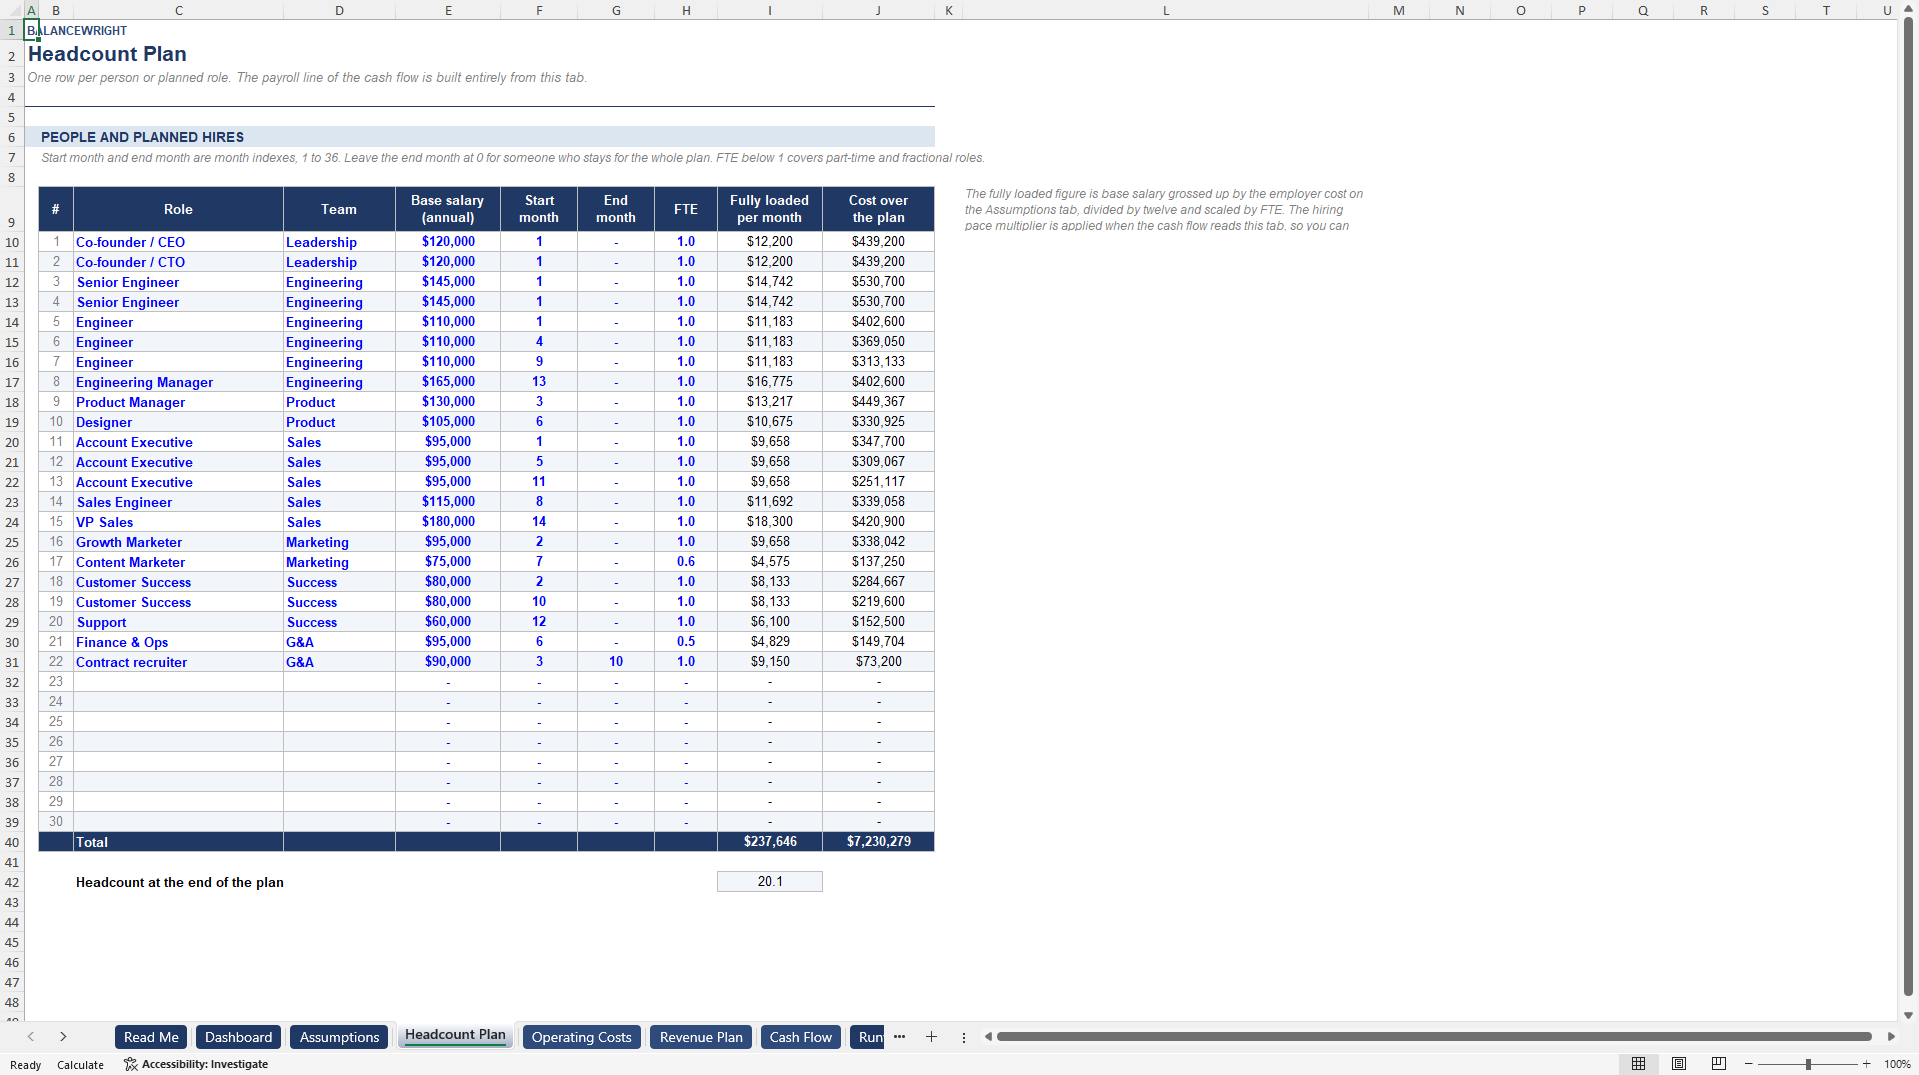
- Builds payroll from a thirty-row headcount plan rather than a typed number, so moving one hire date moves the cash-out date.
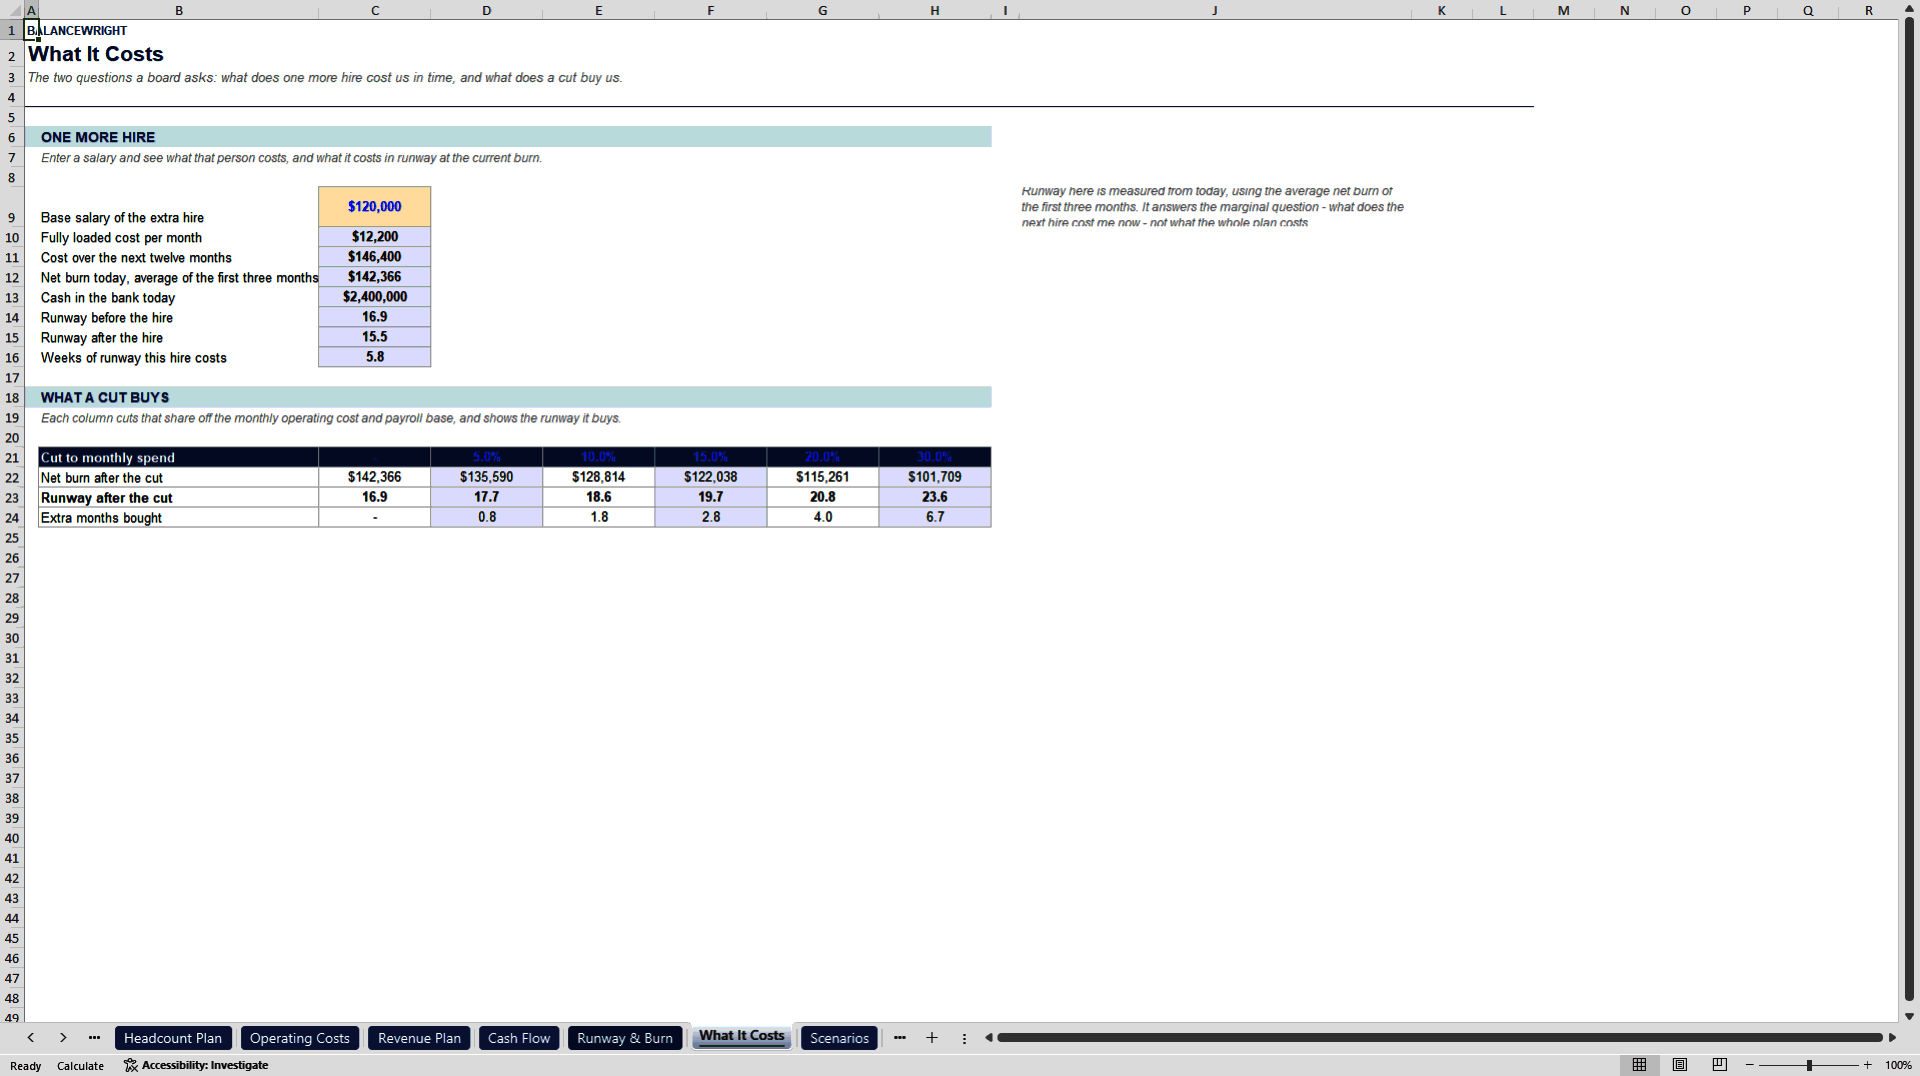
- Answers the two questions a board actually asks: what one more hire costs in weeks of runway, and what a spending cut buys in months.
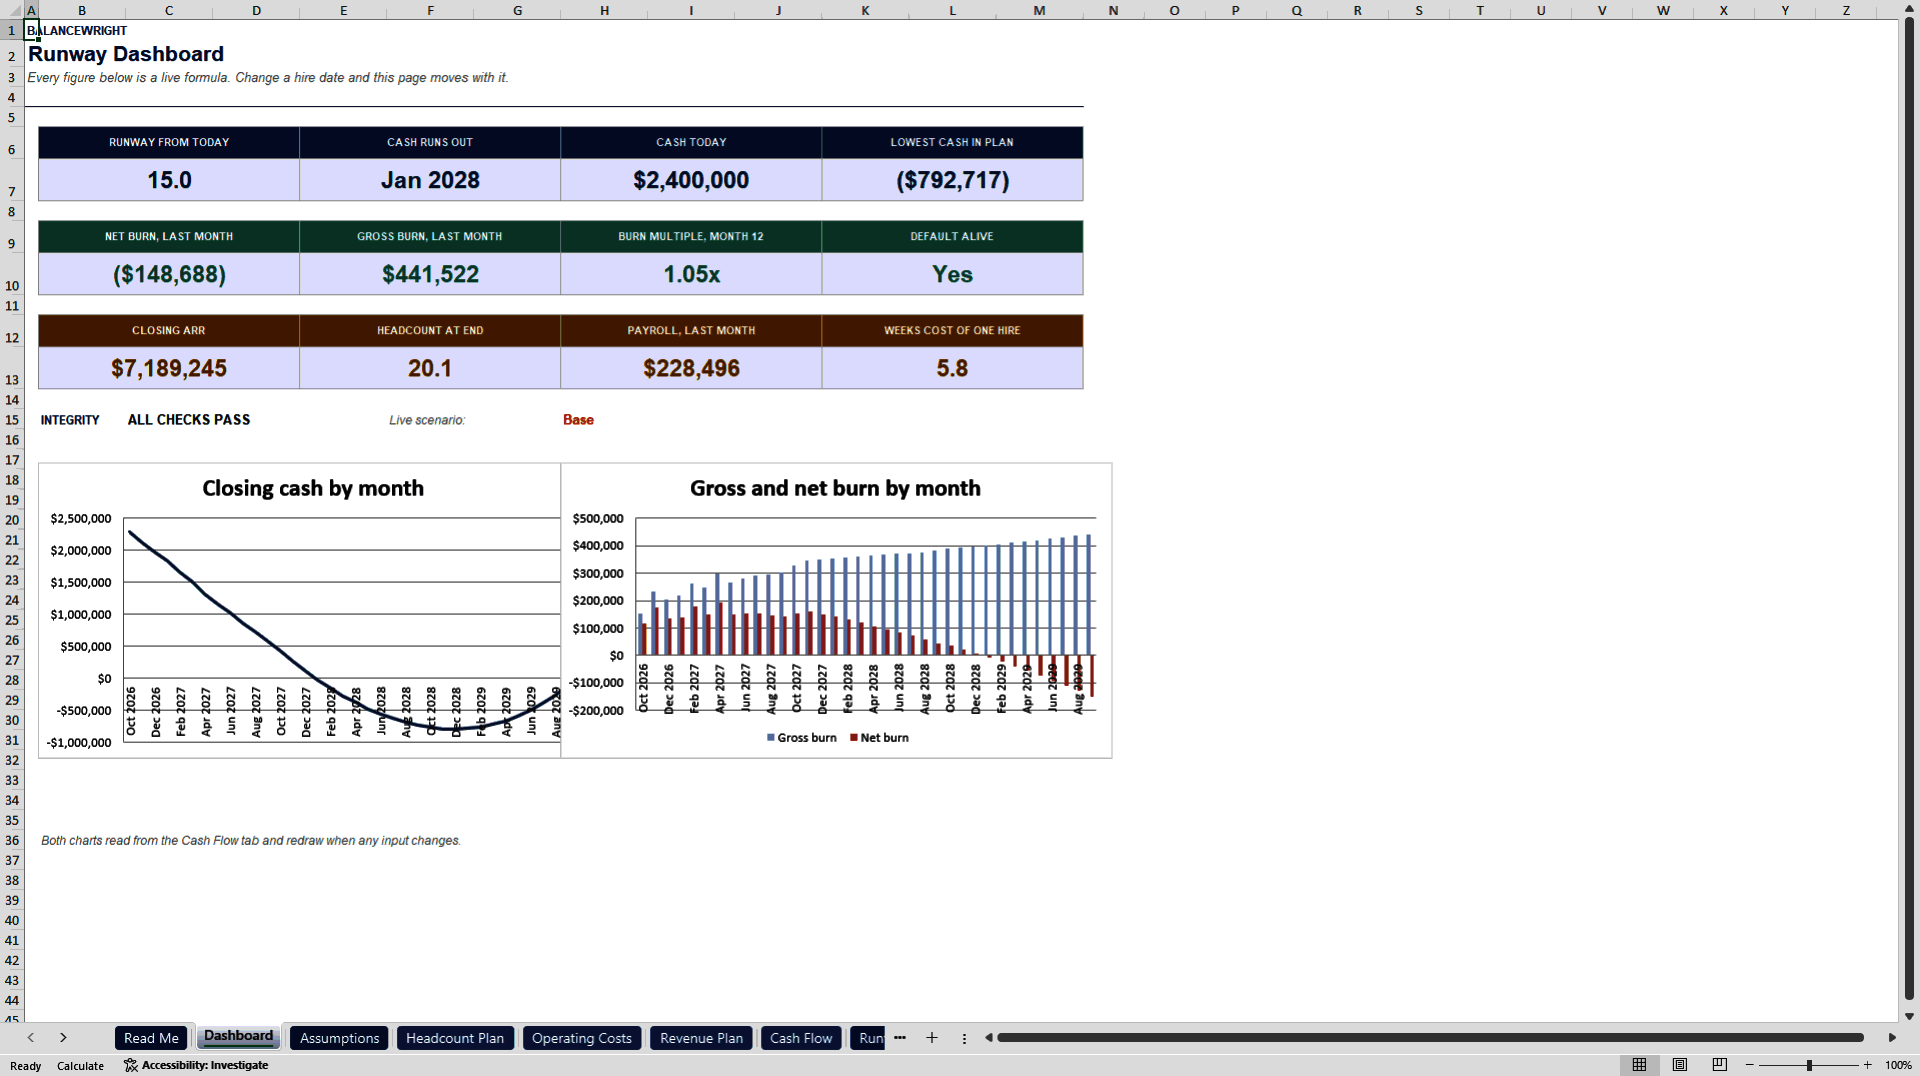
- Reports gross burn, net burn and the burn multiple, with twelve integrity checks that prove the cash rolls forward correctly.
ENTREPRENEURSHIP EXCEL DESCRIPTION
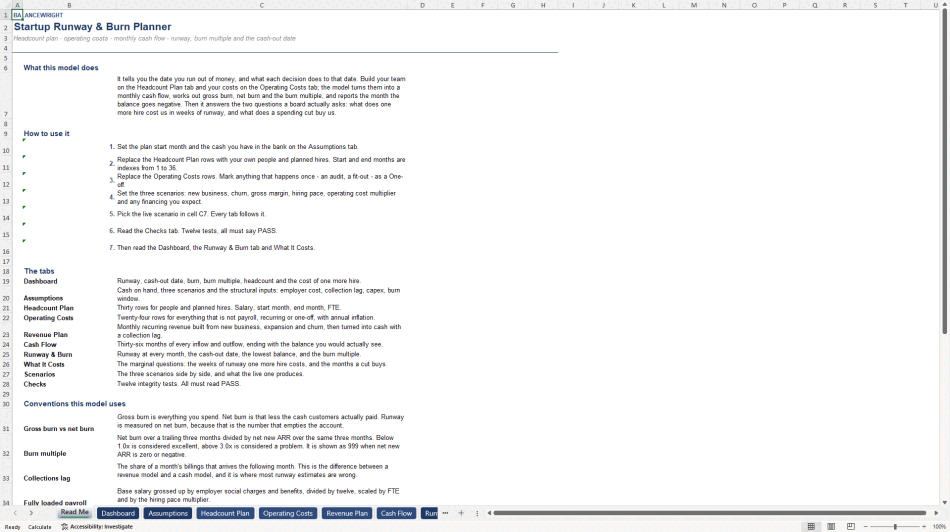
This Excel model tells you the date you run out of money, and what each decision does to that date.
Build your team on the Headcount Plan tab and your costs on the Operating Costs tab. The model turns them into a thirty-six month cash flow, works out gross burn, net burn and the burn multiple, and reports the first month the balance goes negative. Every figure is a live formula.
WHY MOST RUNWAY NUMBERS ARE WRONG
Two gaps sit between a revenue plan and a bank balance, and most runway estimates fall into both.
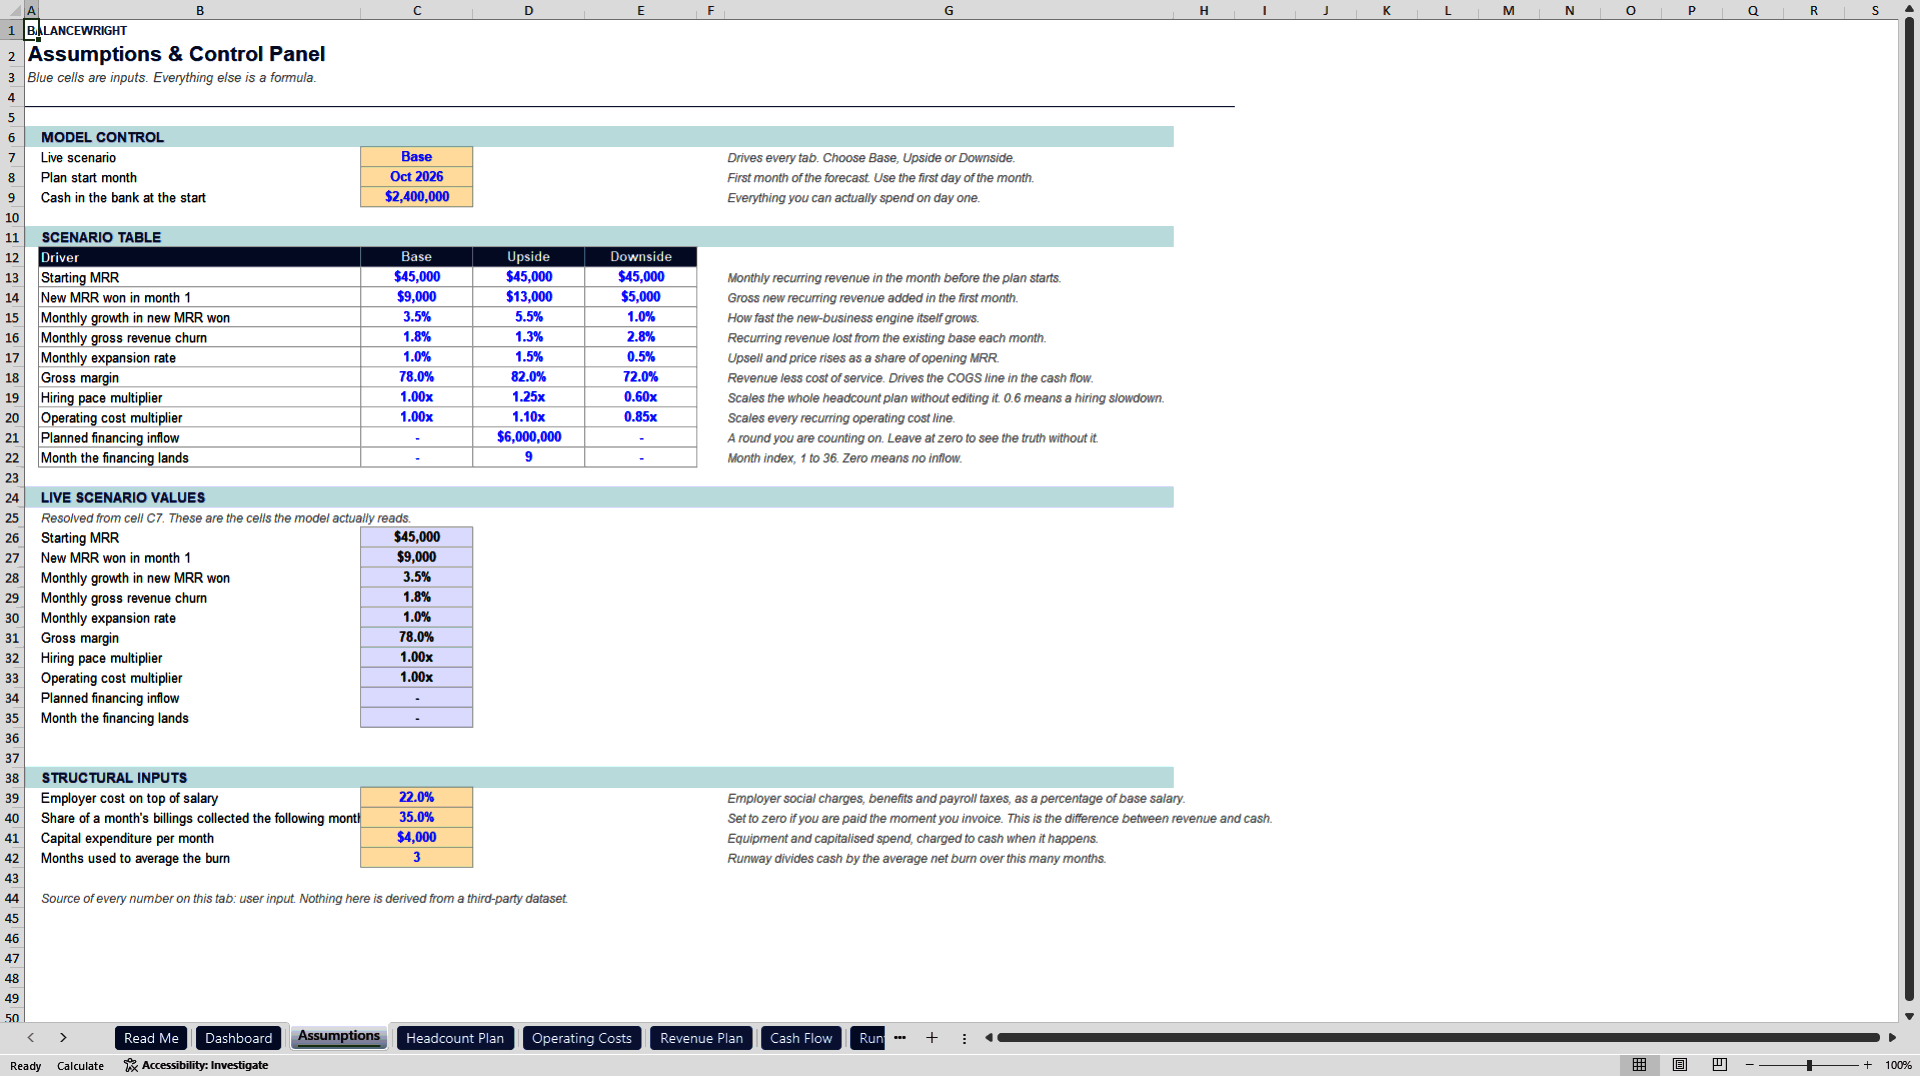
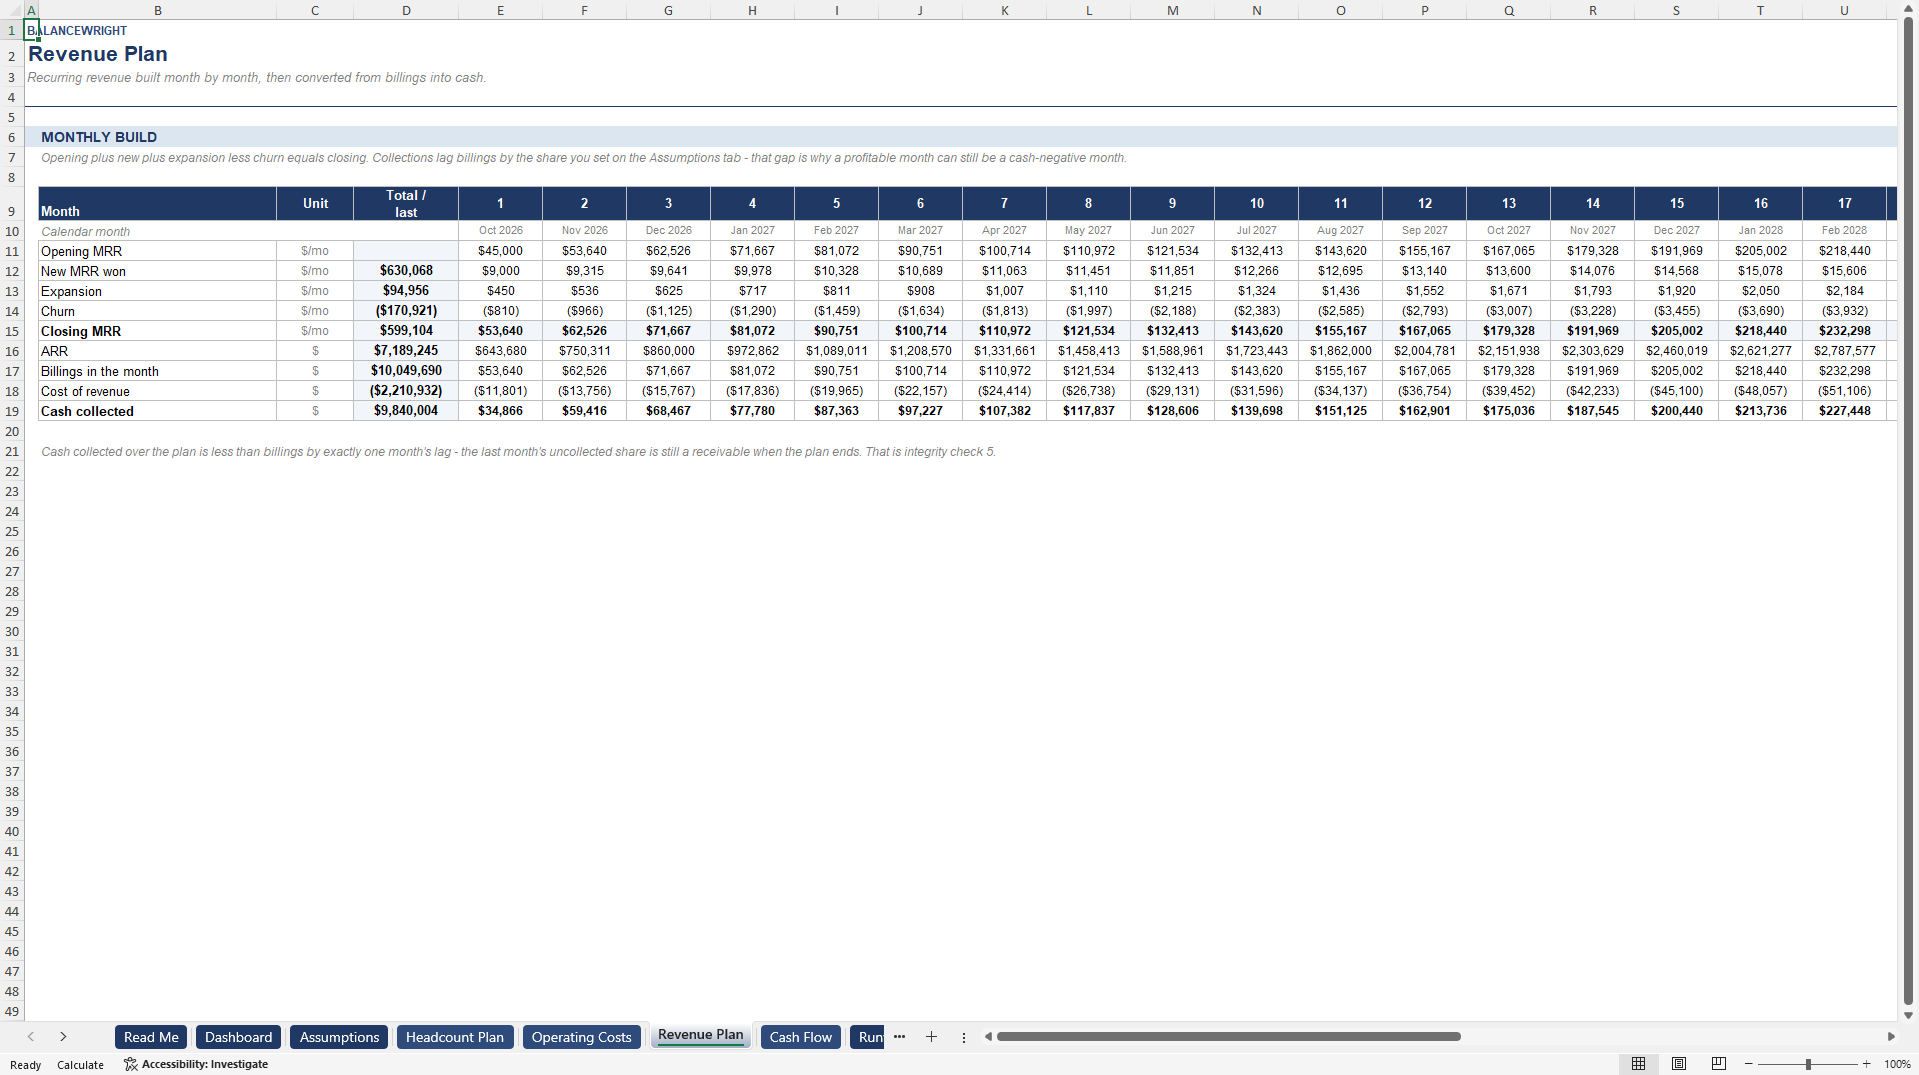
The first is revenue that is not yet cash. This model bills monthly and lets you set the share of a month's billings that arrives the following month. Set it to zero if you are paid on invoice; set it to a third and watch the runway shorten without a single growth assumption changing.
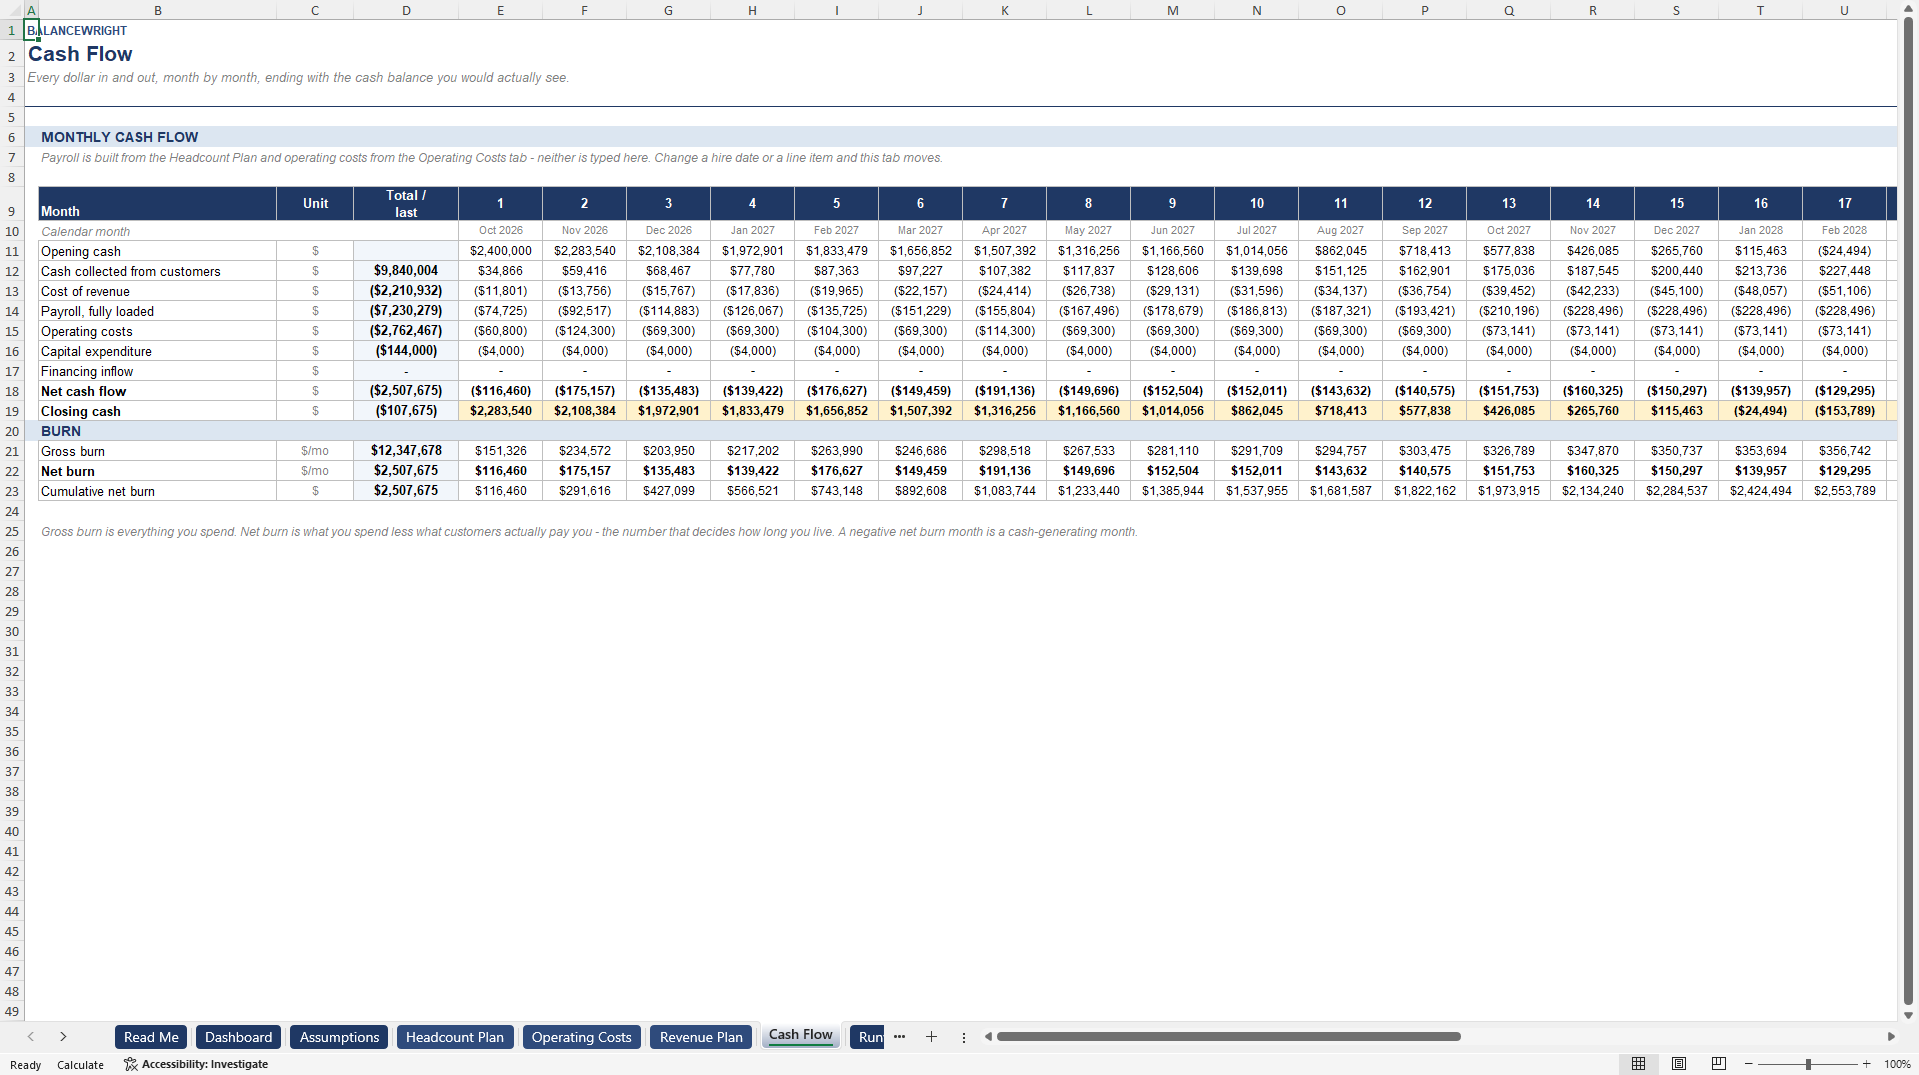
The second is payroll that is not really in the plan. Payroll here is not typed into the cash flow. It is built from the headcount plan, person by person, grossed up by employer social charges and benefits, and scaled by a hiring pace multiplier so you can model a slowdown without deleting anyone. Change one start month and the cash-out date moves.
WHAT IS INSIDE
Eleven tabs: Read Me, Dashboard, Assumptions, Headcount Plan, Operating Costs, Revenue Plan, Cash Flow, Runway and Burn, What It Costs, Scenarios, Checks. Thirty headcount rows, twenty-four operating cost lines, thirty-six months, three scenarios switched from one cell.
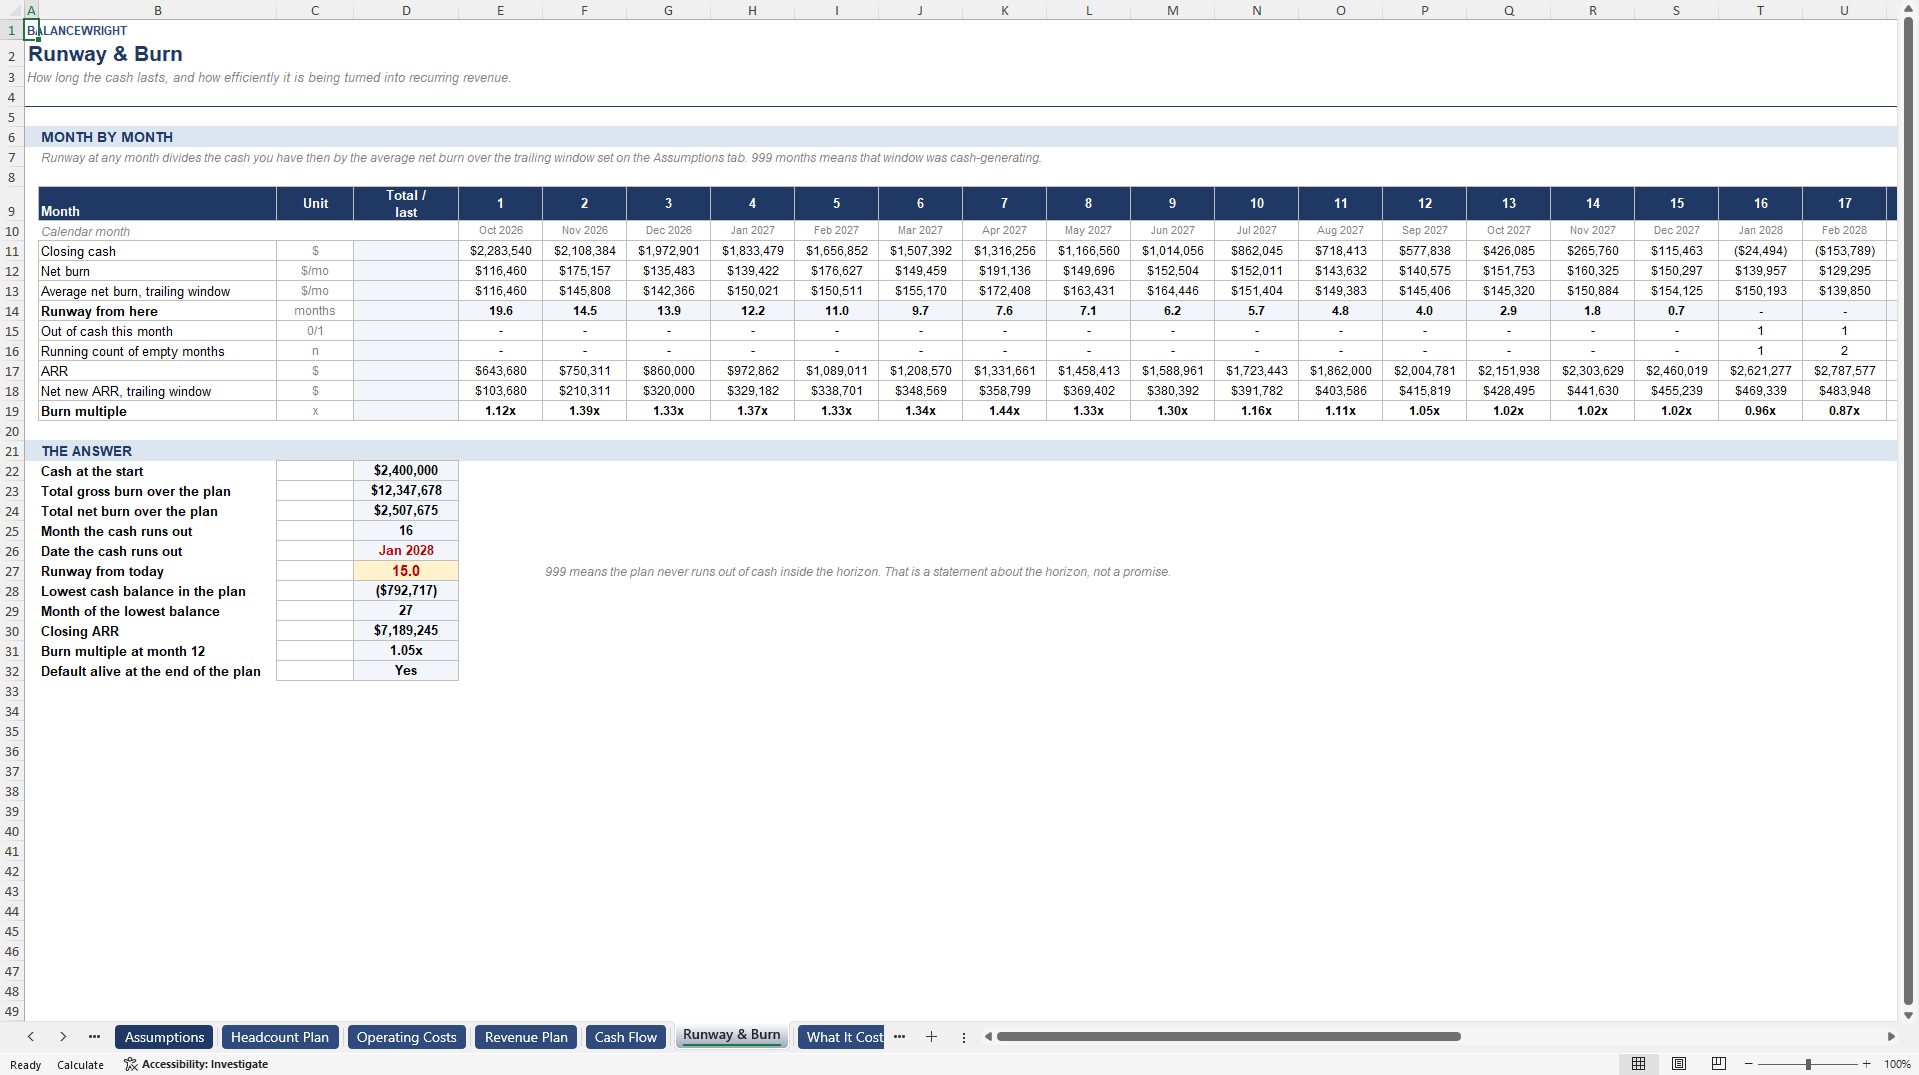
The Runway and Burn tab reports runway at every month, not just at the start: cash at that point divided by the average net burn over a trailing window you set. The cash-out date is the first month the balance is genuinely negative, and an integrity check proves the month reported is the right one.
It also computes the burn multiple, which is net burn over a trailing quarter divided by the net new ARR added in that quarter. That is the number investors quote back at founders now, and it answers a question runway cannot: not how long you last, but how much you are paying for each dollar of new recurring revenue.
The What It Costs tab answers the two marginal questions directly. Enter a salary and it tells you how many weeks of runway that hire costs. A second table shows what a five, ten, fifteen, twenty or thirty percent cut buys, in months.
HOW IT IS BUILT
Fourteen hundred live formulas. No macros, no add-ins, no external links, no password protection and no locked cells. A worked example runs through the whole file: a twenty-two person plan, forty-five thousand of starting monthly recurring revenue, two point four million in the bank and a cash-out date fifteen months out. A five-page PDF guide documents every convention and every limitation.
Twelve integrity checks sit on their own tab and must all read PASS: cash rolls forward, each month's closing balance is the next month's opening balance, payroll ties to the headcount plan, gross burn equals its components, net burn equals gross burn less collections, collections equal billings less the final month's lag, the revenue bridge ties, and the cash-out month is genuinely the first negative month.
This workbook models the arithmetic of your own plan. It is not financial advice.
Building this from scratch takes a competent financial modeller a day or two.
Got a question about the product? Email us at support@flevy.com or ask the author directly by using the "Ask the Author a Question" form. If you cannot view the preview above this document description, go here to view the large preview instead.
Source: Best Practices in Entrepreneurship, Integrated Financial Model Excel: Startup Runway & Burn Planner: Cash-Out Date & Burn Excel (XLSX) Spreadsheet, Balancewright
ABOUT THE AUTHOR

Balancewright builds working financial models for subscription and recurring-revenue businesses -- cohort retention, revenue movement, unit economics, cash flow and scenario forecasting.
Every model is formula-driven end to end. No locked cells, no passwords, no macros and no external links, so any calculation can be inspected, adapted and audited. Each file ships with a visible
... [read more]
Ask the Author a Question
You must be logged in to contact the author.




























