
 Click main image to view in full screen.
13-Week Cash Flow Forecast & Working Capital Bridge – Excel XLSX
Excel (XLSX) + supplemental PDF


BENEFITS OF THIS DOWNLOADABLE EXCEL DOCUMENT
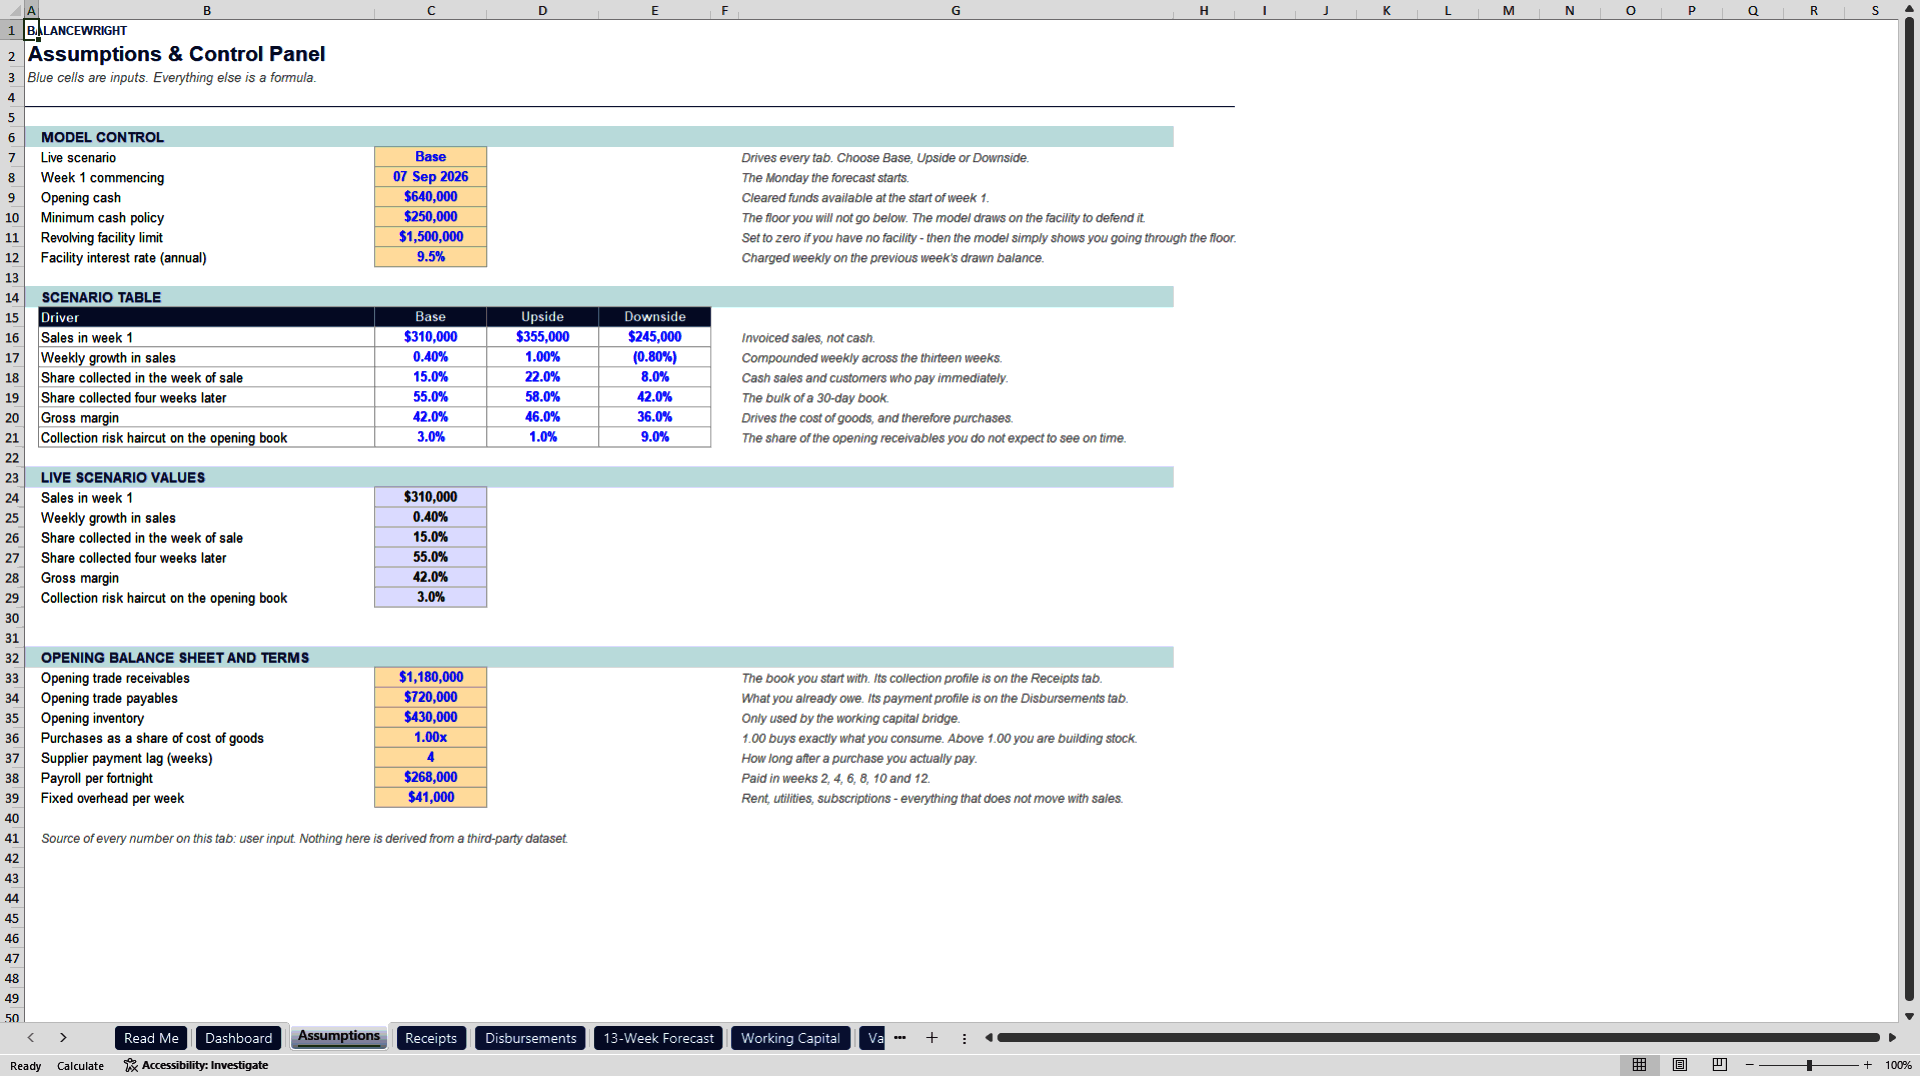
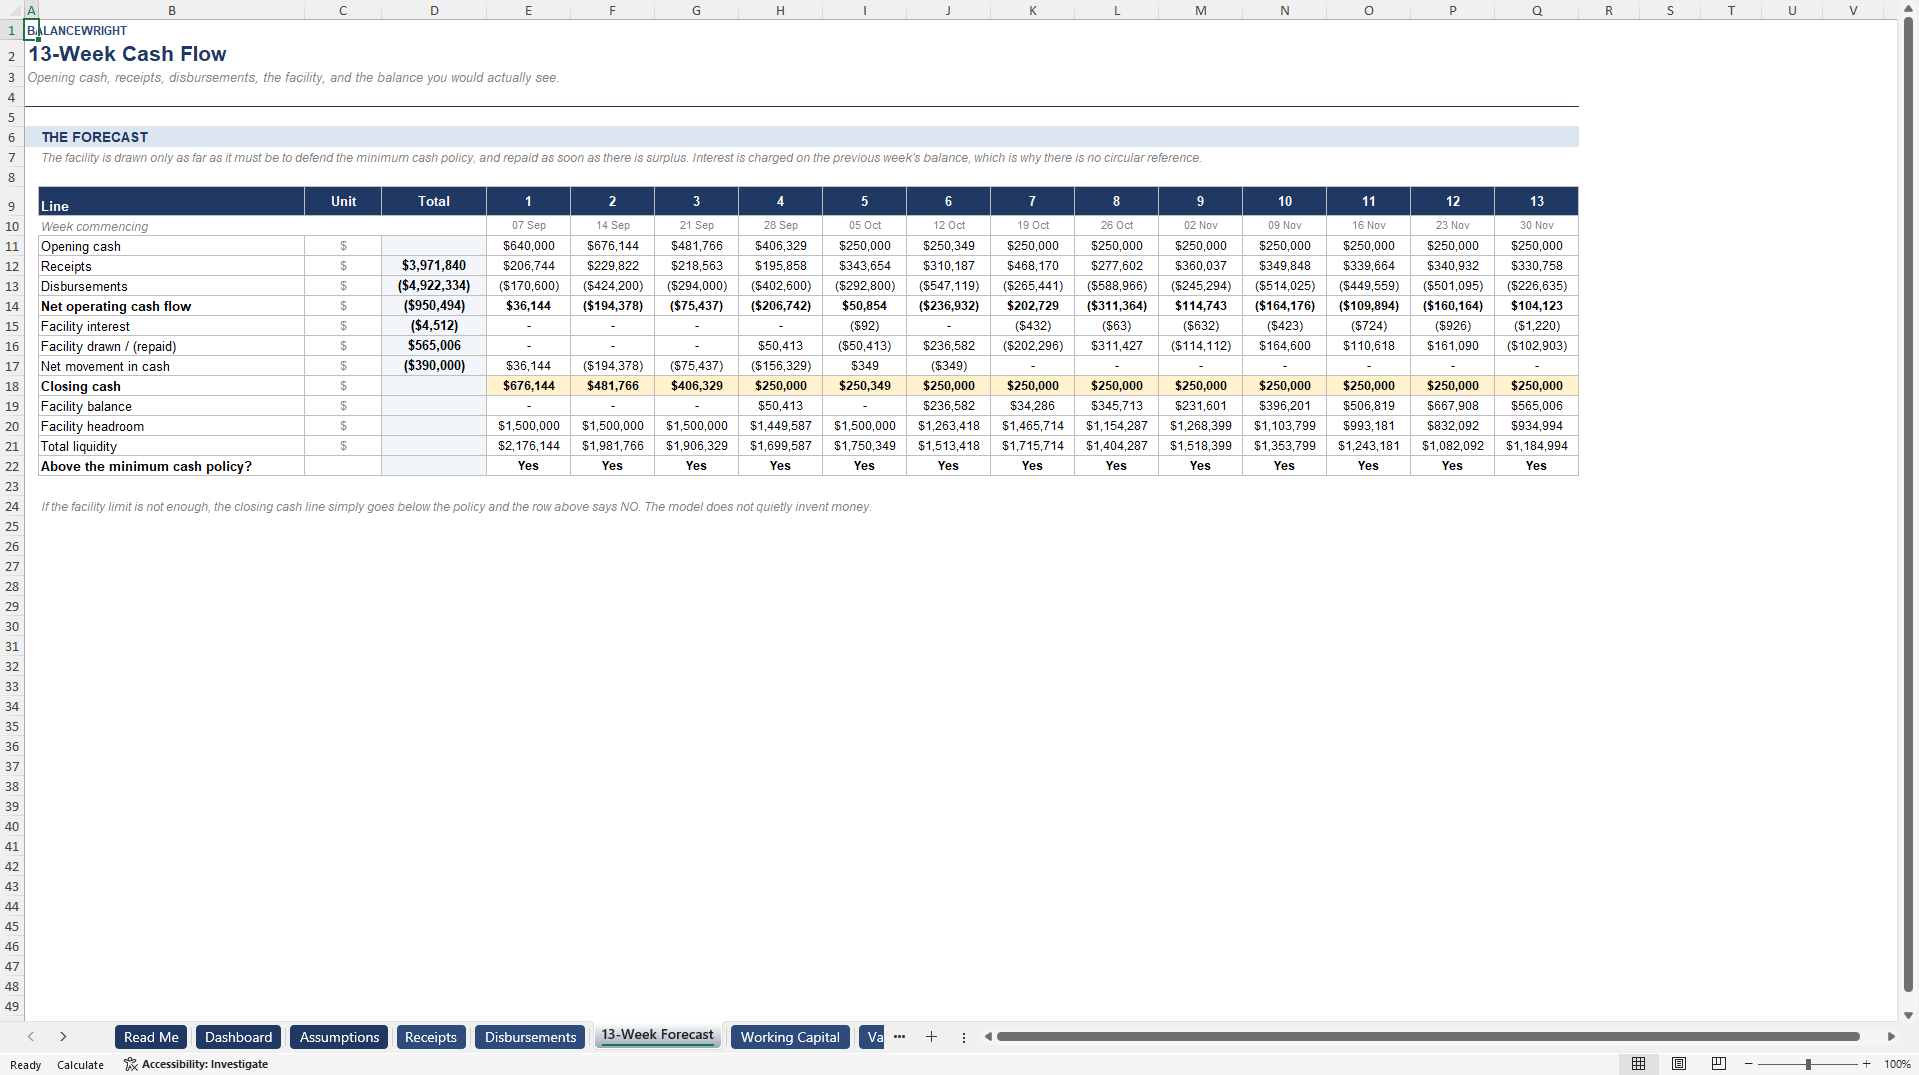
- Draws on a revolving facility only as far as it must to hold your minimum cash policy, with interest charged so the model never becomes circular.
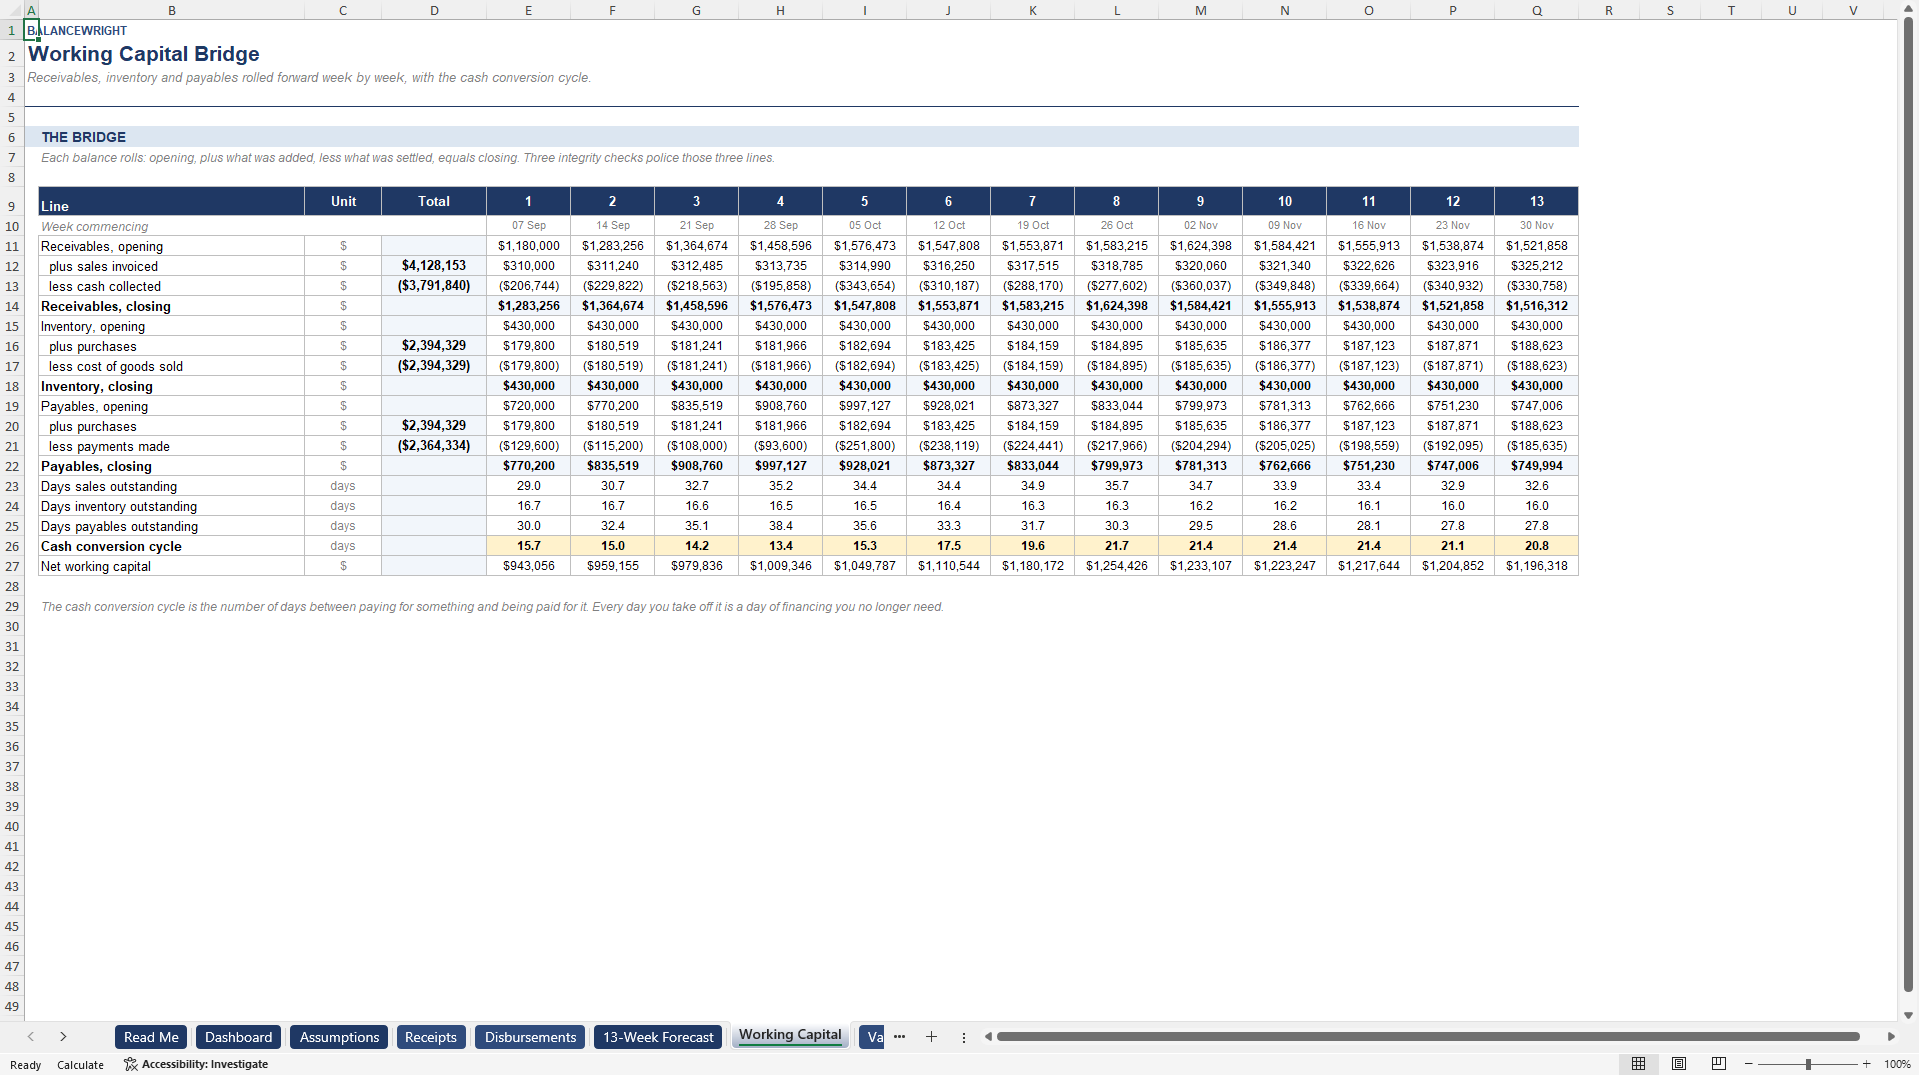
- Rolls receivables, inventory and payables forward every week and reports the cash conversion cycle, so you see why the cash moved and not just that it did.
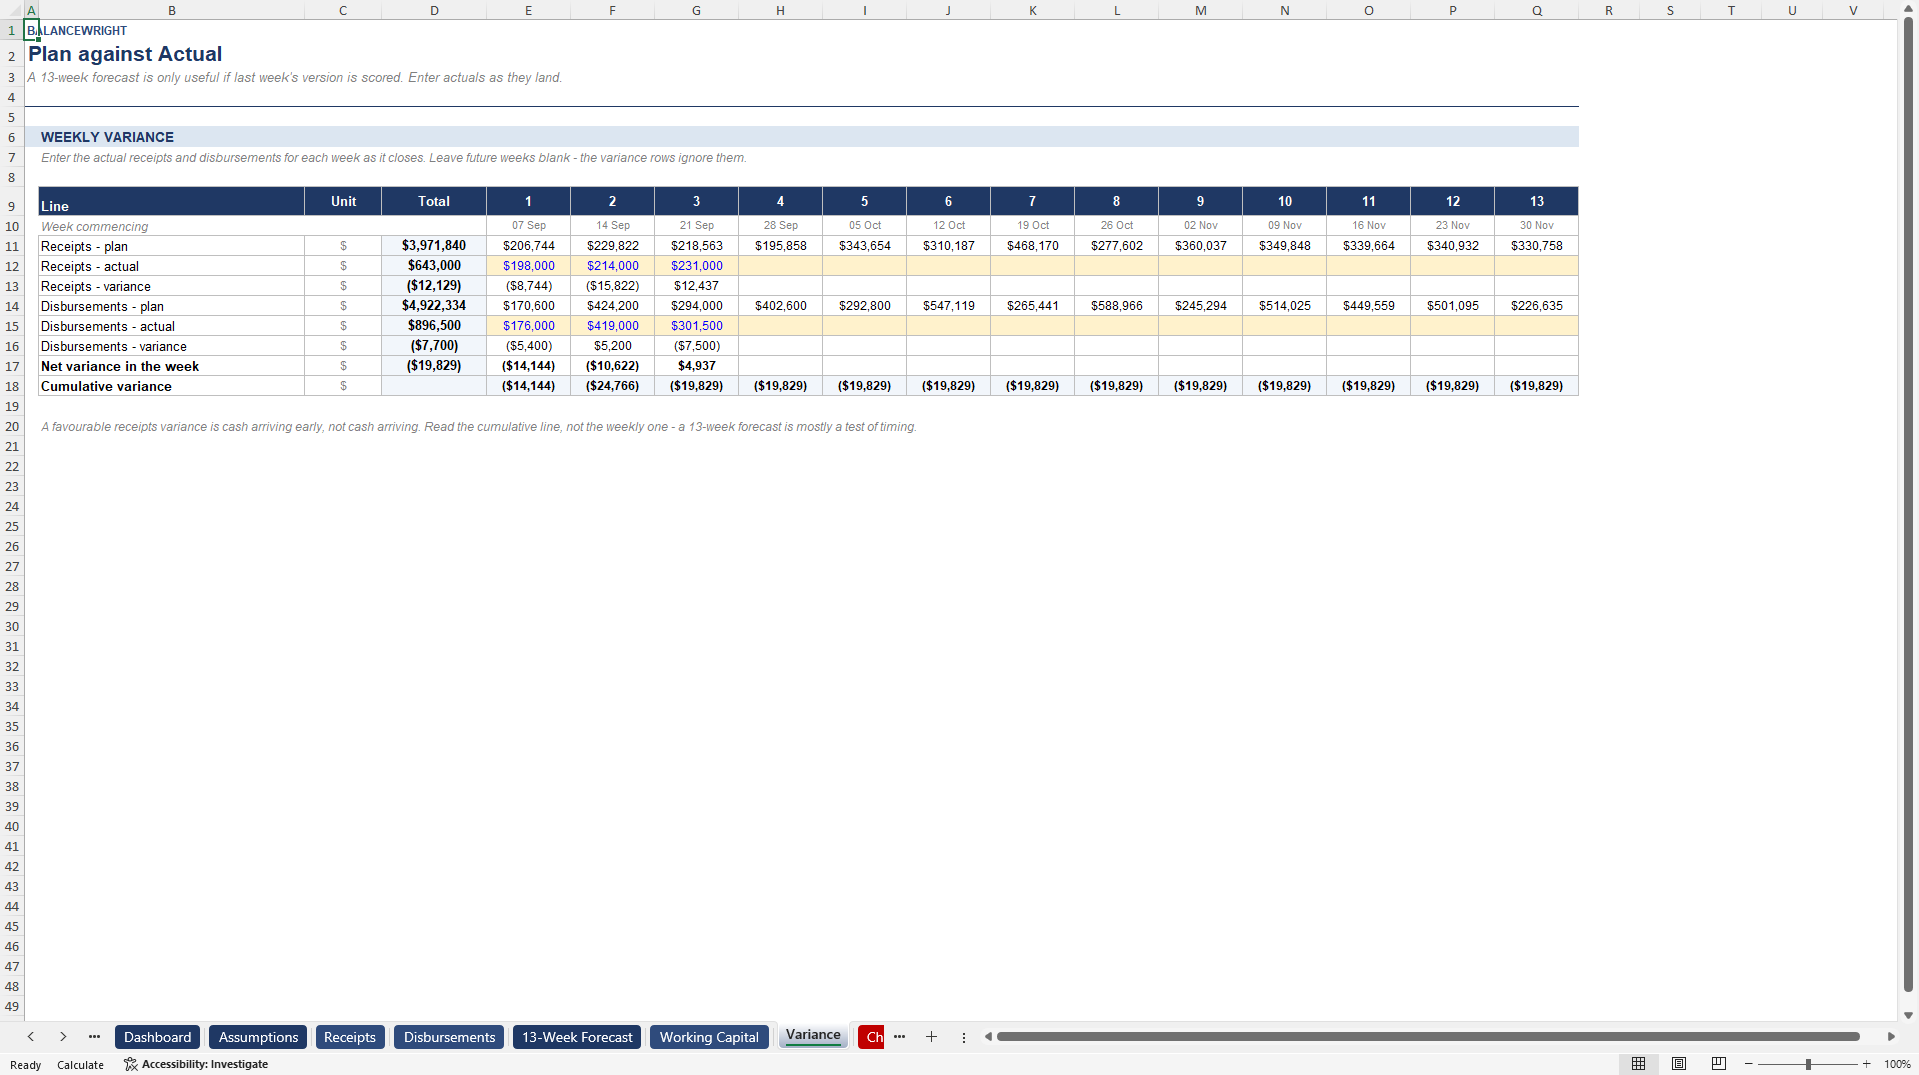
- Scores itself: enter actuals as the weeks close and the variance tab tells you how good the forecast was, weekly and cumulatively.
CASH FLOW MANAGEMENT EXCEL DESCRIPTION
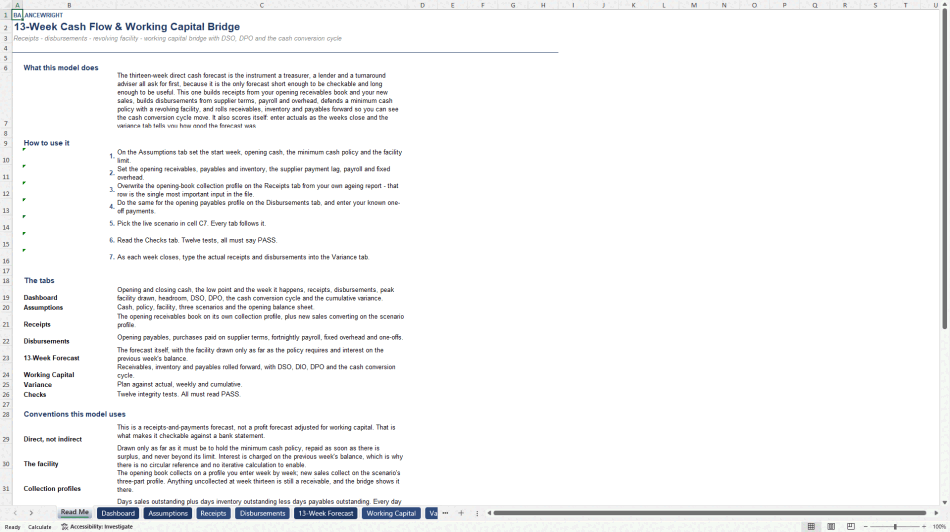
The thirteen-week direct cash forecast is the instrument a treasurer, a lender and a turnaround adviser all ask for first, because it is the only forecast short enough to be checkable and long enough to be useful.
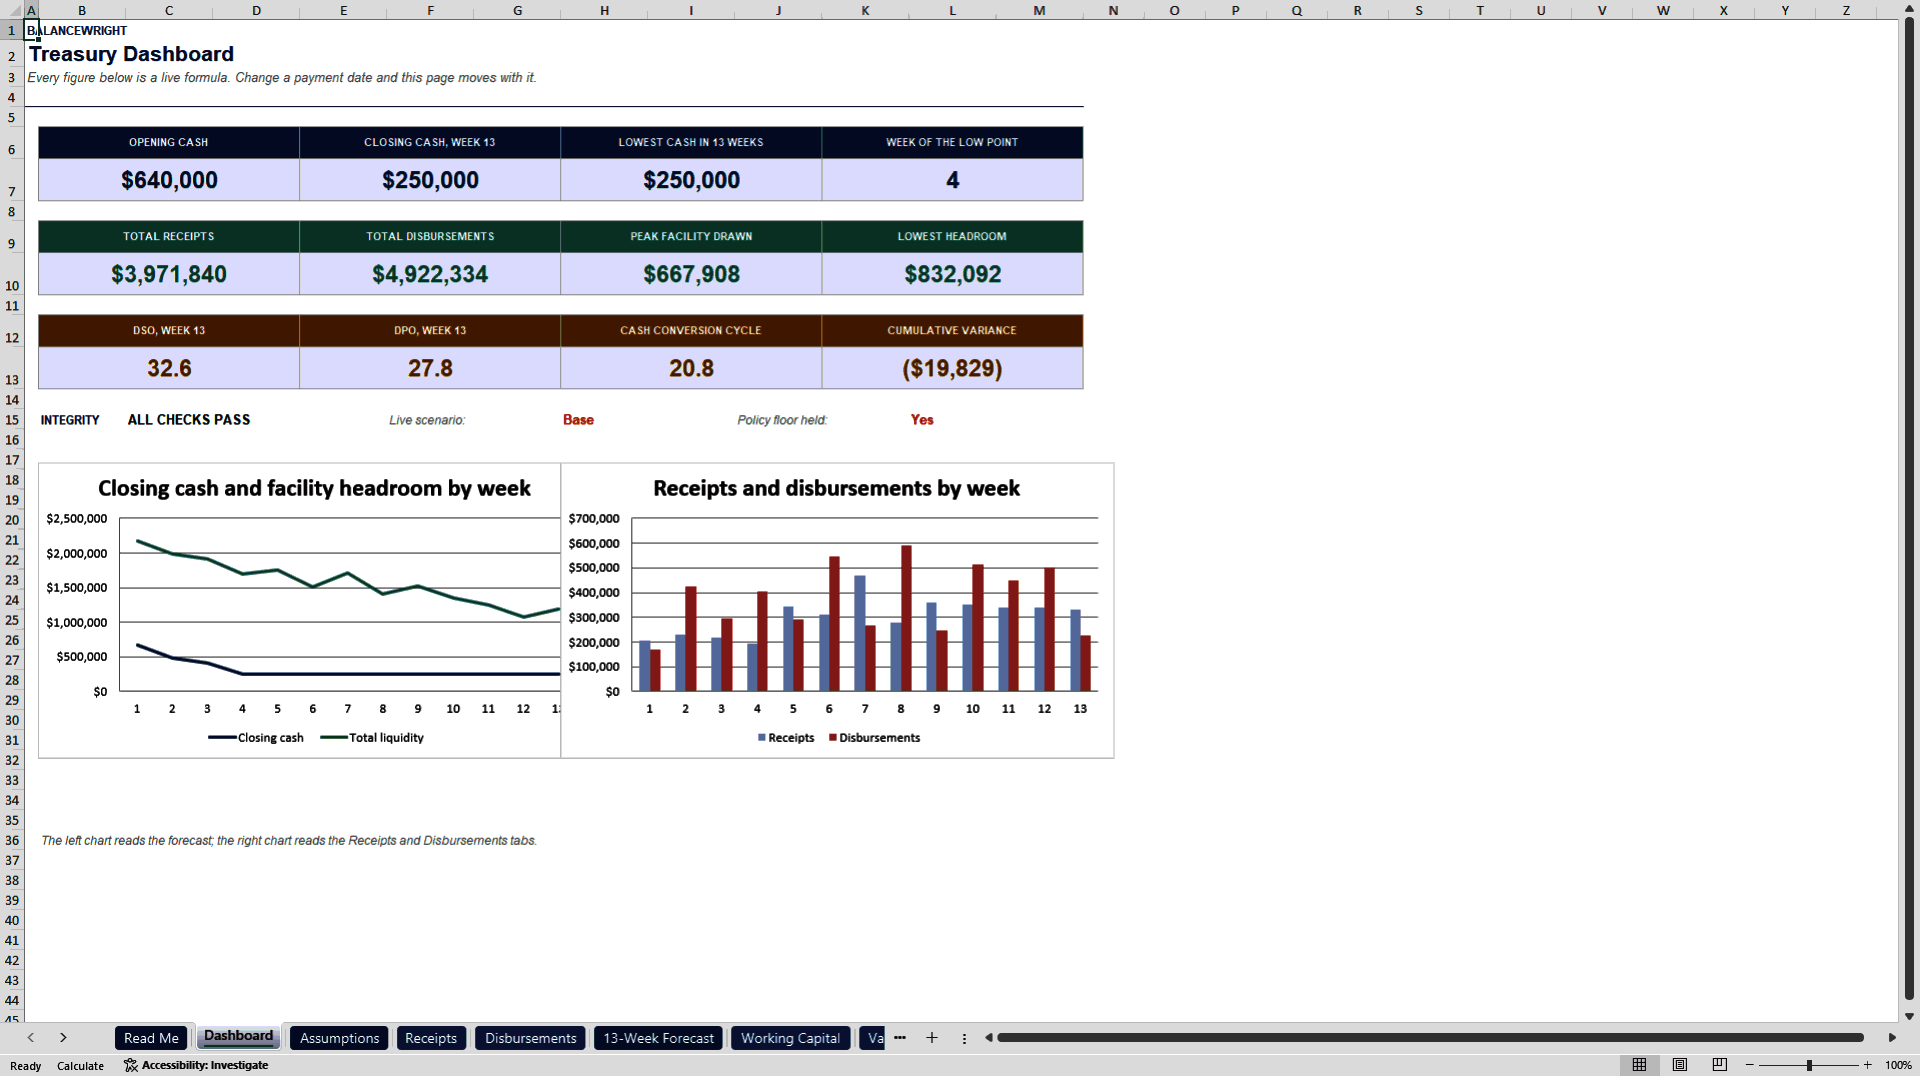
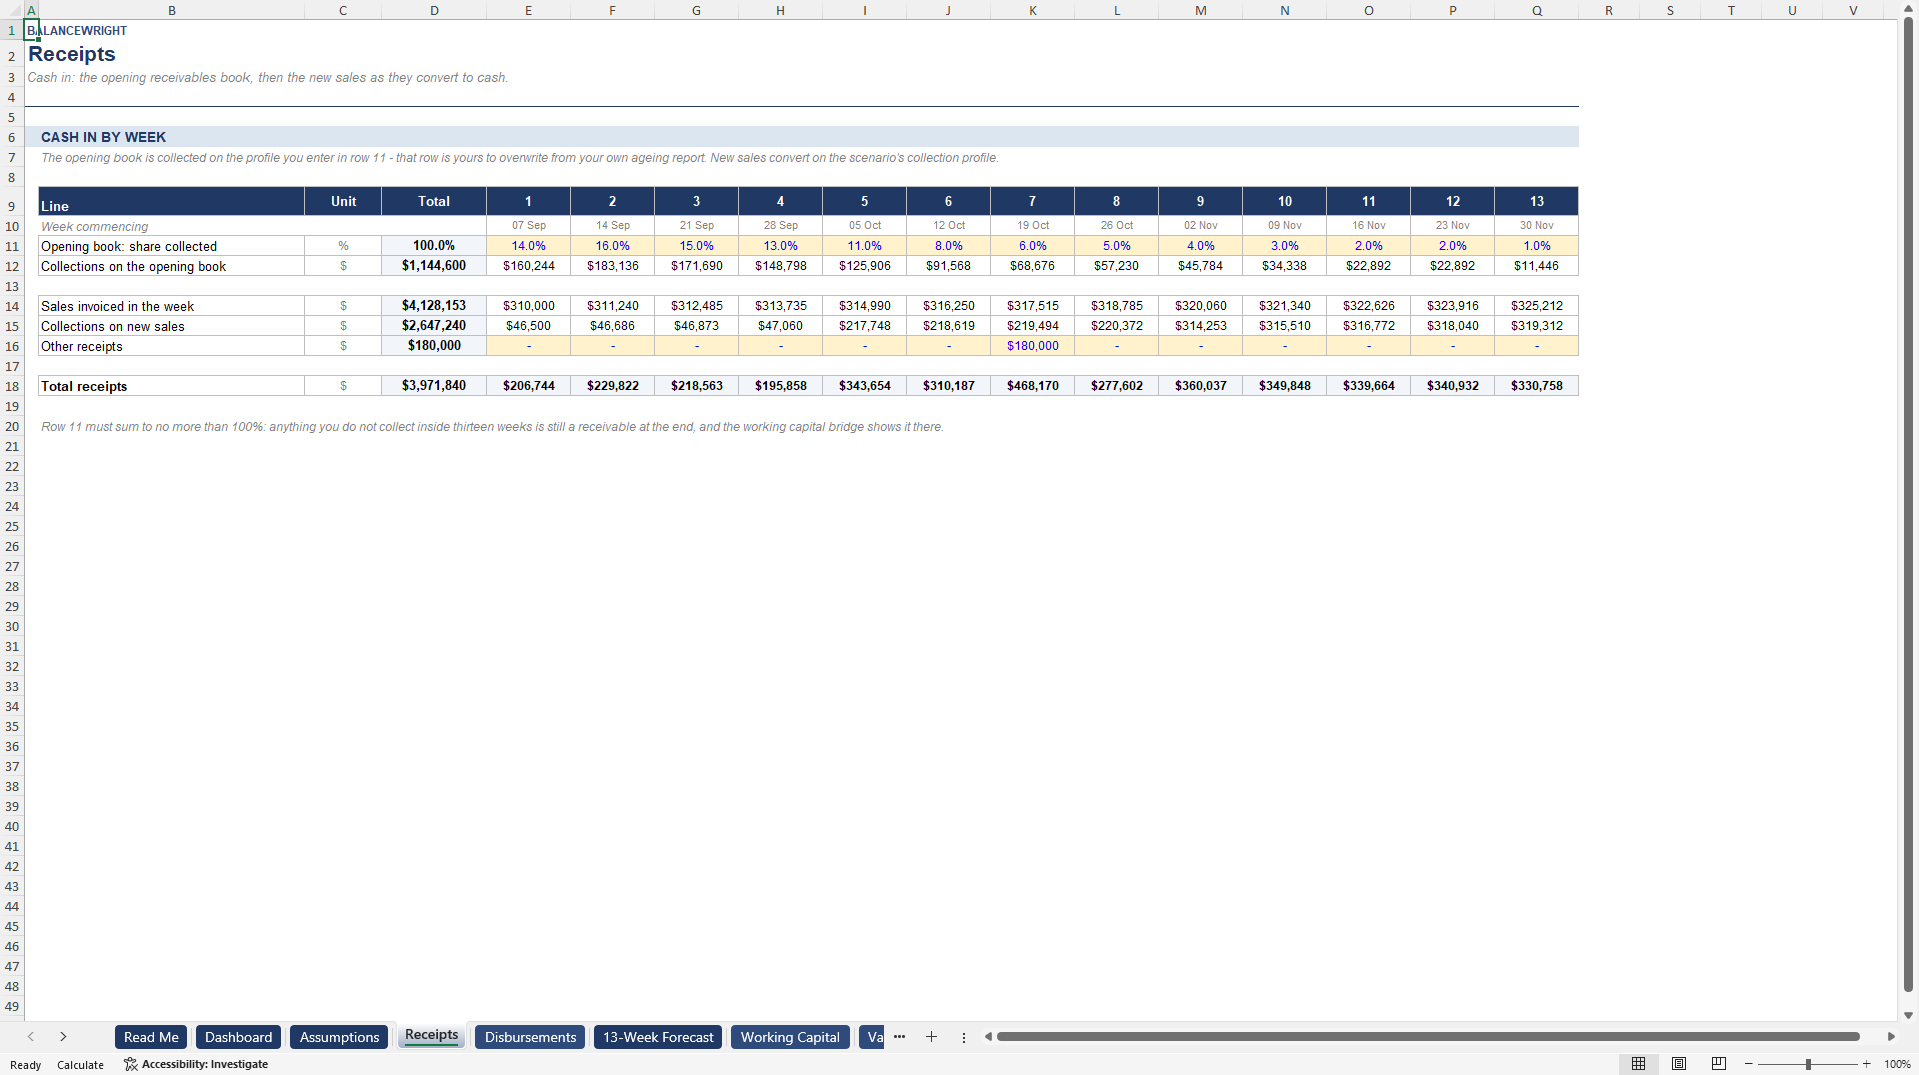
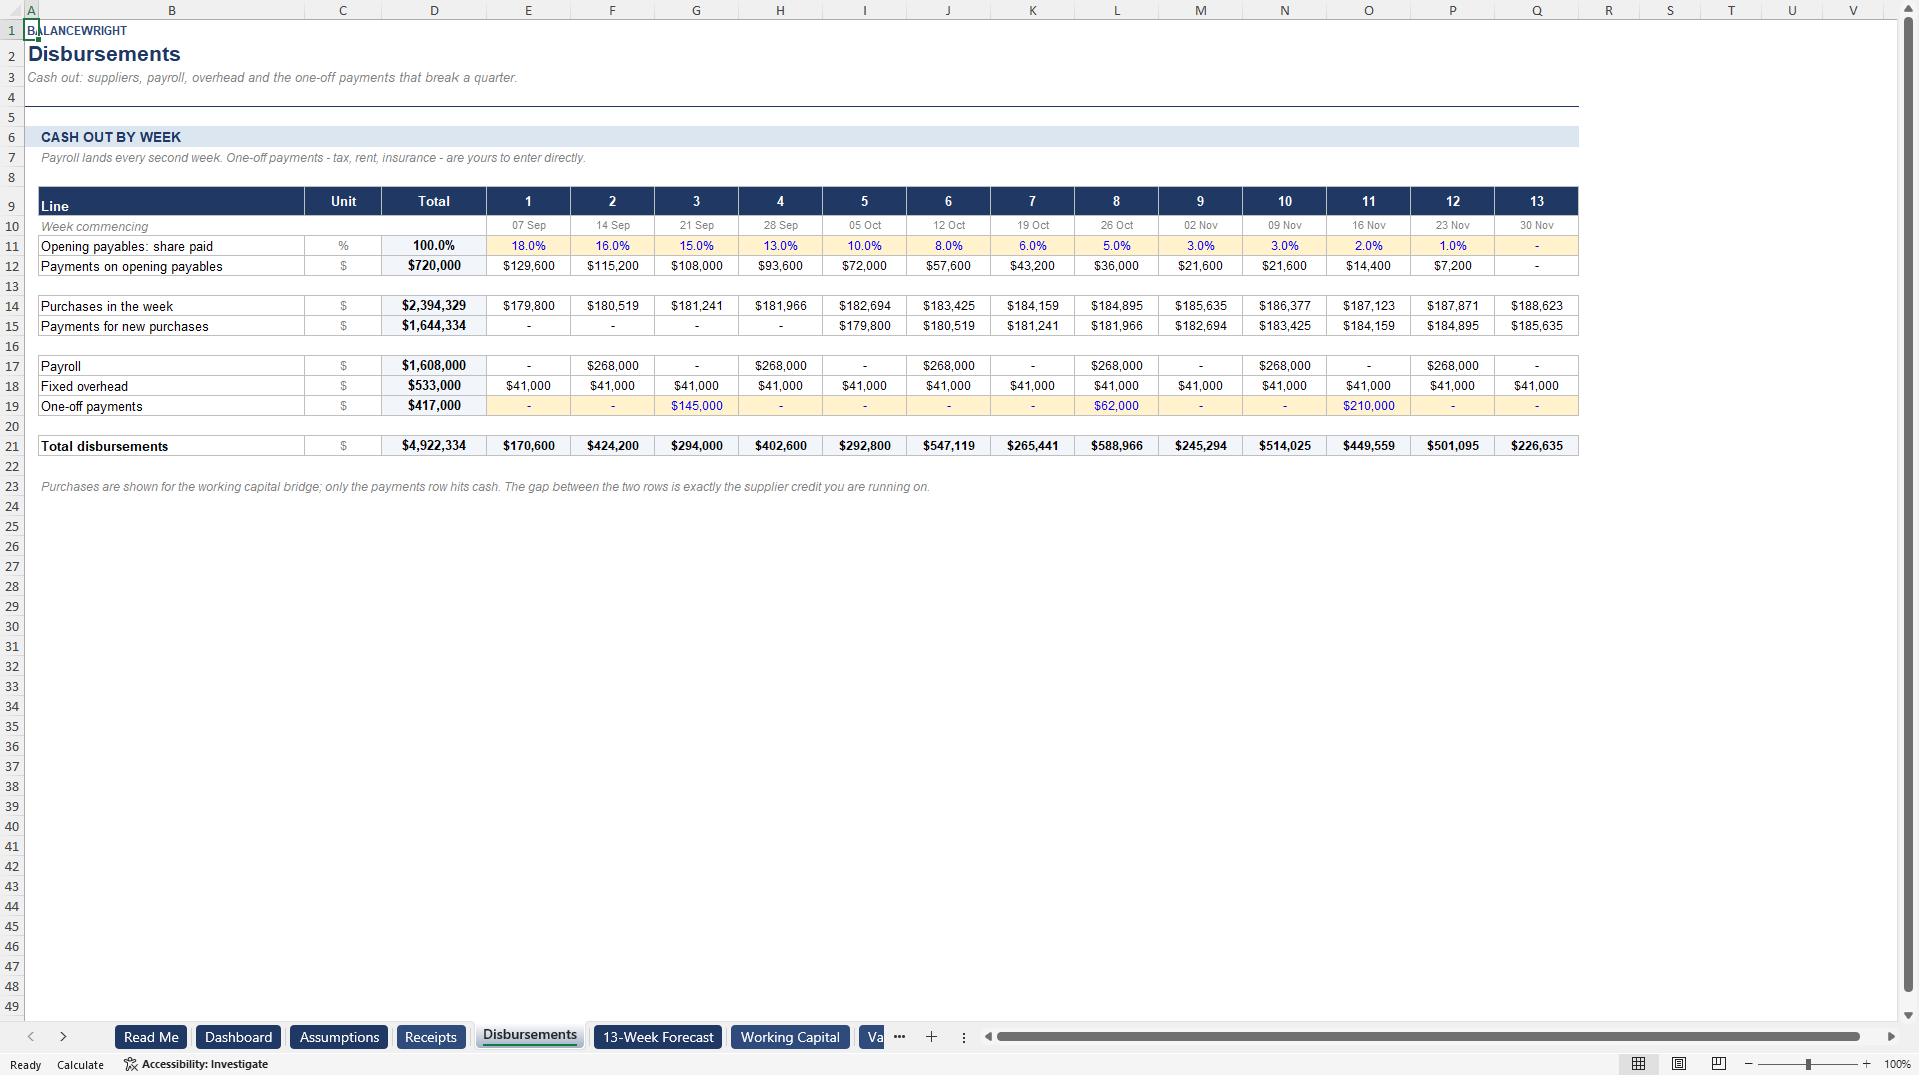
This one builds receipts from your opening receivables book and your new sales, builds disbursements from supplier terms, payroll and overhead, defends a minimum cash policy with a revolving facility, and rolls receivables, inventory and payables forward so the cash conversion cycle moves in front of you. Every figure is a live formula.
THE FACILITY, WITHOUT A CIRCULAR REFERENCE
A thirteen-week model that ignores the revolver answers the wrong question. The question is not whether cash goes negative; it is whether you breach your policy floor, how much of the facility that consumes, and how much headroom is left when the quarter's tax payment lands.
This model draws on the facility only as far as it must to hold the minimum cash policy, and repays as soon as there is surplus. Interest is charged on the previous week's drawn balance rather than the current one, which is a deliberate choice: charging on the current balance makes the model circular and forces the reader to enable iterative calculation. On a weekly facility the difference is a few hundred dollars; the difference in auditability is total.
If the facility is not large enough, the model does not quietly invent money. The closing cash line goes below the policy, the row underneath says NO, and the dashboard says the floor was not held.
THE WORKING CAPITAL BRIDGE, AND WHY IT BELONGS HERE
Most thirteen-week templates stop at the cash line. That tells you what happens but not why, and it gives you nothing to manage. This model rolls the three working capital balances forward every week, receivables plus sales less collections, inventory plus purchases less cost of goods, payables plus purchases less payments, and three integrity checks confirm each one ties on every column.
From those balances it computes days sales outstanding, days inventory outstanding, days payables outstanding and the cash conversion cycle. The cycle is the number of days between paying for something and being paid for it, and every day taken off it is a day of financing you no longer need. In the worked example the cycle drifts from sixteen days to twenty-one across the quarter, which is the real story behind the facility drawdown and is invisible on the cash line alone.
WHAT IS INSIDE
Nine tabs: Read Me, Dashboard, Assumptions, Receipts, Disbursements, 13-Week Forecast, Working Capital, Variance, Checks.
The opening receivables book is collected on a profile you enter week by week. Overwrite it from your own ageing report, because it is the single most important input in the file. New sales convert on a three-part profile. Payables are paid on their own profile, purchases on supplier terms, payroll fortnightly, and the one-off payments that break a quarter go in their own row.
The Variance tab scores the forecast: enter actual receipts and disbursements as each week closes and read the cumulative line, because a thirteen-week forecast is mostly a test of timing.
No macros, no add-ins, no external links, no password protection, no locked cells and no iterative calculation to switch on. A five-page PDF guide documents every convention and every limitation. Twelve integrity checks sit on their own tab and must all read PASS.
This workbook models the arithmetic of your own forecast. It is not financial advice.
Building this from scratch takes a competent financial modeller a day or two.
Got a question about the product? Email us at support@flevy.com or ask the author directly by using the "Ask the Author a Question" form. If you cannot view the preview above this document description, go here to view the large preview instead.
Source: Best Practices in Cash Flow Management, Integrated Financial Model Excel: 13-Week Cash Flow Forecast & Working Capital Bridge Excel (XLSX) Spreadsheet, Balancewright
ABOUT THE AUTHOR

Balancewright builds working financial models for subscription and recurring-revenue businesses -- cohort retention, revenue movement, unit economics, cash flow and scenario forecasting.
Every model is formula-driven end to end. No locked cells, no passwords, no macros and no external links, so any calculation can be inspected, adapted and audited. Each file ships with a visible
... [read more]
Ask the Author a Question
You must be logged in to contact the author.




























