
Enhanced Generic Startup Financial Projection 3 Statement Model – Excel XLSX
Excel (XLSX) + Excel (XLSX)
BENEFITS OF THIS DOWNLOADABLE EXCEL DOCUMENT
- To assist startup businesses with producing financial projections using a robust user-friendly template.
ENTREPRENEURSHIP EXCEL DESCRIPTION
A Generic Startup Financial Projection (3-Statement) is critical for new businesses. It forecasts income, expenses, and cash flow, providing a roadmap for financial planning. This model helps startups secure funding by showcasing growth potential to investors. It aids in setting realistic milestones, making informed decisions, and steering the company toward profitability. Additionally, it assists in risk assessment and scenario analysis, preparing for unforeseen challenges. In essence, a well-constructed 3-Statement Startup Financial Projection serves as the financial foundation for startups, fostering sustainability, informed decision-making, and attracting crucial early-stage investments.
PURPOSE OF MODEL
User-friendly Excel model intended for the preparation of a 3 statement (Income Statement, Balance Sheet and Cash flow Statement) 5-year financial projection for a generic start-up business. The model follows best practice financial modelling principles and includes instructions, line item explanations, checks and input validations
KEY OUTPUTS
The model is generic and not industry-specific. The key outputs include:
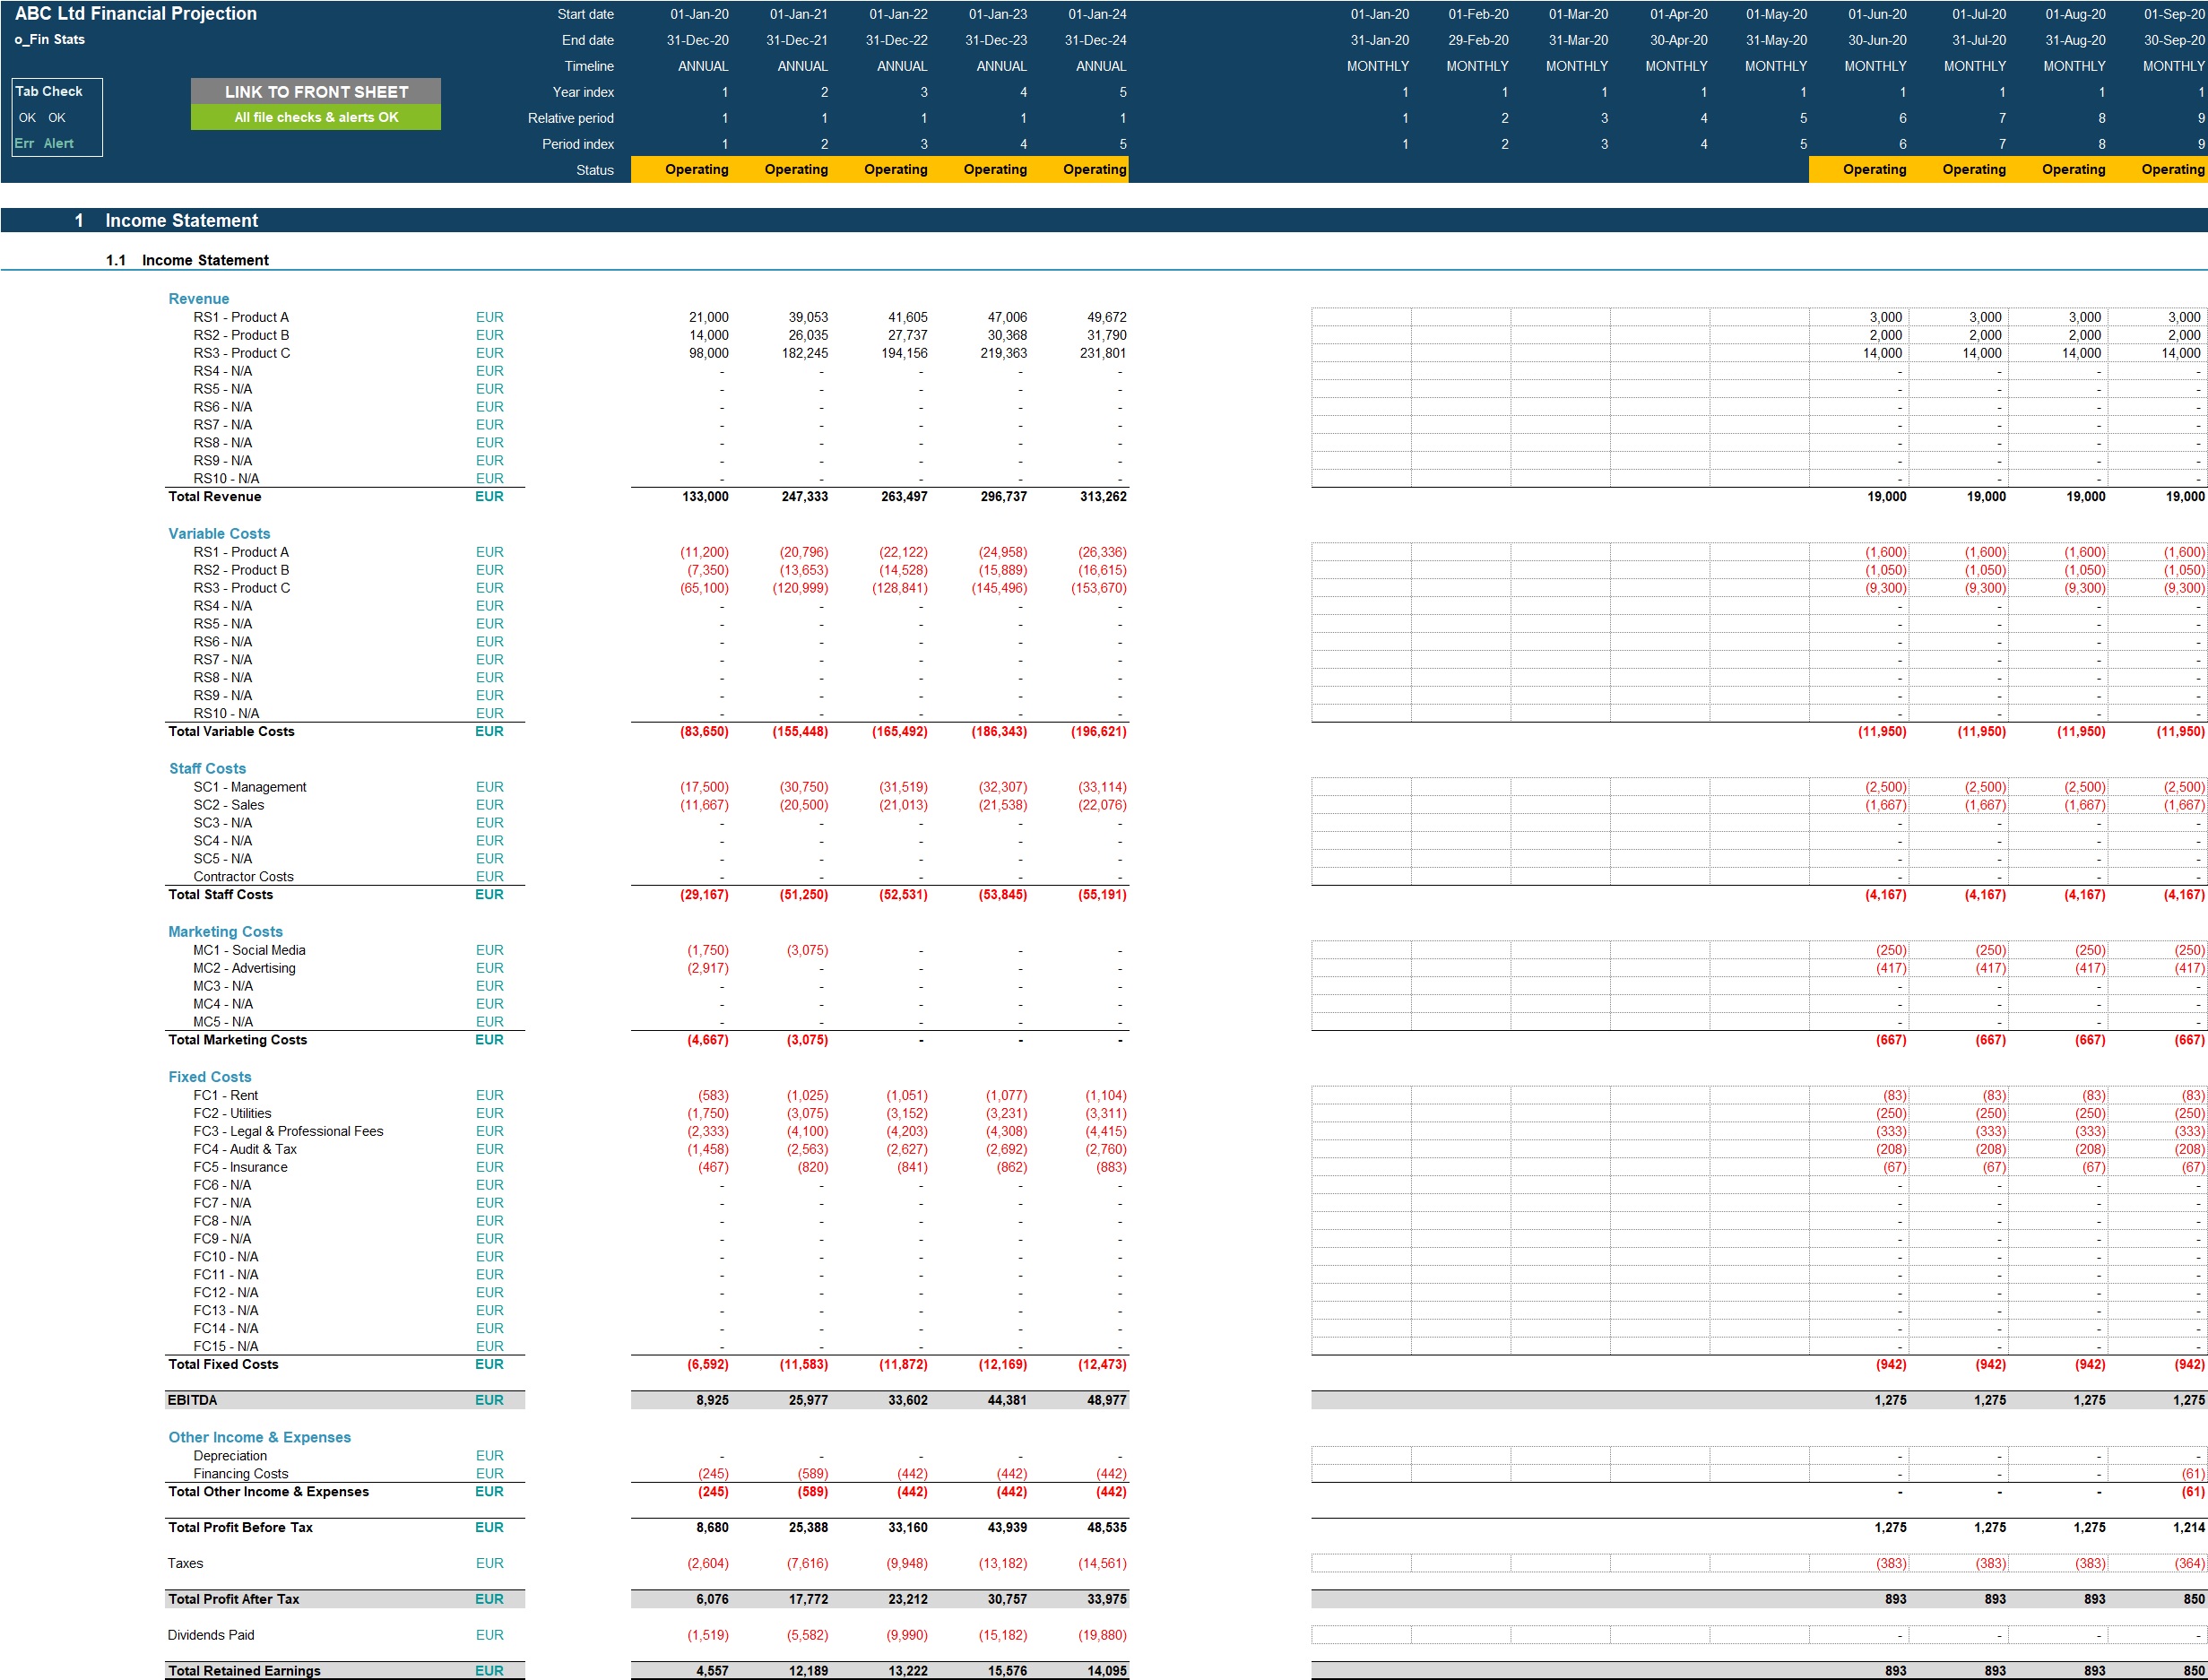
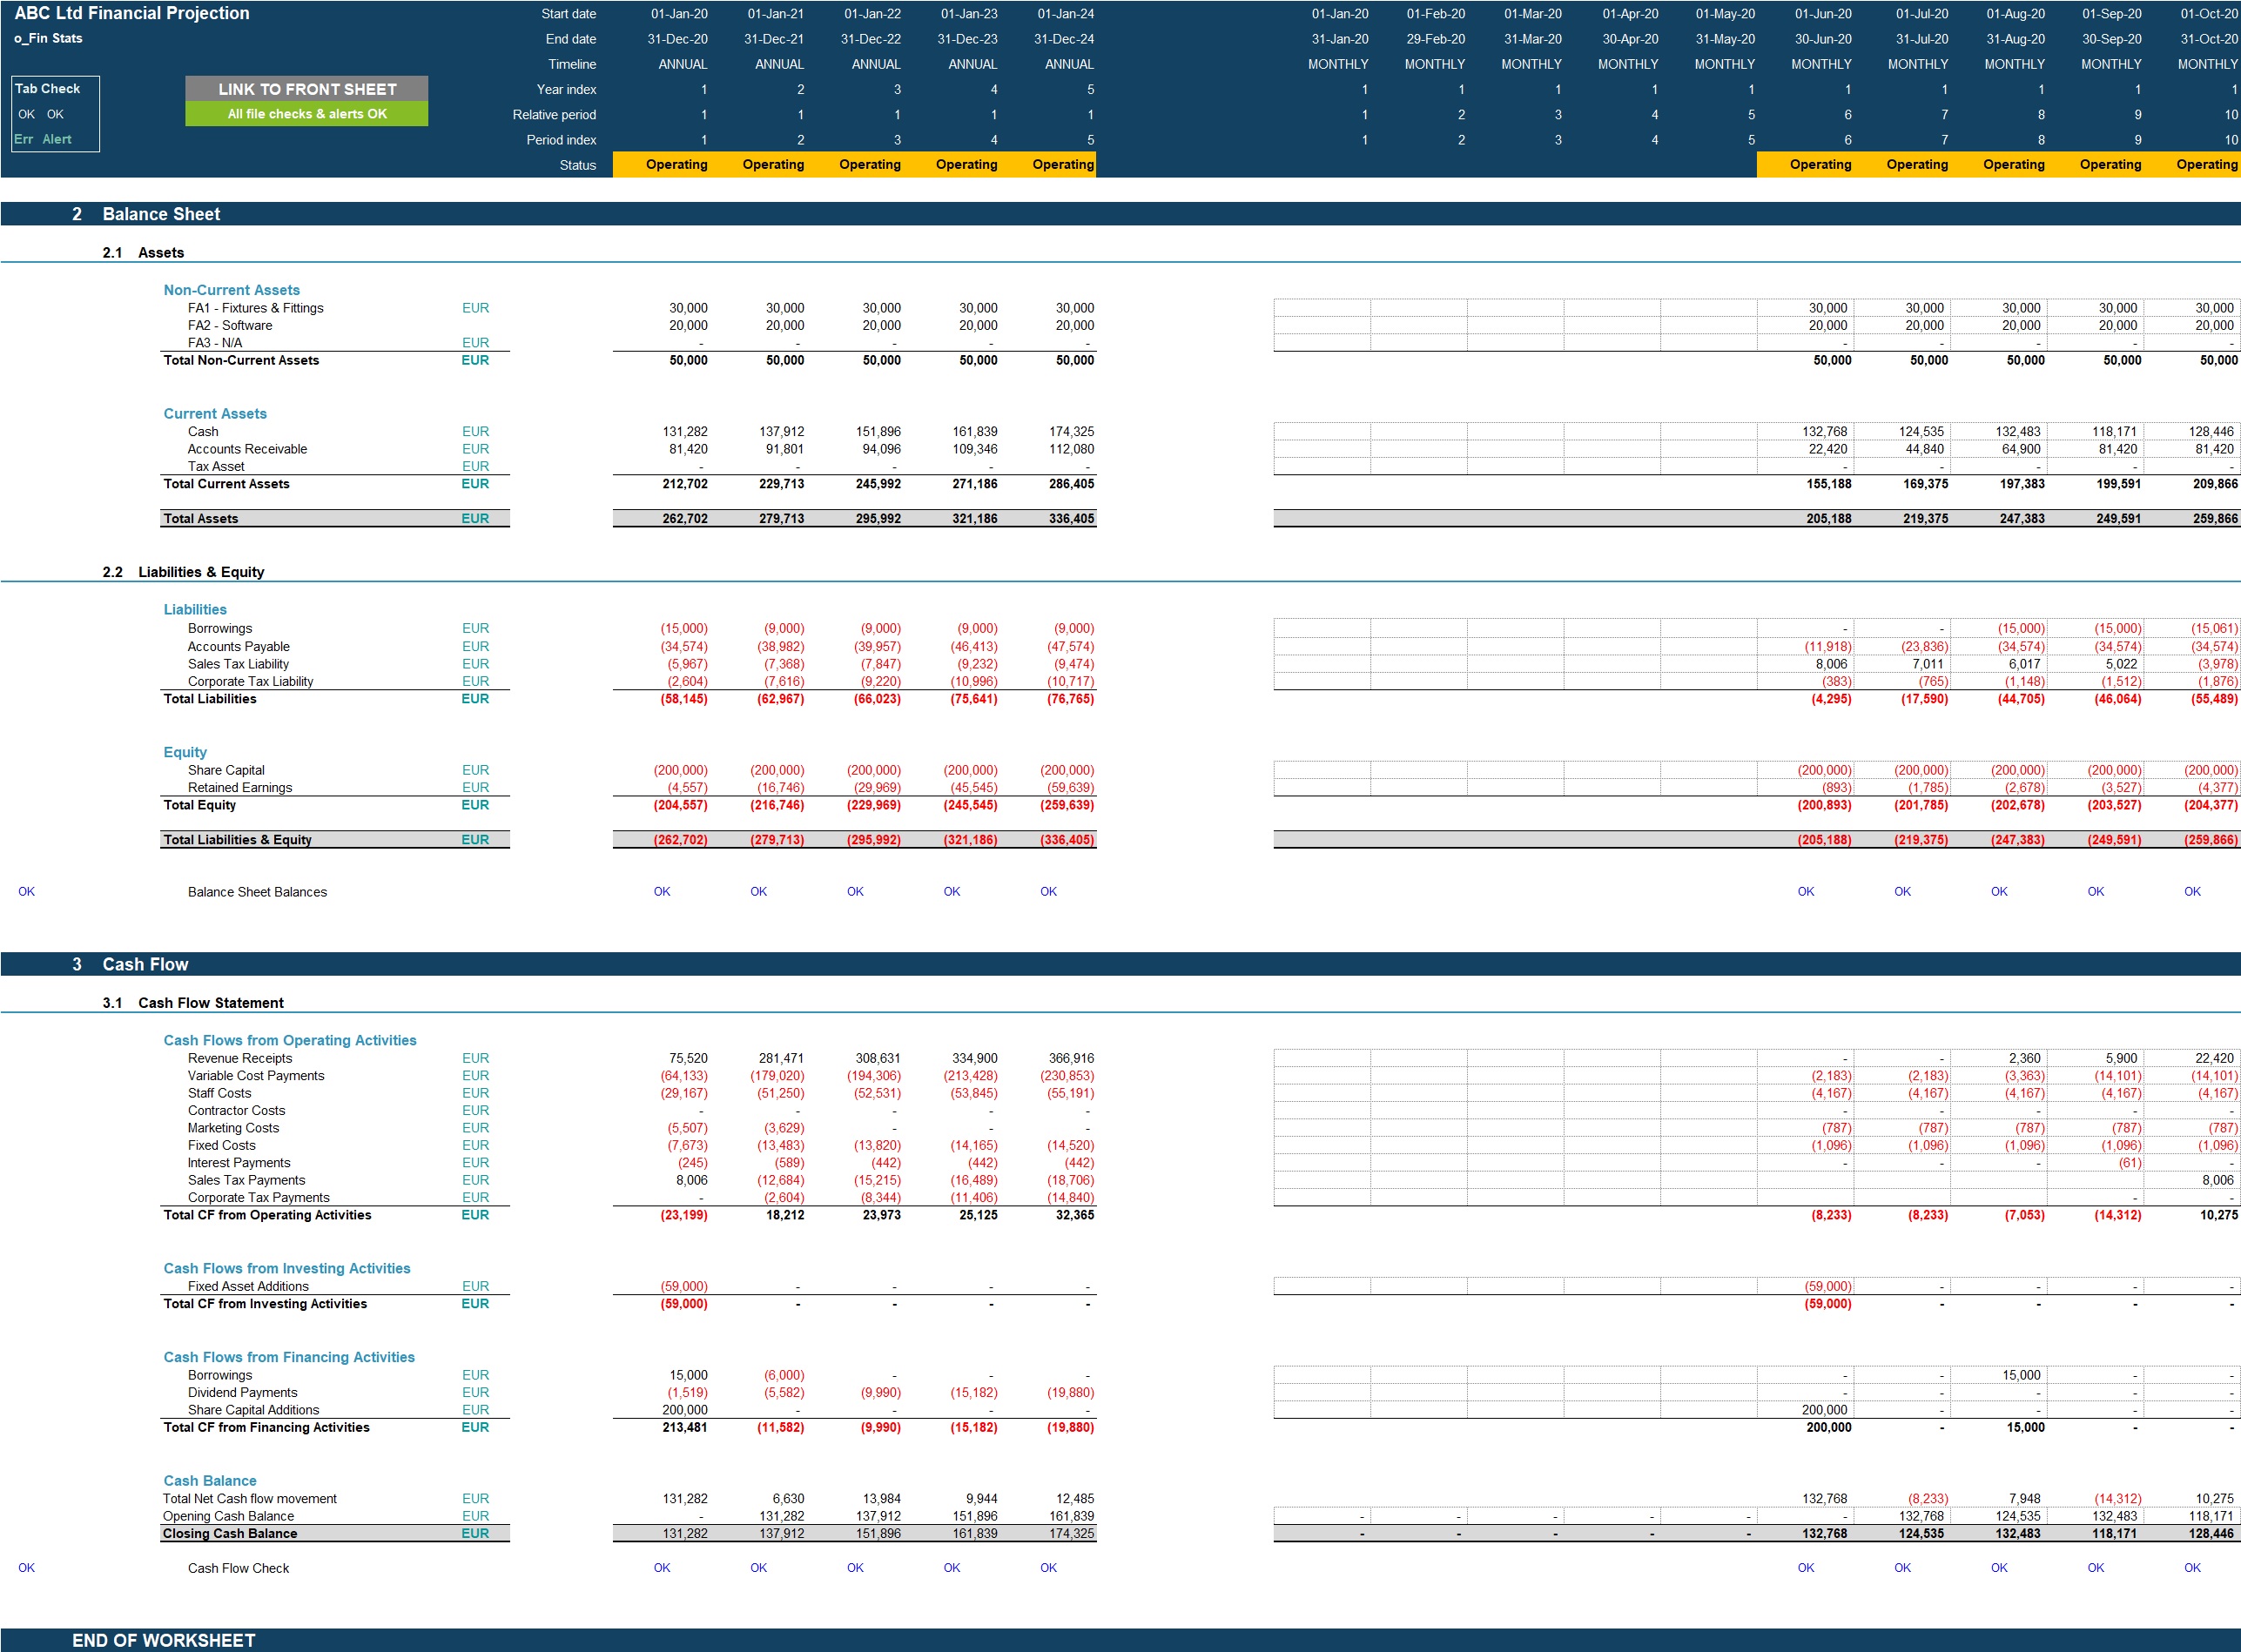
• Projected full financial statements (Income Statement, Balance Sheet and Cash flow Statement) on a monthly basis across 5 years and summarised on an annual basis
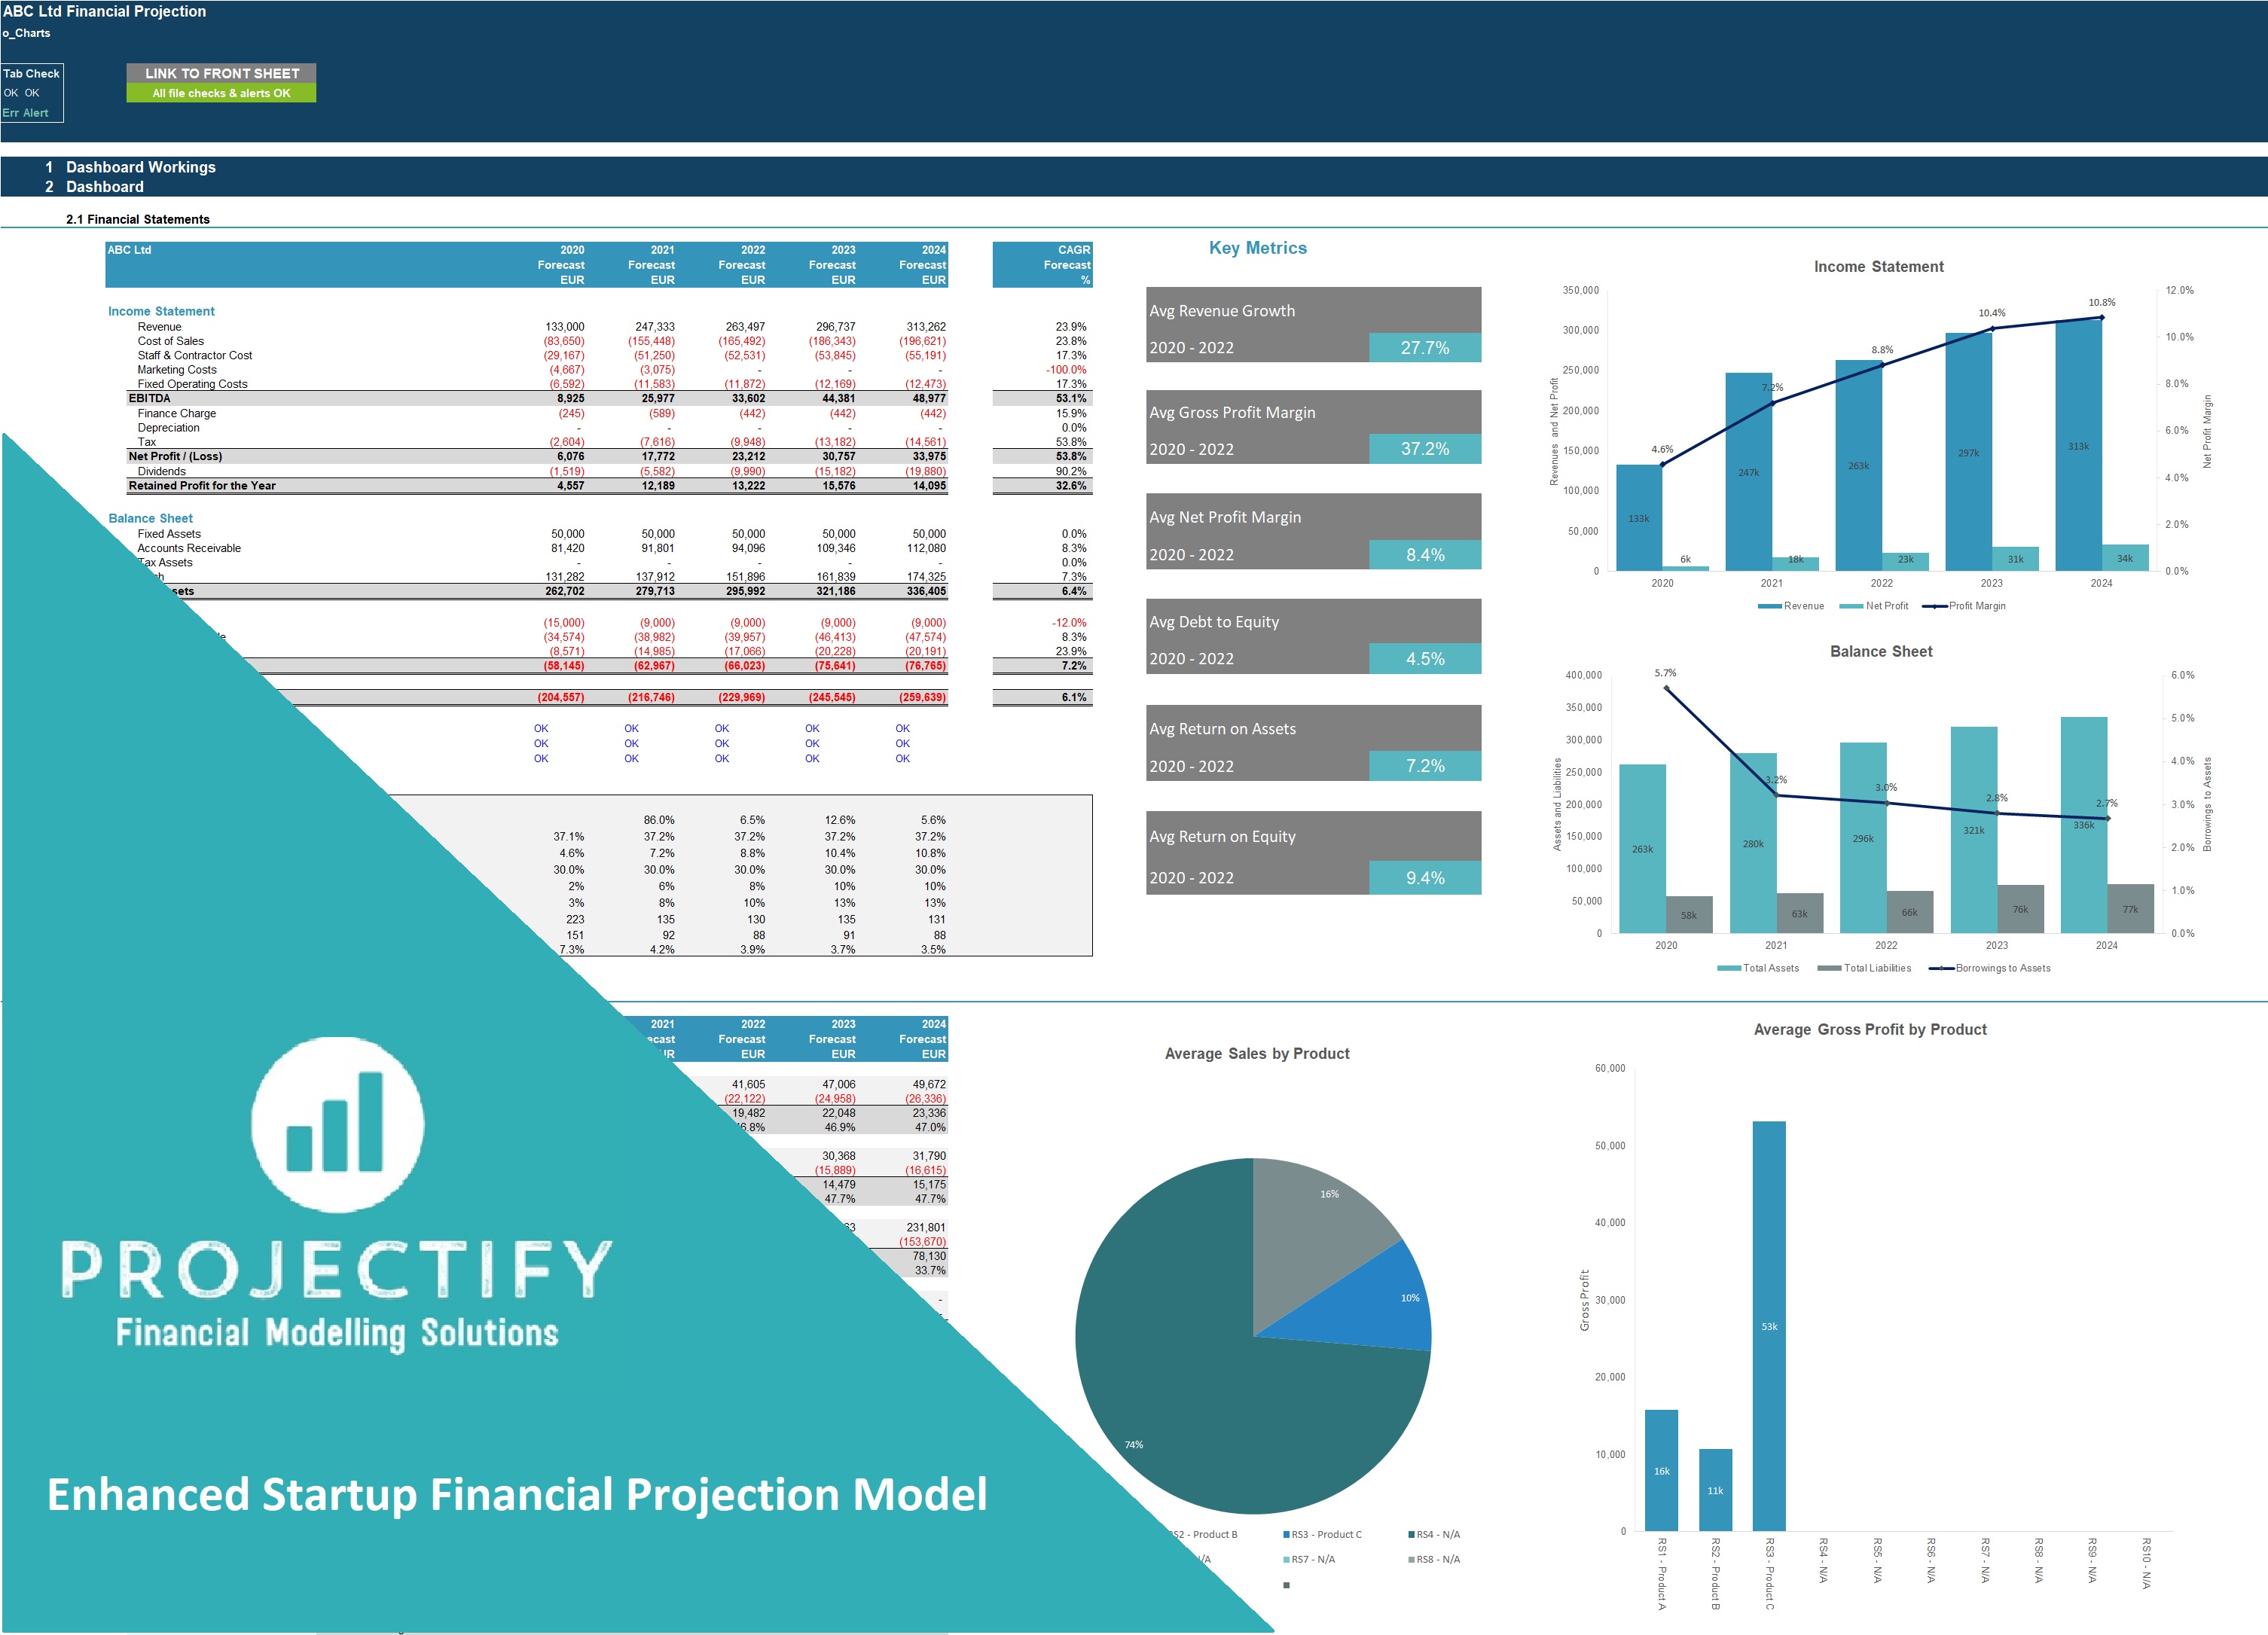
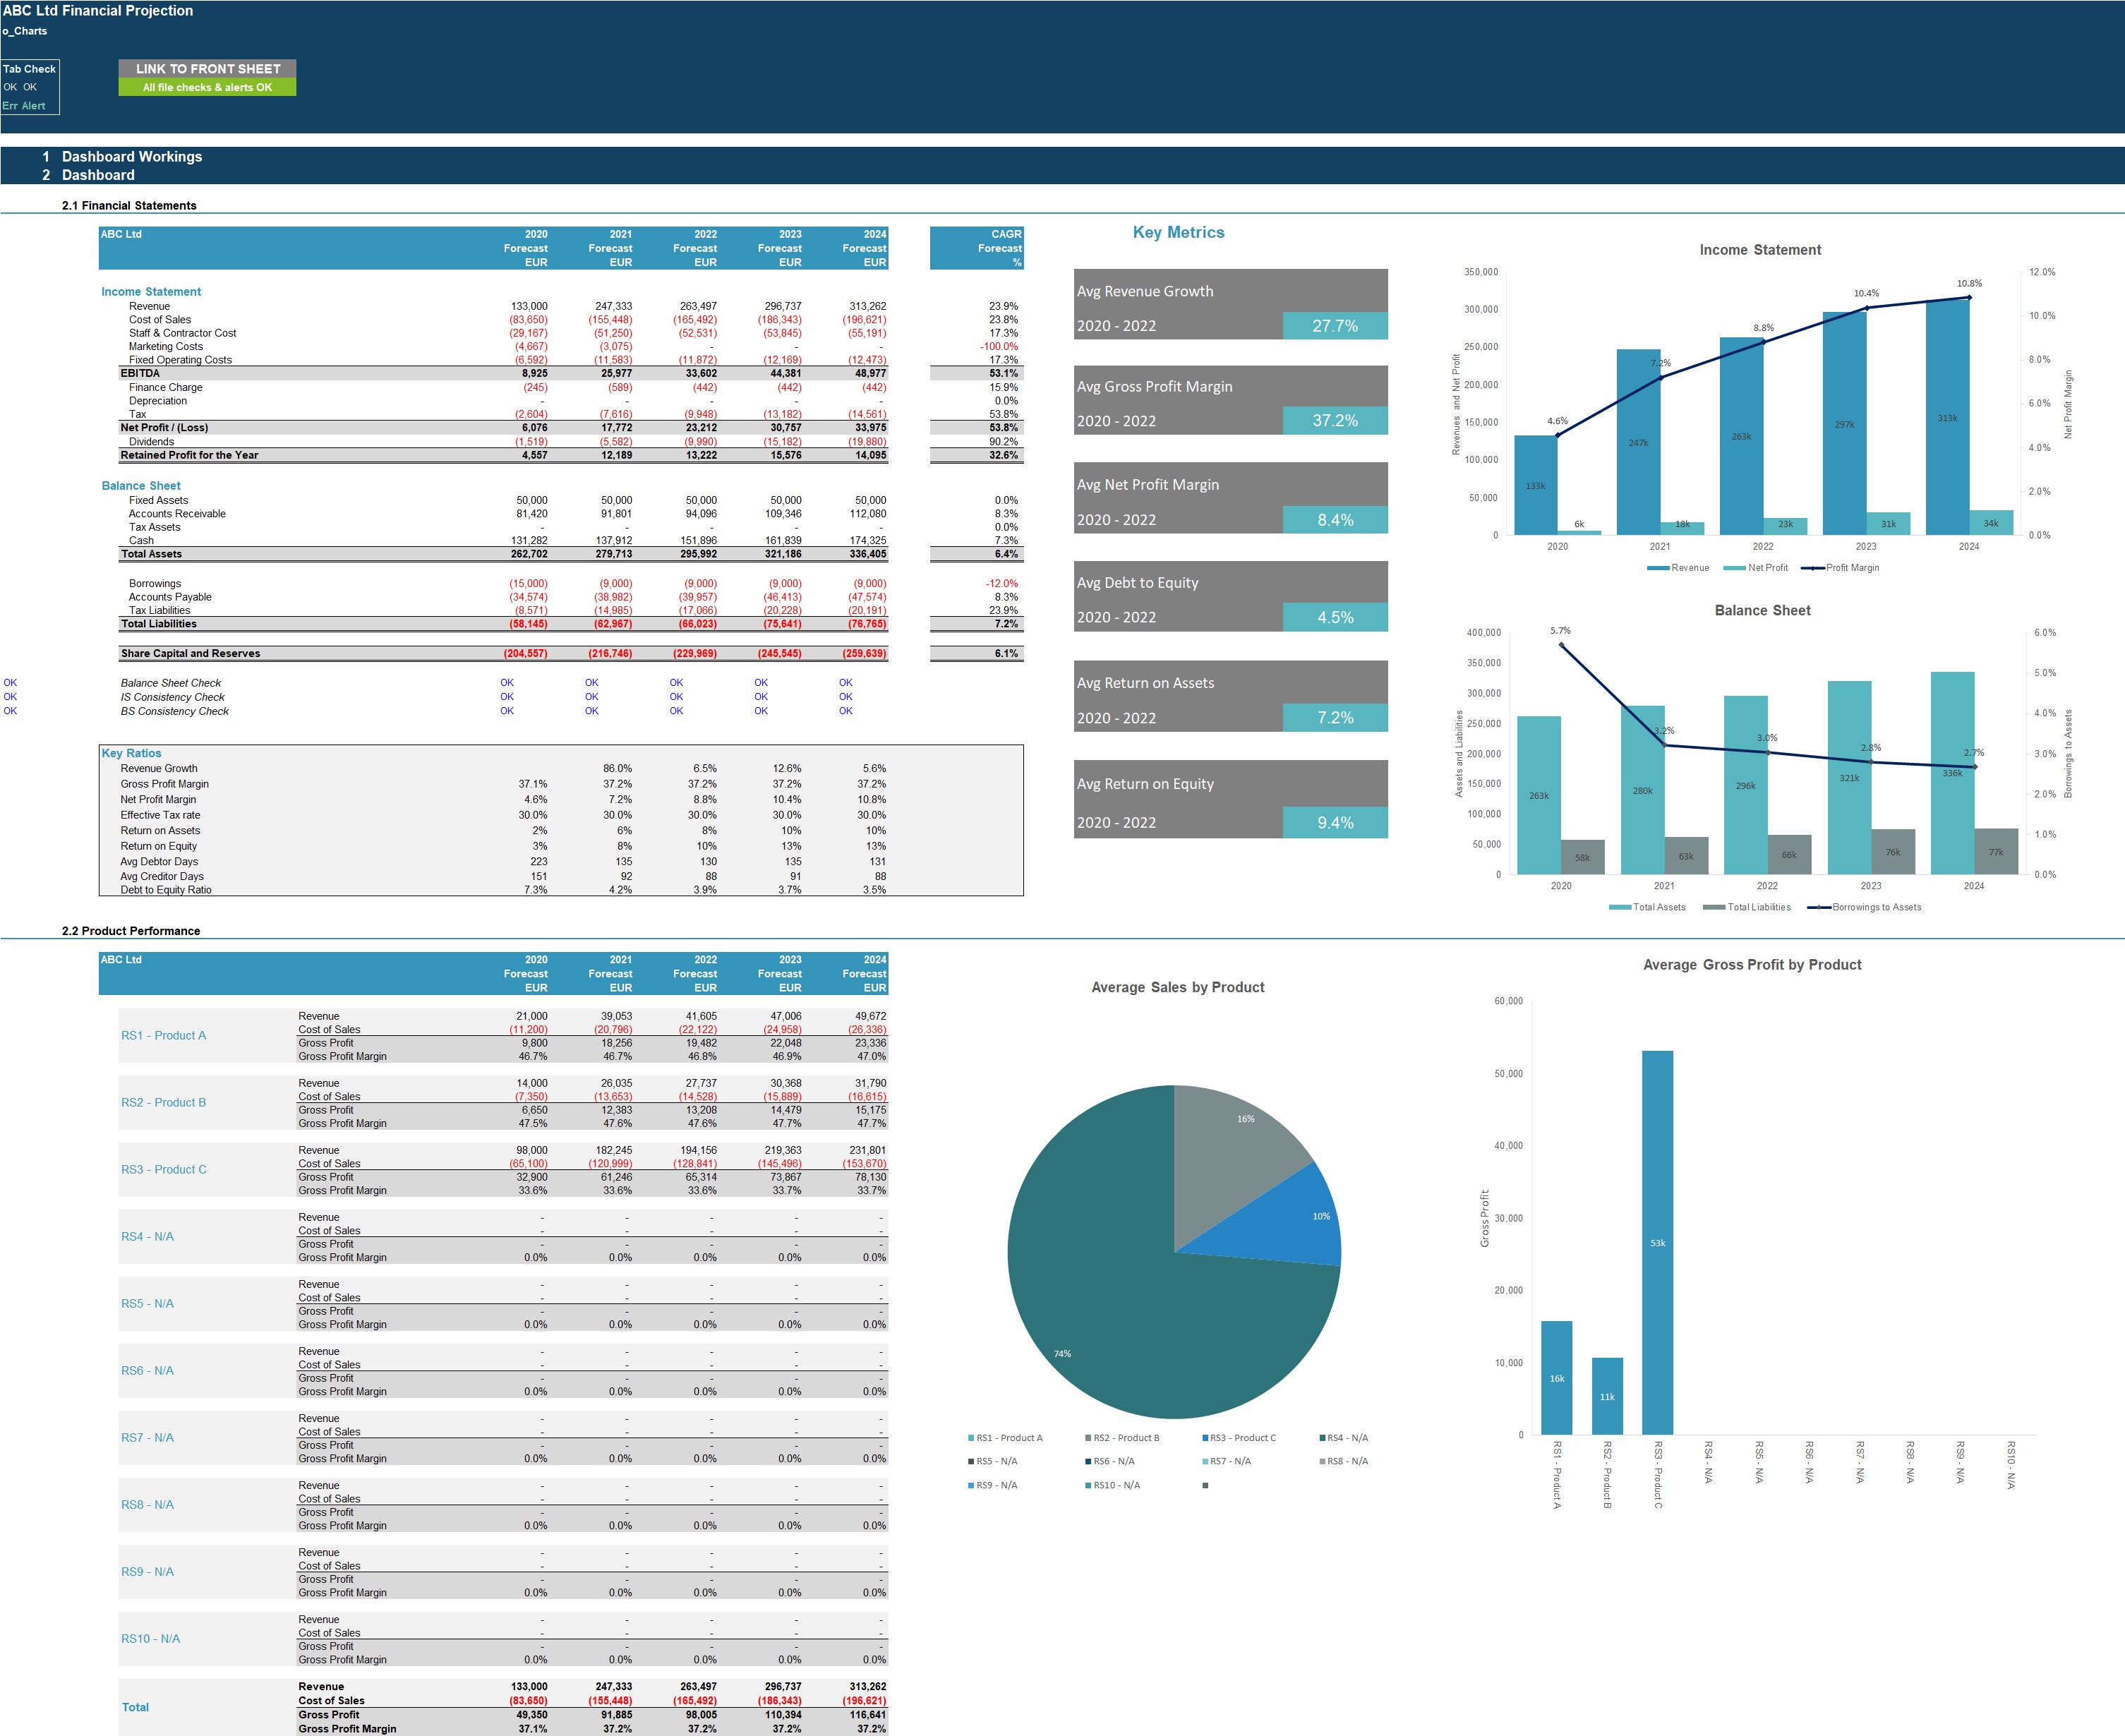
• Dashboard with
Summarised projected Income Statement and Balance Sheet
Compounded Annual Growth rate (CAGR) for each summarised income statement and Balance Sheet line item
List of key metrics including Average revenue growth, Average profit margins, Average return on assets and equity and Average Debt to Equity ratio.
Bar charts summarising income statement and Balance Sheet projections
Gross Profit margin by revenue stream in table and bar-chart format
KEY INPUTS
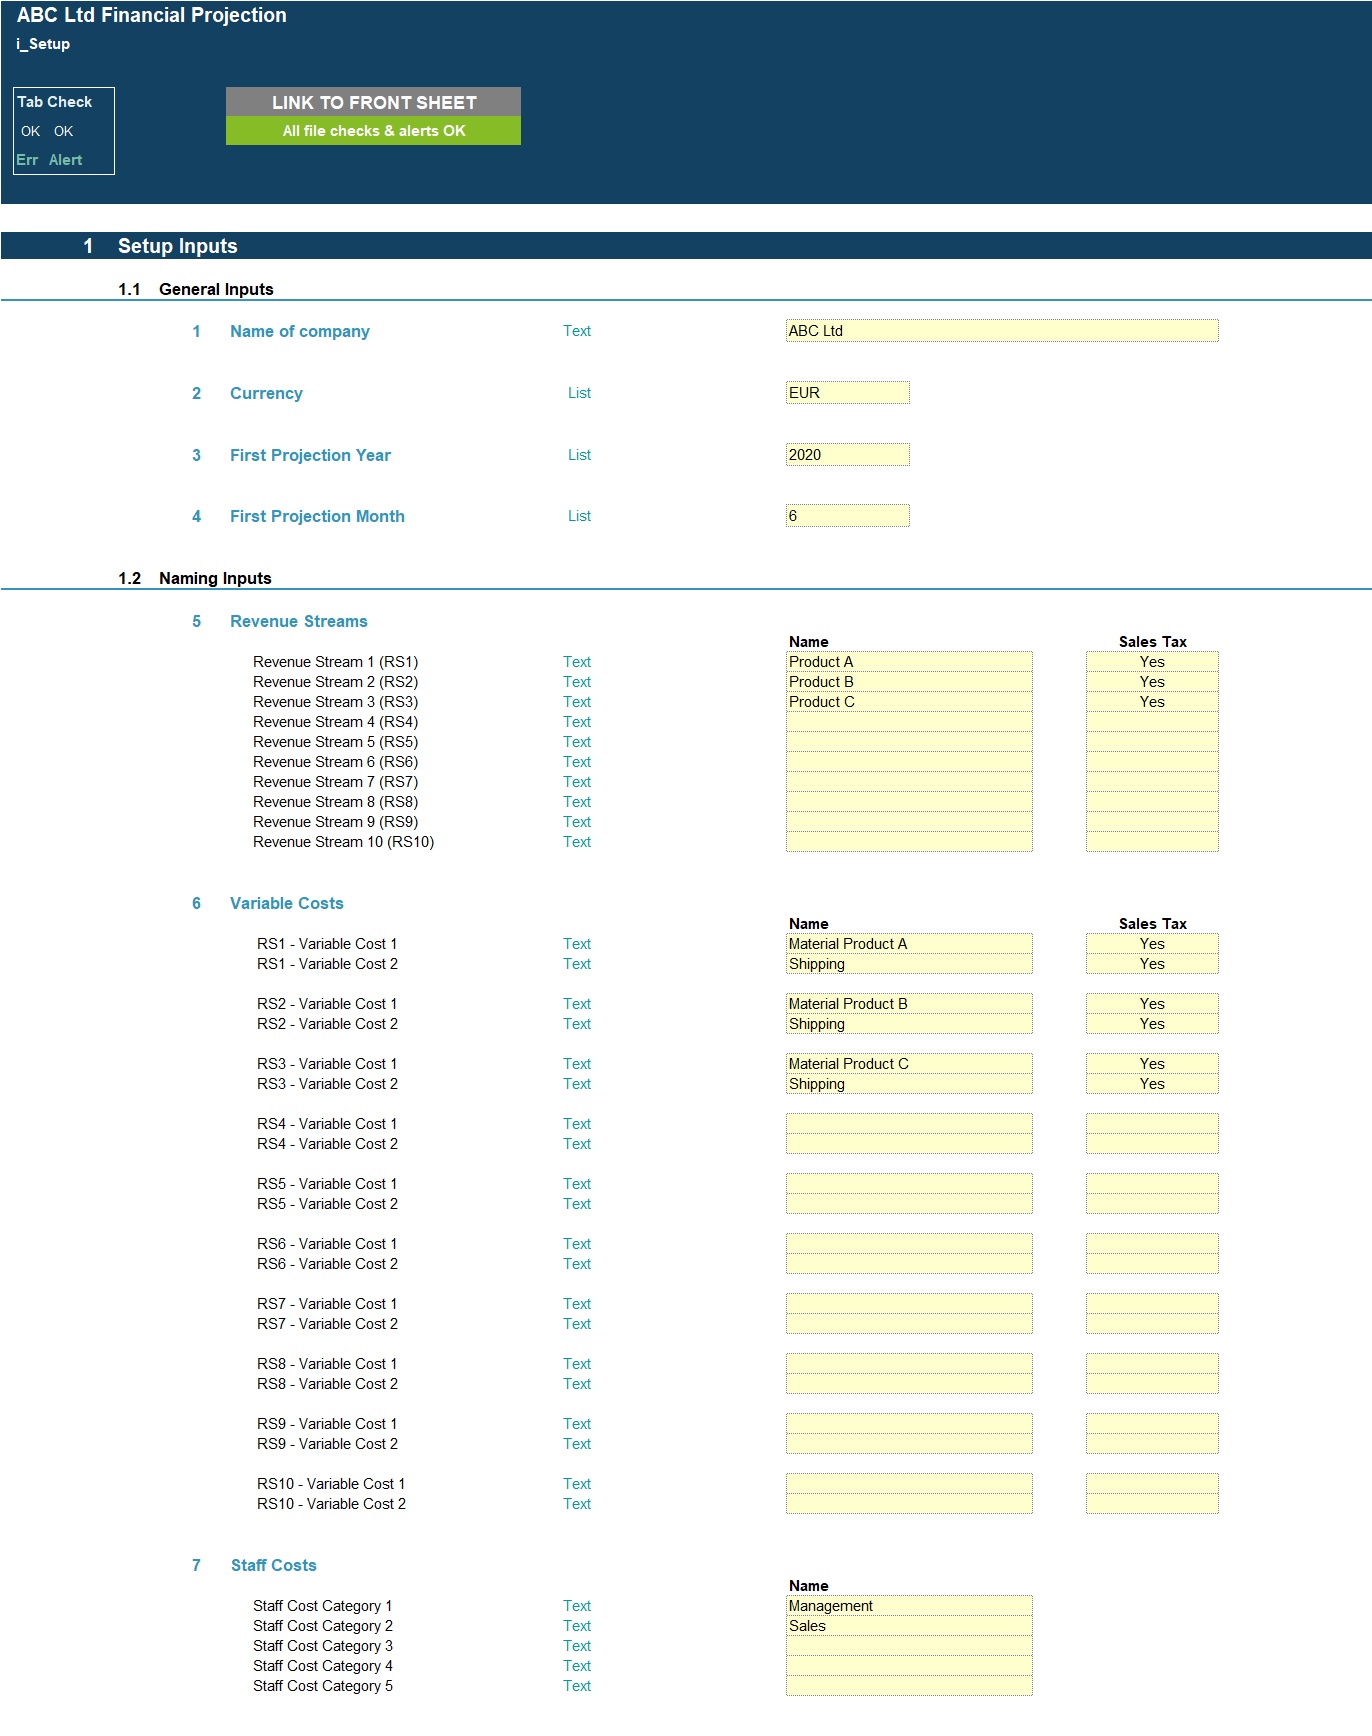
Inputs are split into Income Statement and Balance Sheet Inputs. All inputs include user-friendly line item explanations and input validations to help users understand what the input is for and populate correctly.
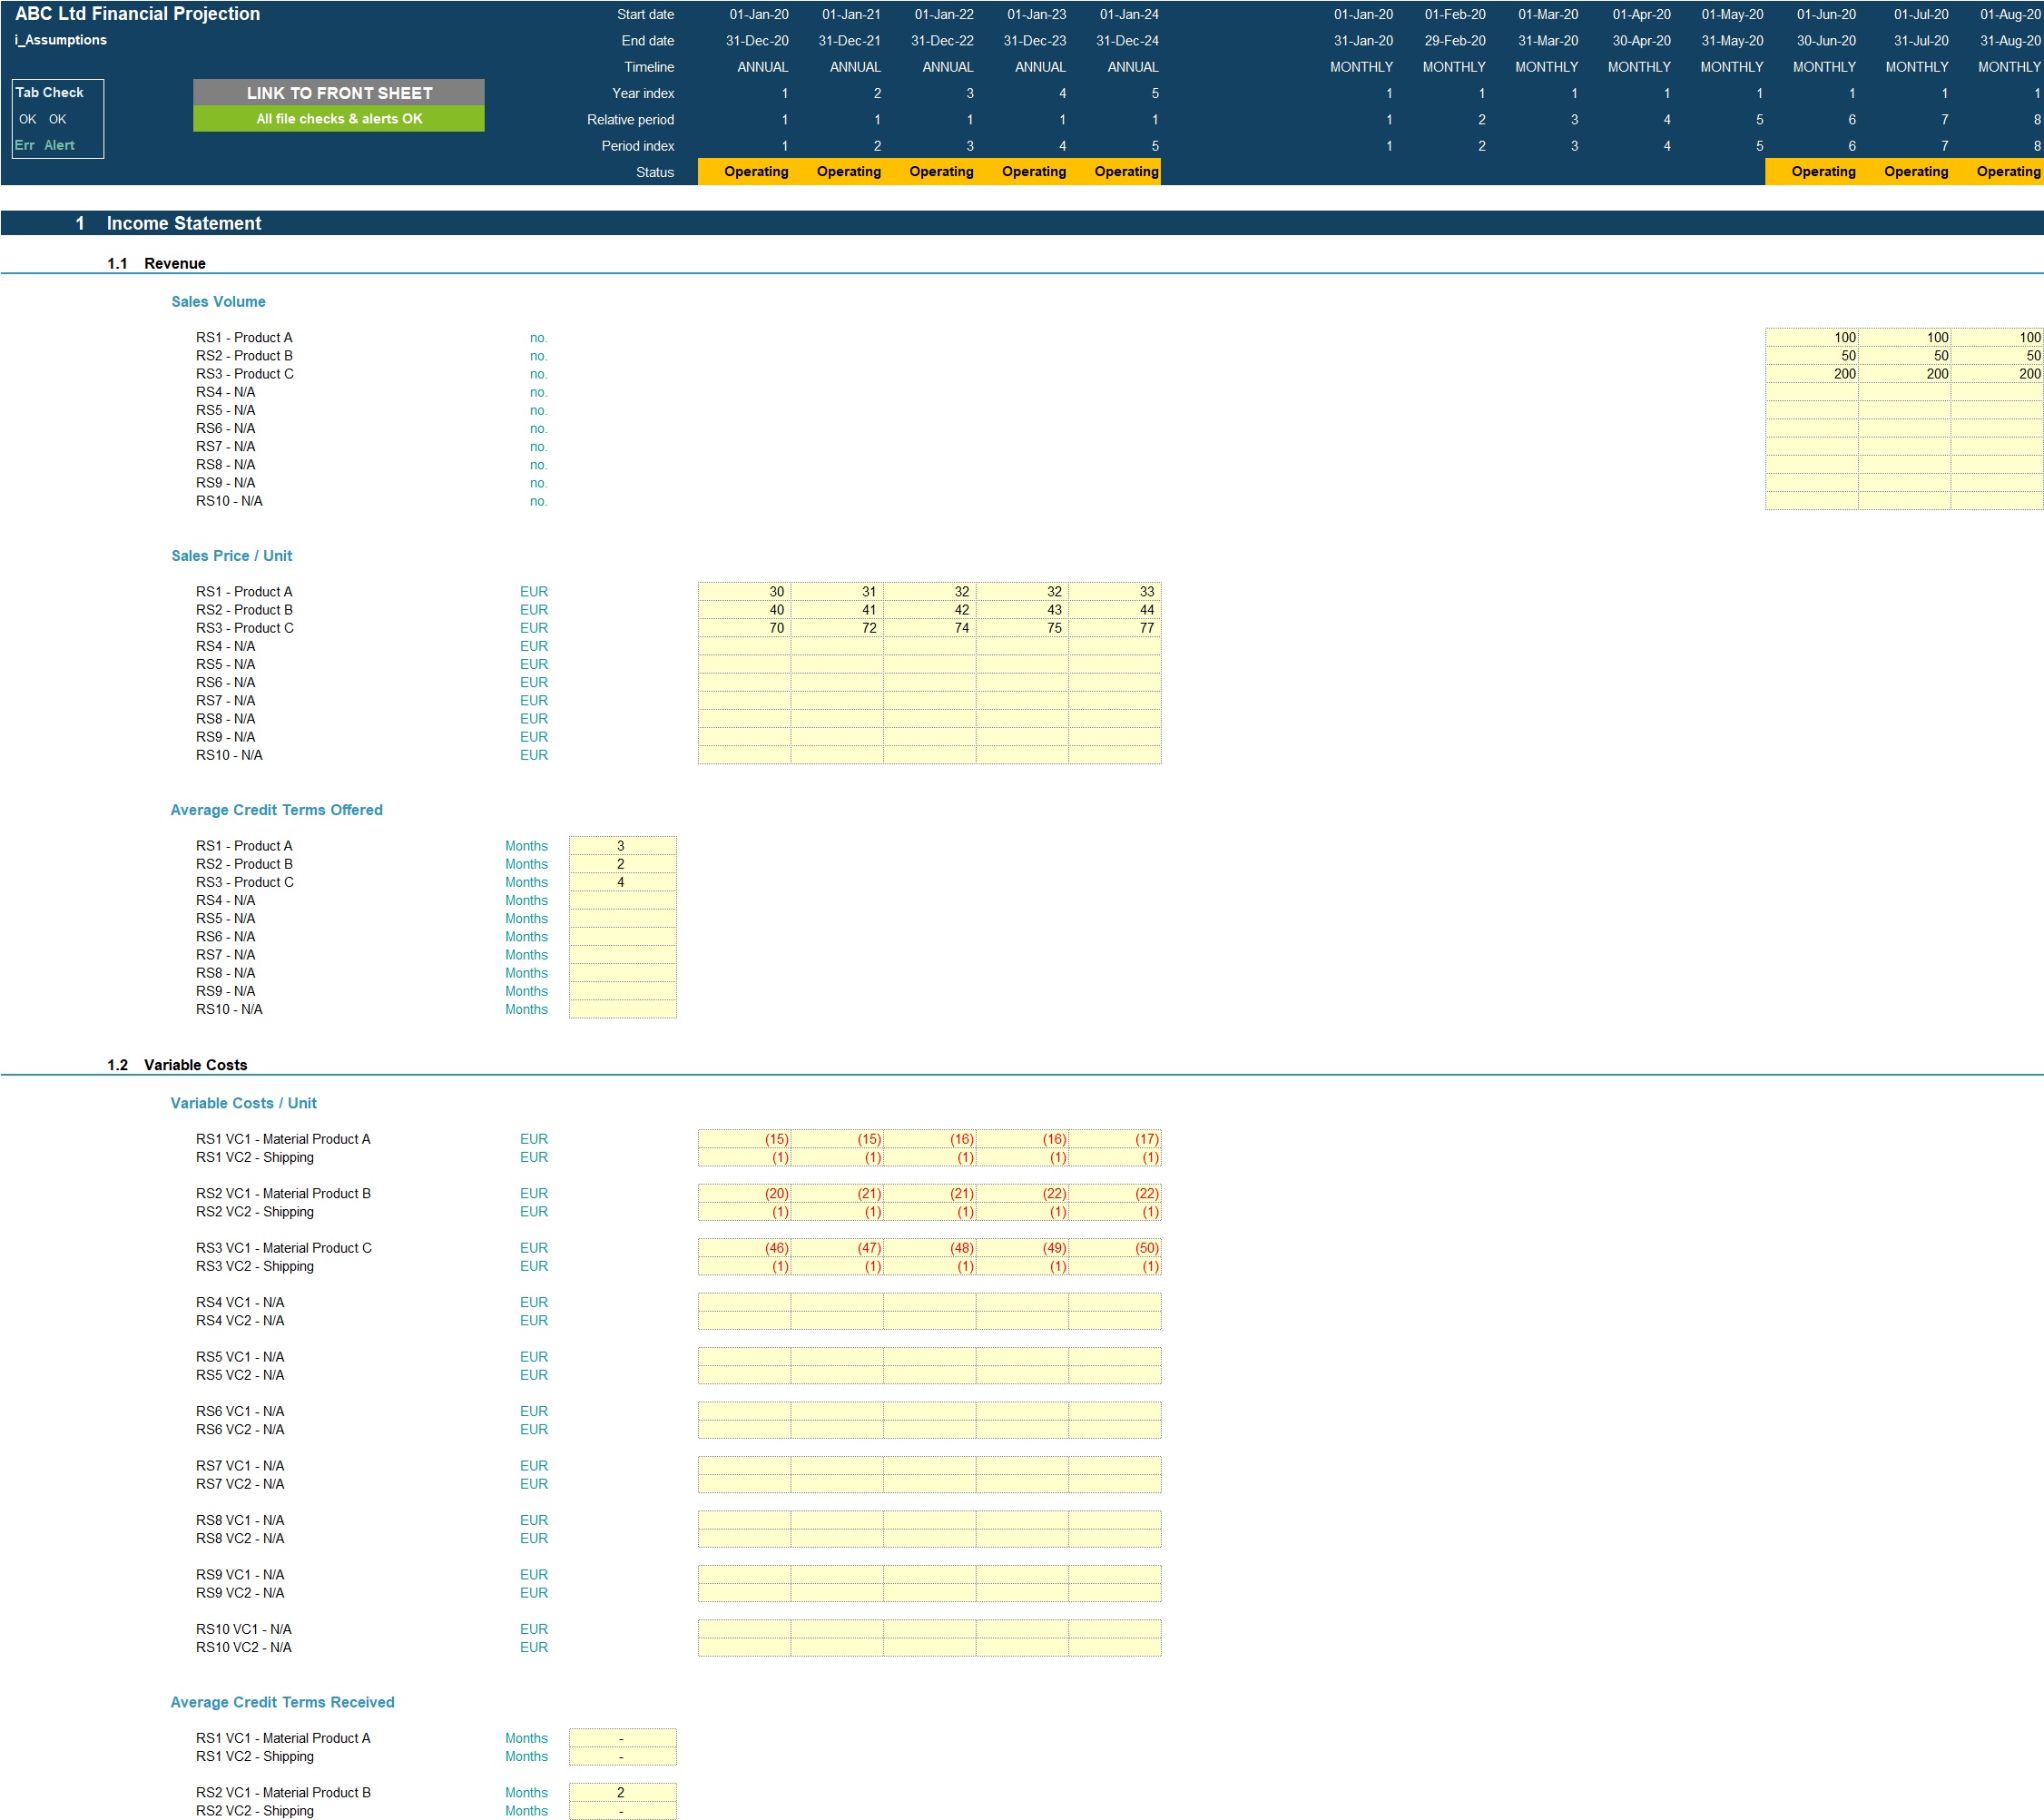
Income Statement inputs include:
• Revenue inputs including sales volume, sales prices and average credit terms offered;
• Variable cost inputs including variable cost per unit and average credit terms received;
• Other Costs including staff costs, marketing costs and fixed costs;
• Sales and Corporate tax inputs including rate and payment periods;
• Dividend inputs including amount or percentage of retained earnings and frequency;
Balance Sheet inputs include:
• Fixed Assets including addition amounts and useful life
• Borrowings including addition amounts and interest rate
• Share Capital including initial and subsequent equity investments
MODEL STRUCTURE
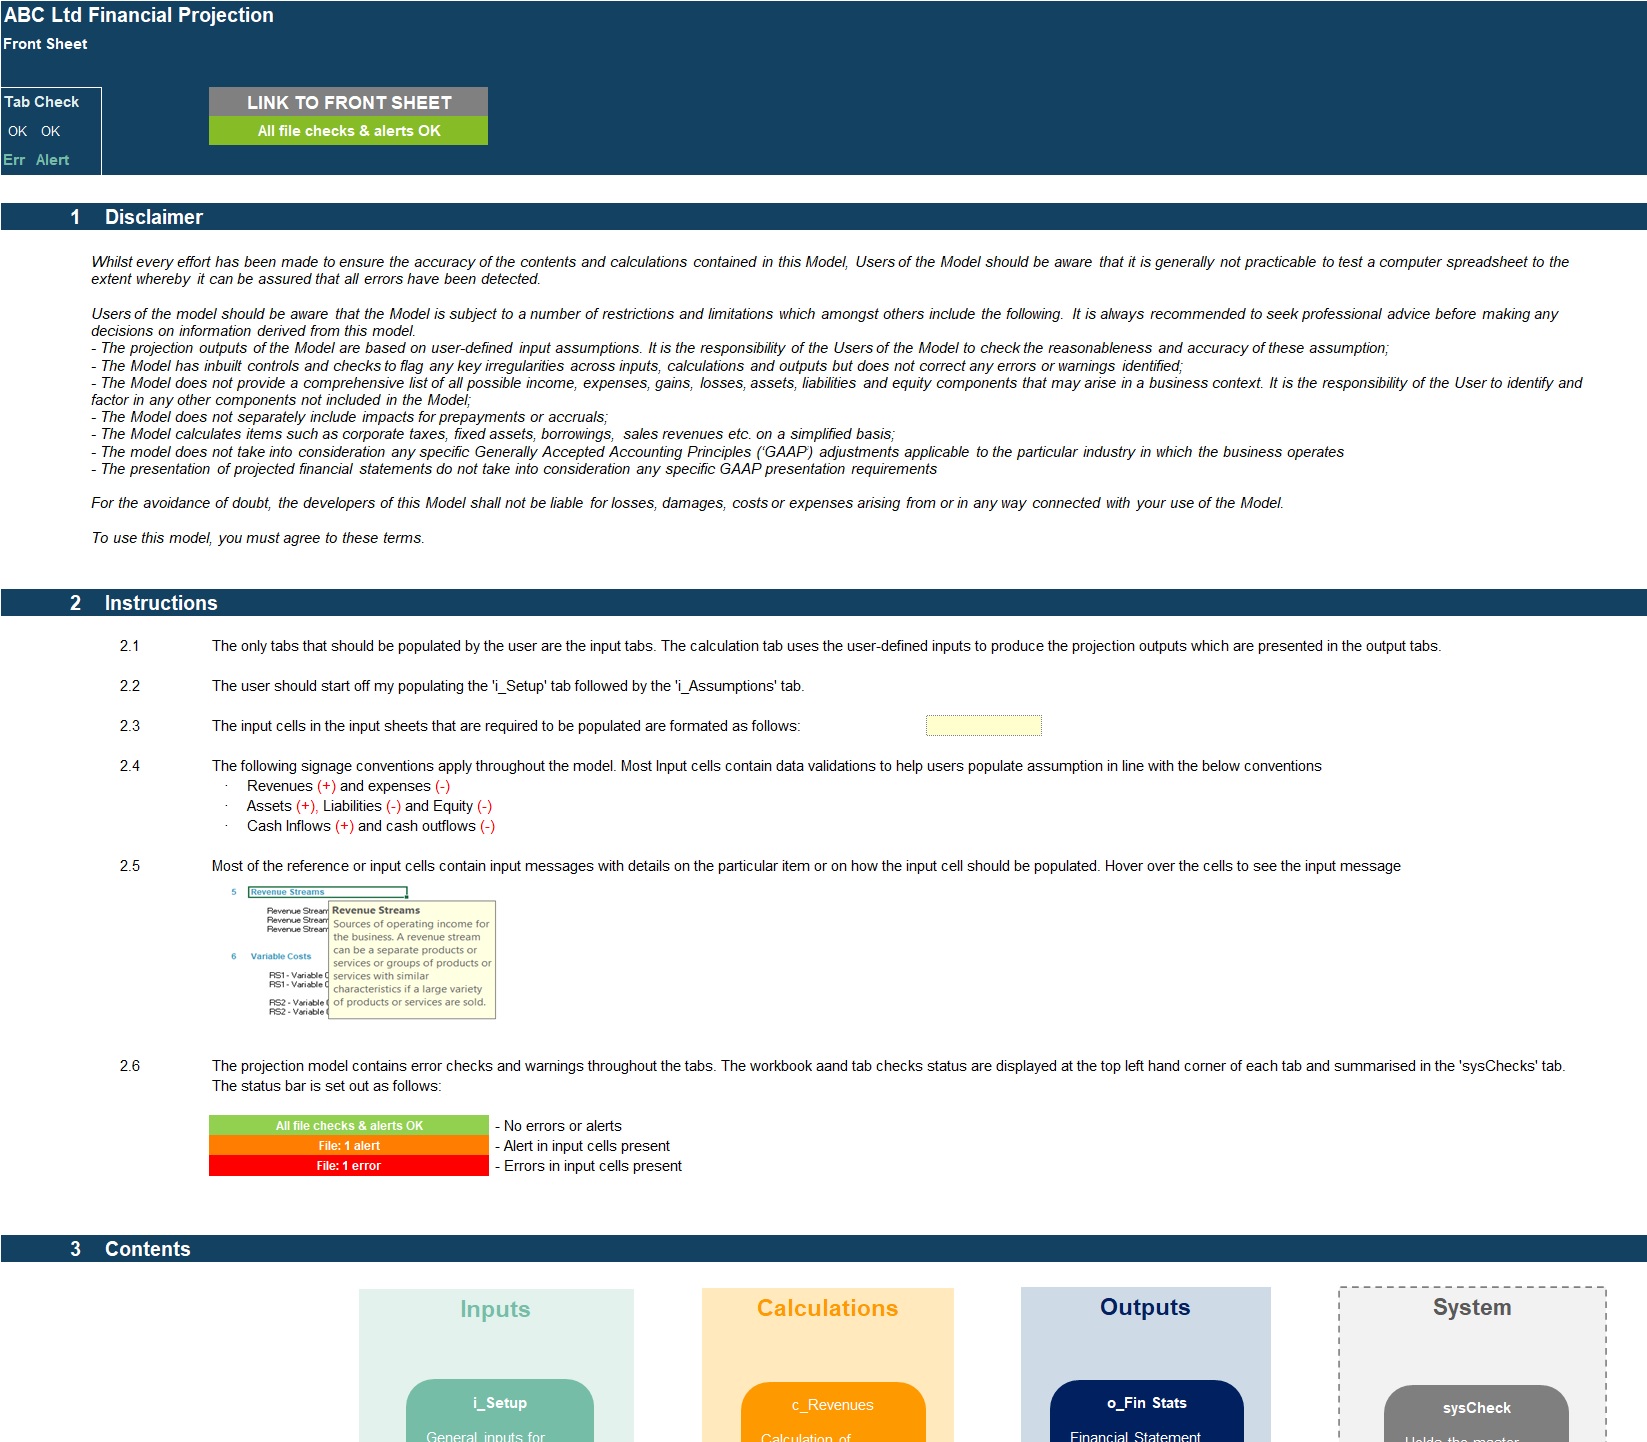
The model contains, 7 tabs split into input ('i_'), calculation ('c_'), output ('o_') and system tabs. The tabs to be populated by the user are the input tabs ('i_Setup' and 'i_Assumptions'). The calculation tab use the user-defined inputs to calculate and produce the projection outputs which are presented in 'o_Fin Stats' and ‘o_Charts'
System tabs include:
• A 'Front Sheet' containing a disclaimer, instructions and contents;
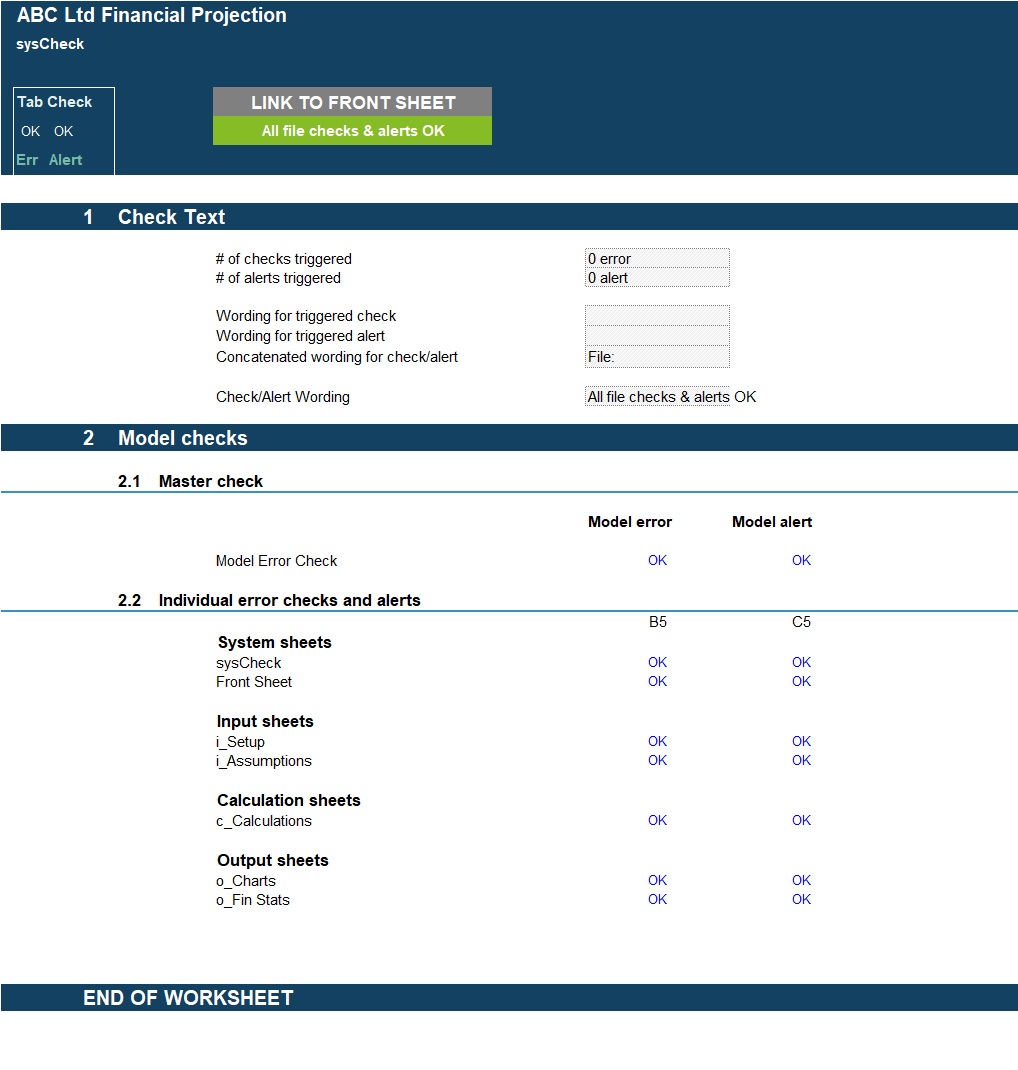
• A Checks dashboard containing a summary of checks by tab.
KEY FEATURES
Other key features of this model include the following:
• The model follows best practice financial modelling guidelines and includes instructions, line item explanations, checks and input validations;
• The model allows for a 5-year projection on a monthly basis and summarised on an annual basis;
• The model is not password protected and can be modified as required following download;
• The model is screened using specialised model audit software to help ensure formula consistency and significantly reduce risk of errors;
• – The model allows for the following number of underlying categories for each line item (these can be easily expanded if required):
Revenue – 10 categories;
Variable costs – 2 per revenue category;
Staff costs – 5 categories;
Marketing costs – 5 categories;
Other expenses – 15 categories;
Fixed Assets – 3 categories;
Borrowings – 1 facility;
• Costs are split into: variable, fixed, staff and marking costs for better driver-based forecasting;
• Apart from projecting revenue and costs the tool includes the possibility to model receivables and payables, fixed assets, borrowings, dividends, sales tax and corporate tax;
• Business Name, currency, starting projection period are fully customisable
• Revenue, Cost and Fixed Asset descriptions are fully customisable;
• The model includes the possibility to start mid-way through the first projection year;
• The model includes instructions, line item explanations, checks and input validations to help ensure input fields are populated accurately;
• The model includes a checks dashboard which summarises all the checks included in the various tabs making it easier to identify any errors.
Got a question about the product? Email us at support@flevy.com or ask the author directly by using the "Ask the Author a Question" form. If you cannot view the preview above this document description, go here to view the large preview instead.
Source: Best Practices in Entrepreneurship, Integrated Financial Model Excel: Enhanced Generic Startup Financial Projection 3 Statement Model Excel (XLSX) Spreadsheet, Projectify
ABOUT THE AUTHOR
We are financial modelling professionals, accountants and CFA charterholders with experience working within Deloitte supporting clients with their financial planning and decision support needs. Our aim is to provide robust and easy-to-use financial models that follow good practice financial modelling guidelines and assist individuals and businesses with key financial planning and analysis ... [read more]
Ask the Author a Question
You must be logged in to contact the author.
