 Click main image to view in full screen.
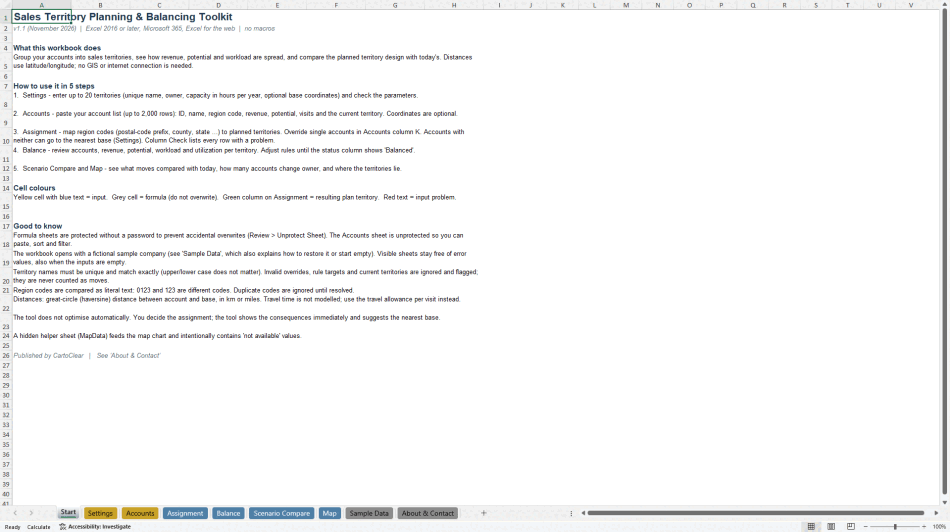
Sales Territory Planning & Balancing Toolkit – Excel XLSX
Excel (XLSX) + supplemental PDF


BENEFITS OF THIS DOWNLOADABLE EXCEL DOCUMENT
- Shows how revenue, potential and workload are spread across up to 20 sales territories, so imbalances become visible before territory changes are decided.
- Compares a planned territory design with the current one and reports how many accounts and how much revenue would change owner.
- Runs in standard Excel without macros, add-ins or GIS software and includes a simple map drawn from latitude and longitude.
SALES MANAGEMENT EXCEL DESCRIPTION
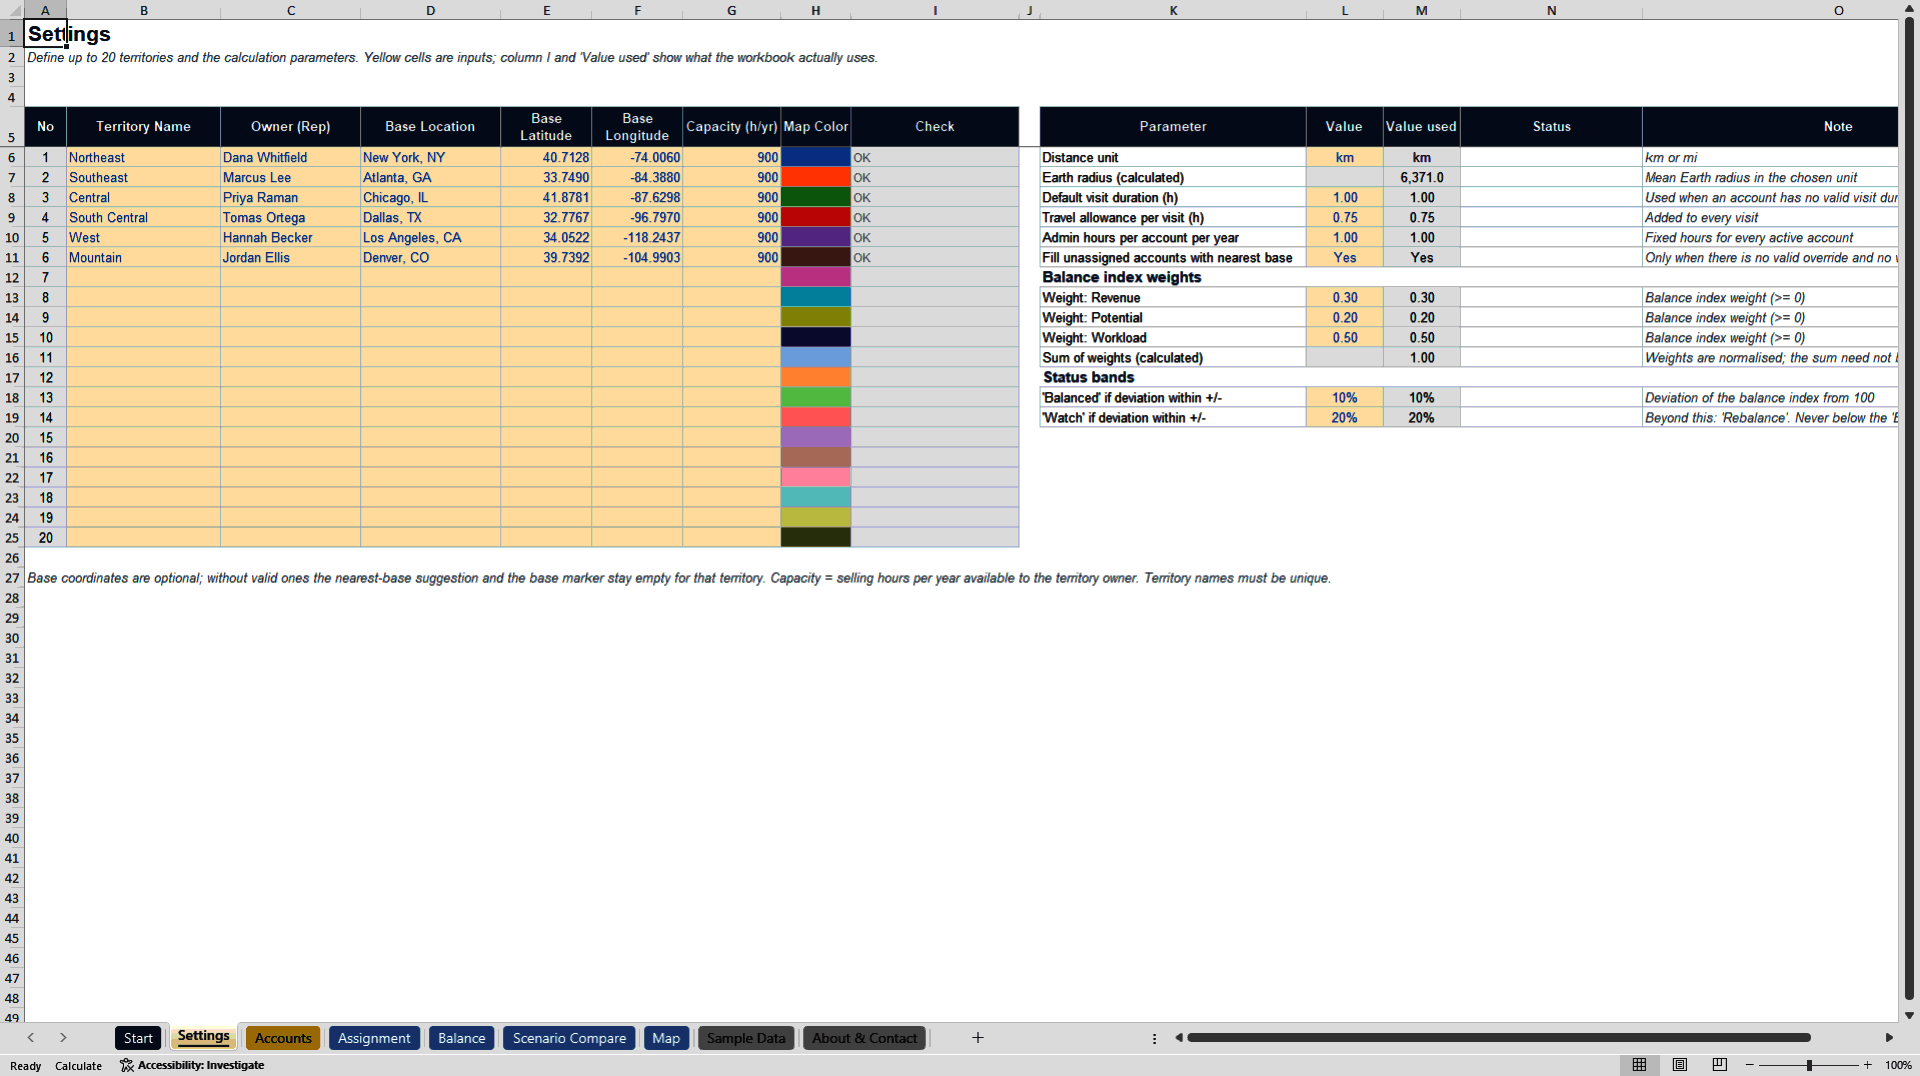
Territory design decides how much time each salesperson can spend with the right customers. When territories grow historically, some reps end up with more accounts and travel than they can handle while others have room to spare. This Excel toolkit helps sales leaders, sales-operations teams and consultants make territory decisions on the basis of data rather than habit.
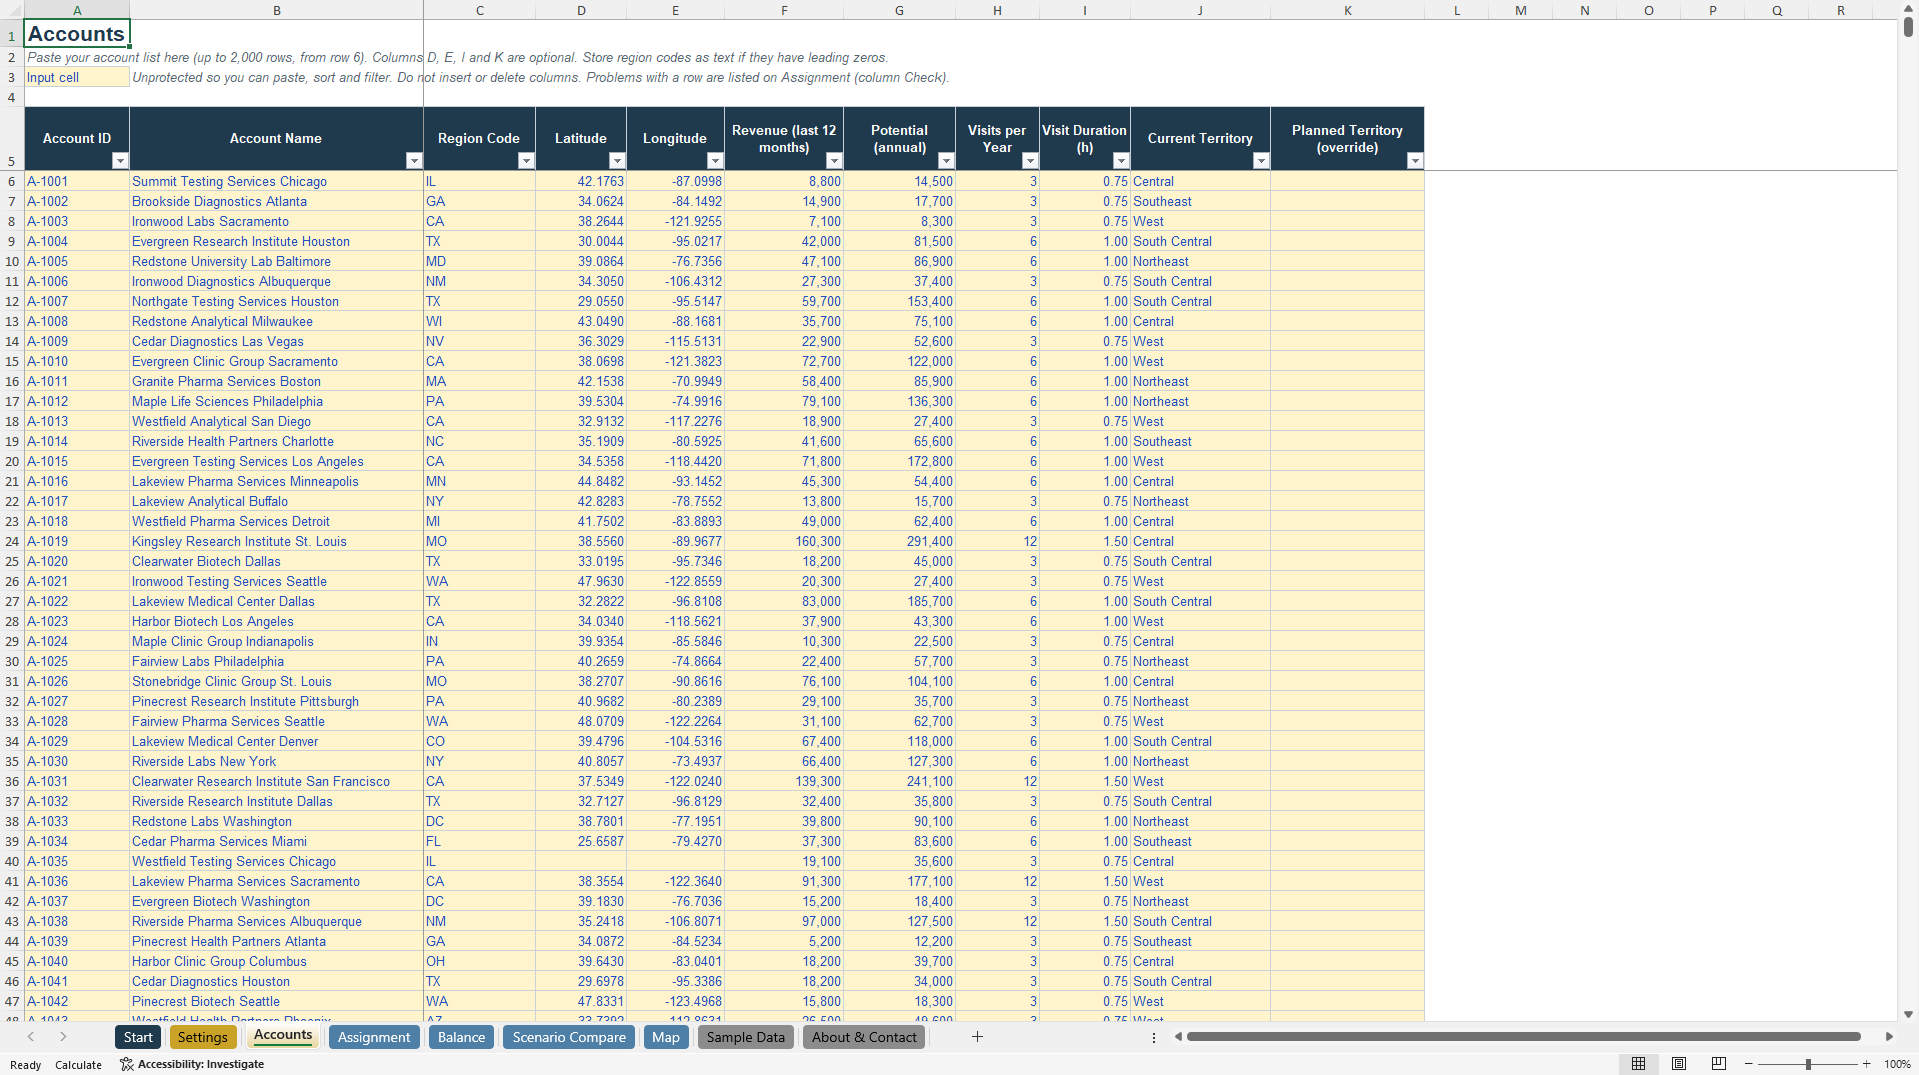
The workbook takes an ordinary account list: an ID or name, a region code, revenue and, ideally, potential and visit frequency. The region code is free text, so postal-code prefixes, counties, states or internal sales districts can be used; codes are compared as literal text, so codes with leading zeros should be stored as text. Latitude and longitude are optional. The toolkit handles up to 2,000 accounts and up to 20 territories.
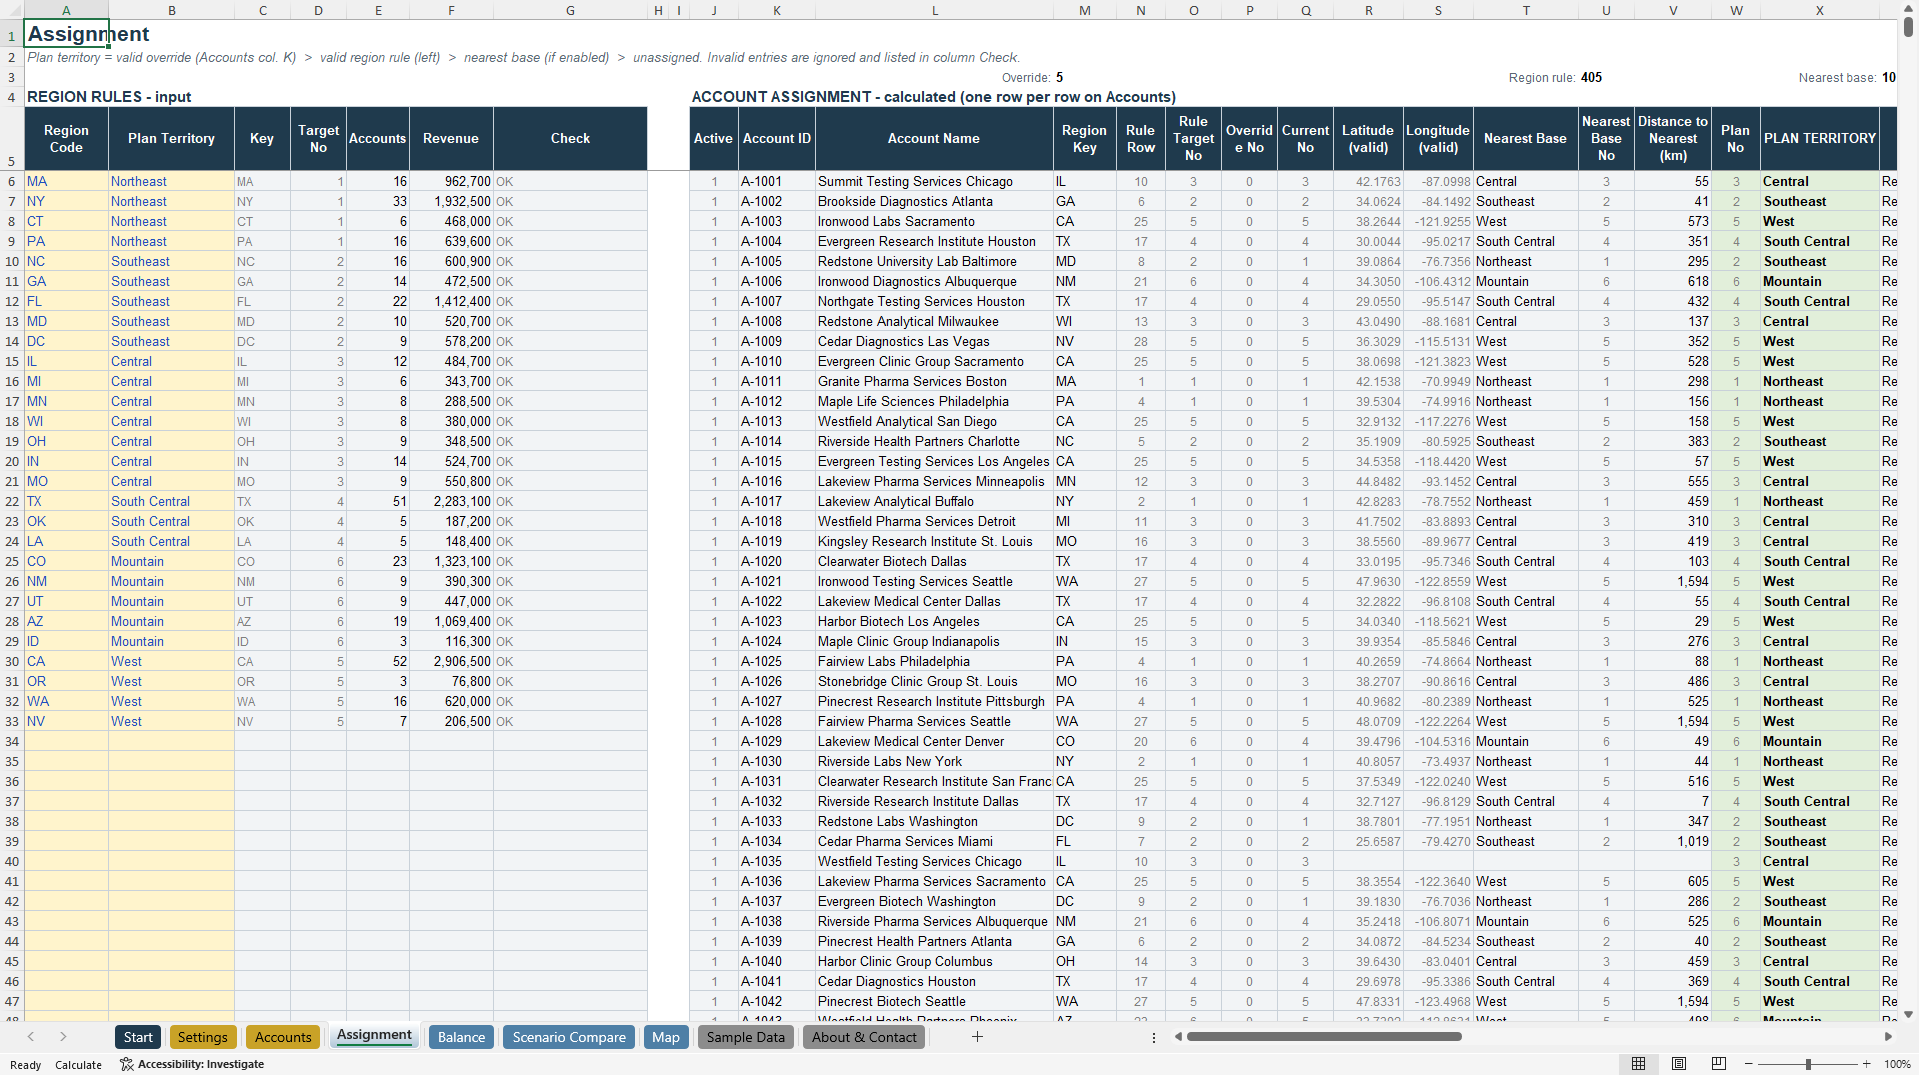
Accounts are assigned in a clear order. A single account can be pinned to a territory, region codes can be mapped to territories in a rules table, and accounts without either can be given to the nearest territory base. The nearest base is found with the great-circle (haversine) distance between account and base coordinates. Entries that do not match a defined territory, duplicate region codes and non-numeric values are not used; they are listed in a check column so they can be corrected.
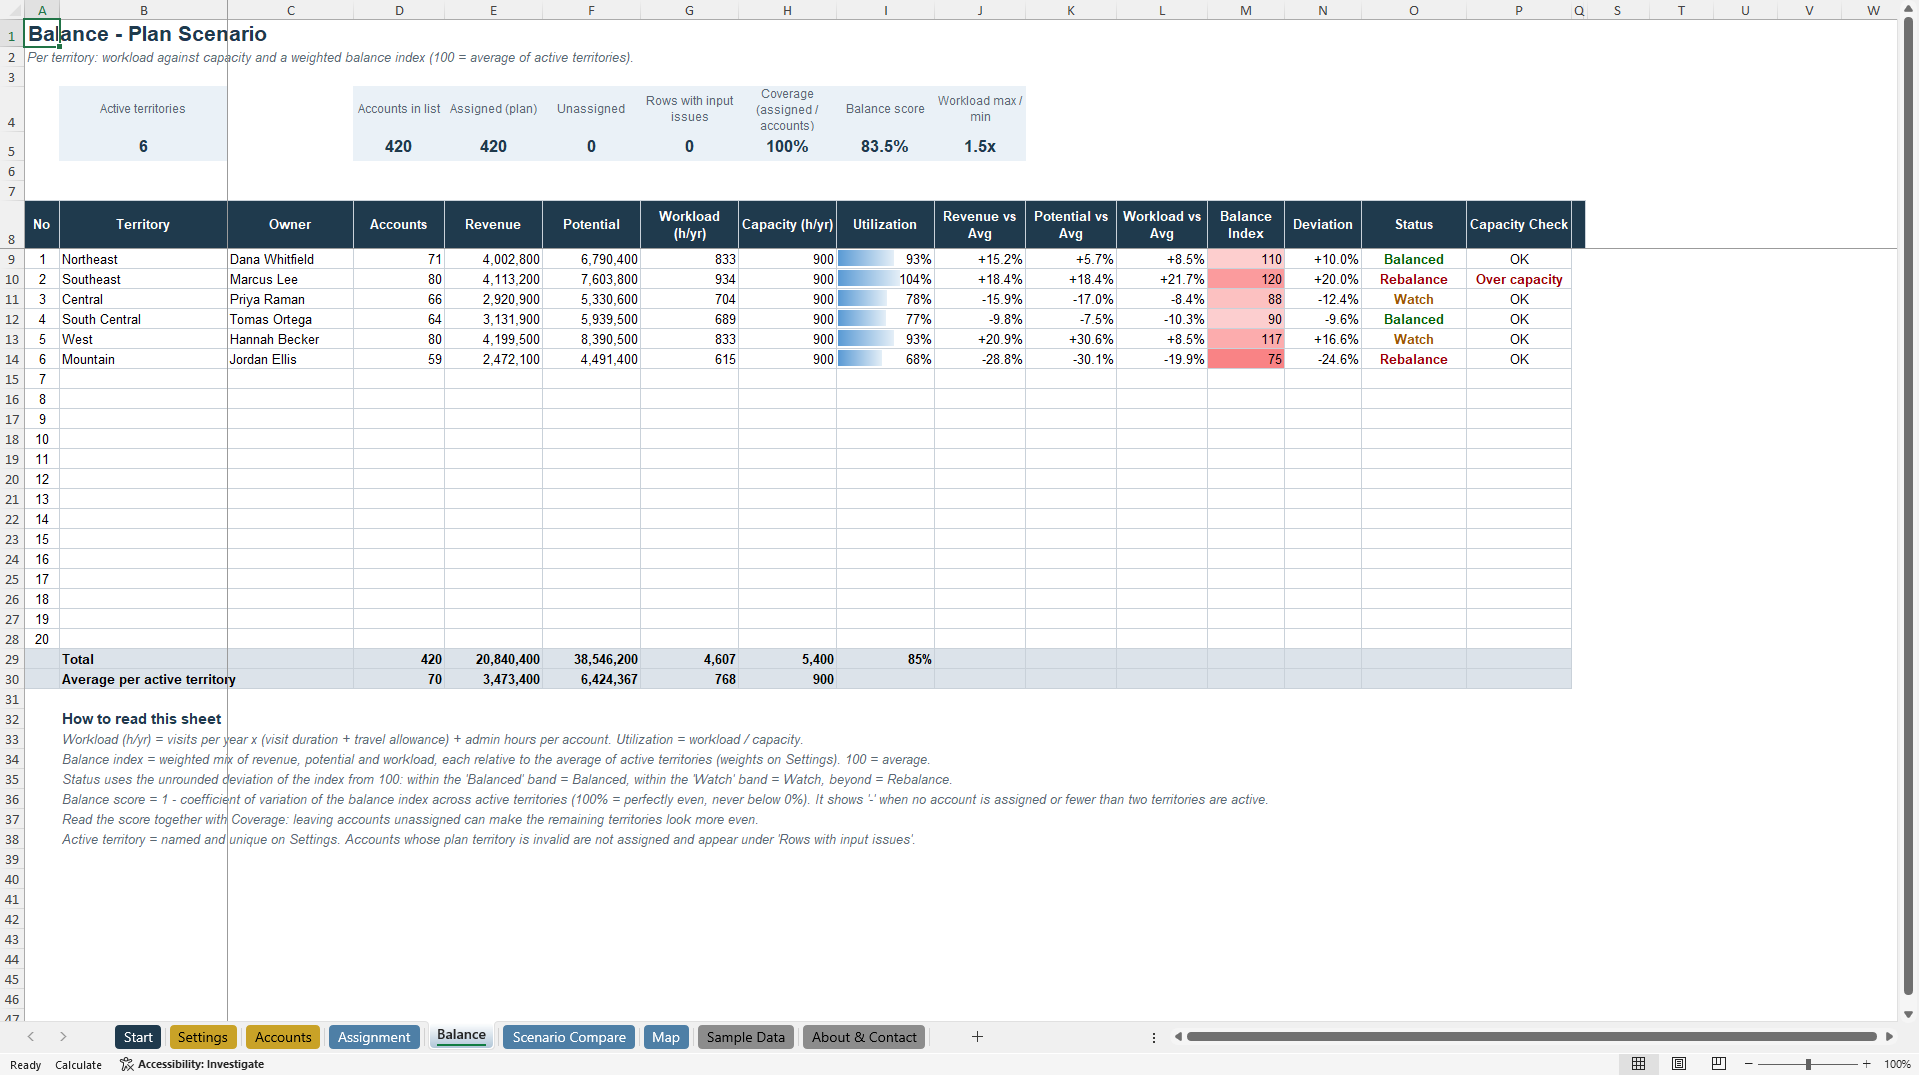
The Balance sheet shows for every territory the number of accounts, revenue, potential, workload hours and the utilization of available capacity. Workload is calculated from visits per year, visit duration, a travel allowance per visit and fixed admin hours. A weighted balance index compares each territory with the average, and a traffic-light status marks territories that are balanced, need watching or should be rebalanced. An overall balance score summarises how even the design is and is shown together with the share of accounts covered by the plan.
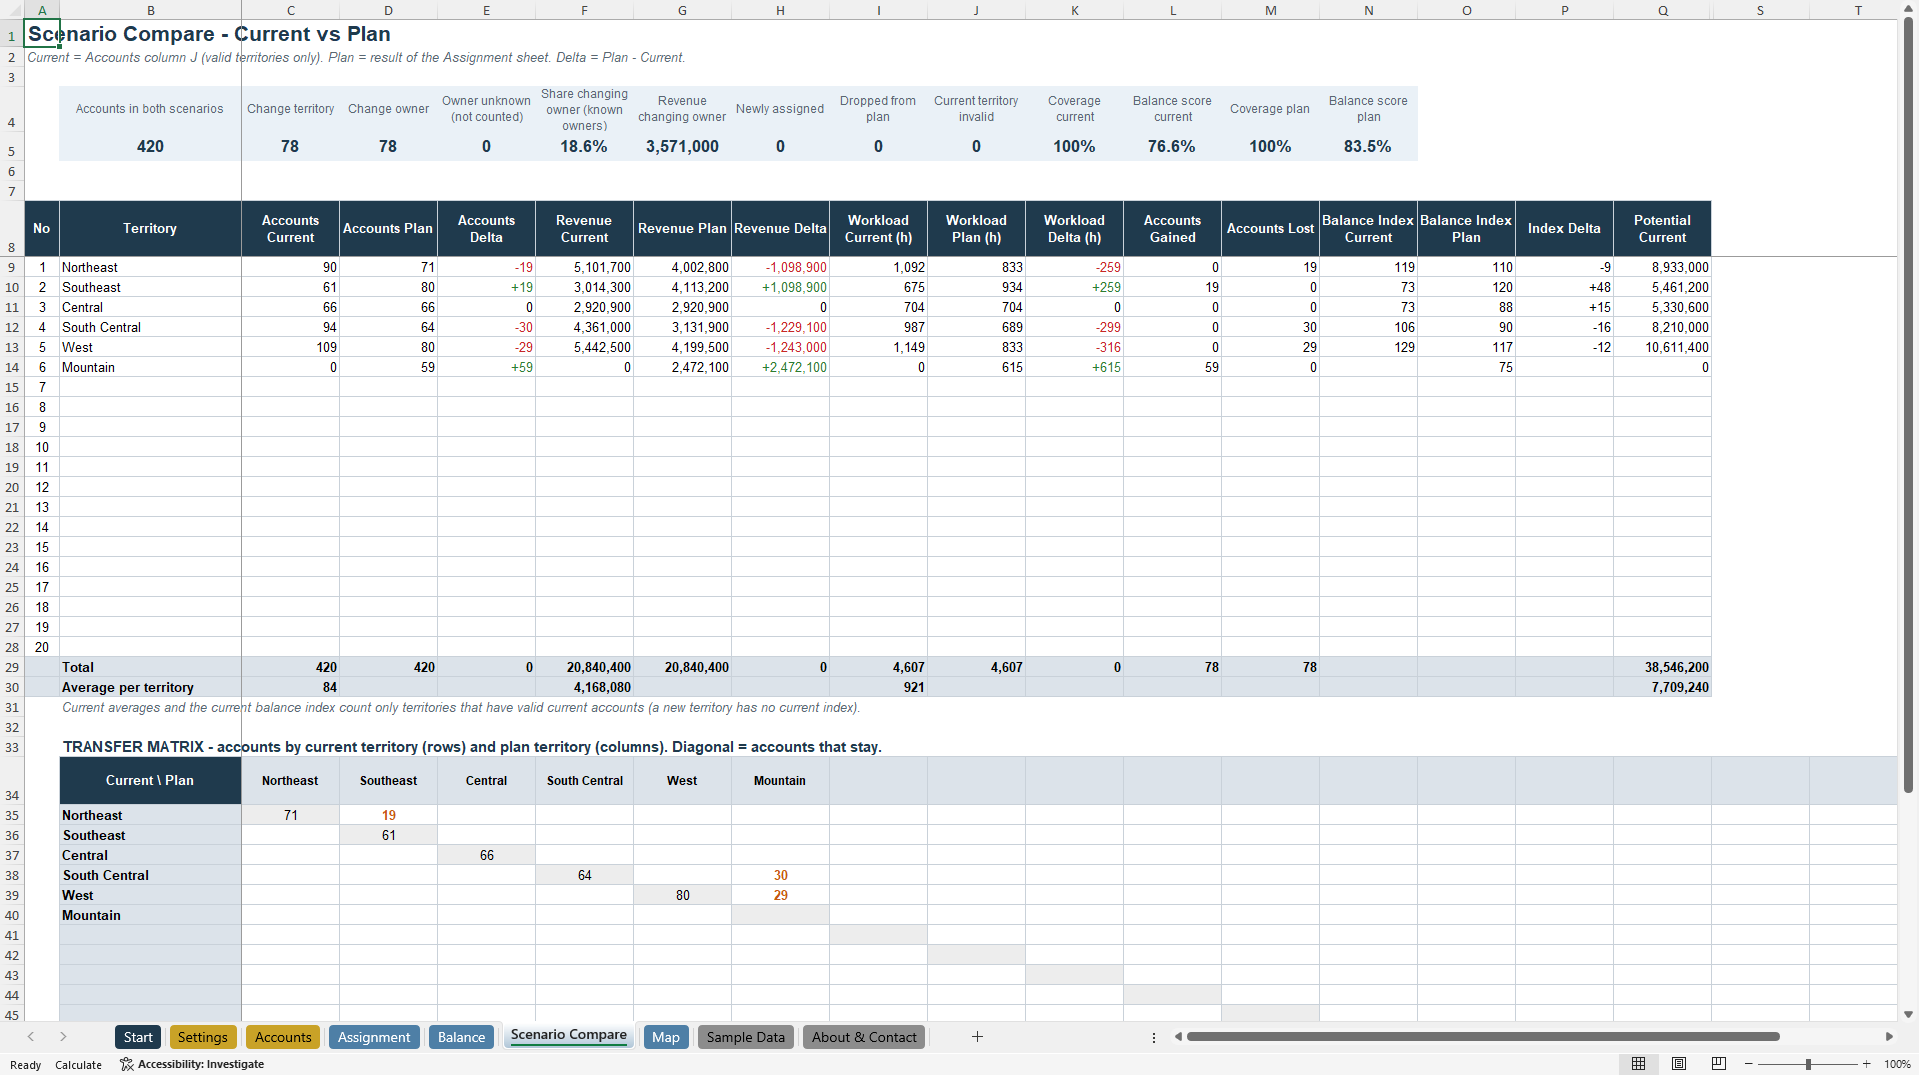
The Scenario Compare sheet sets the planned design against the current one. It shows changes in accounts, revenue and workload per territory, the accounts gained and lost, the number of accounts and the revenue that would change owner, and a transfer matrix of moves between territories.
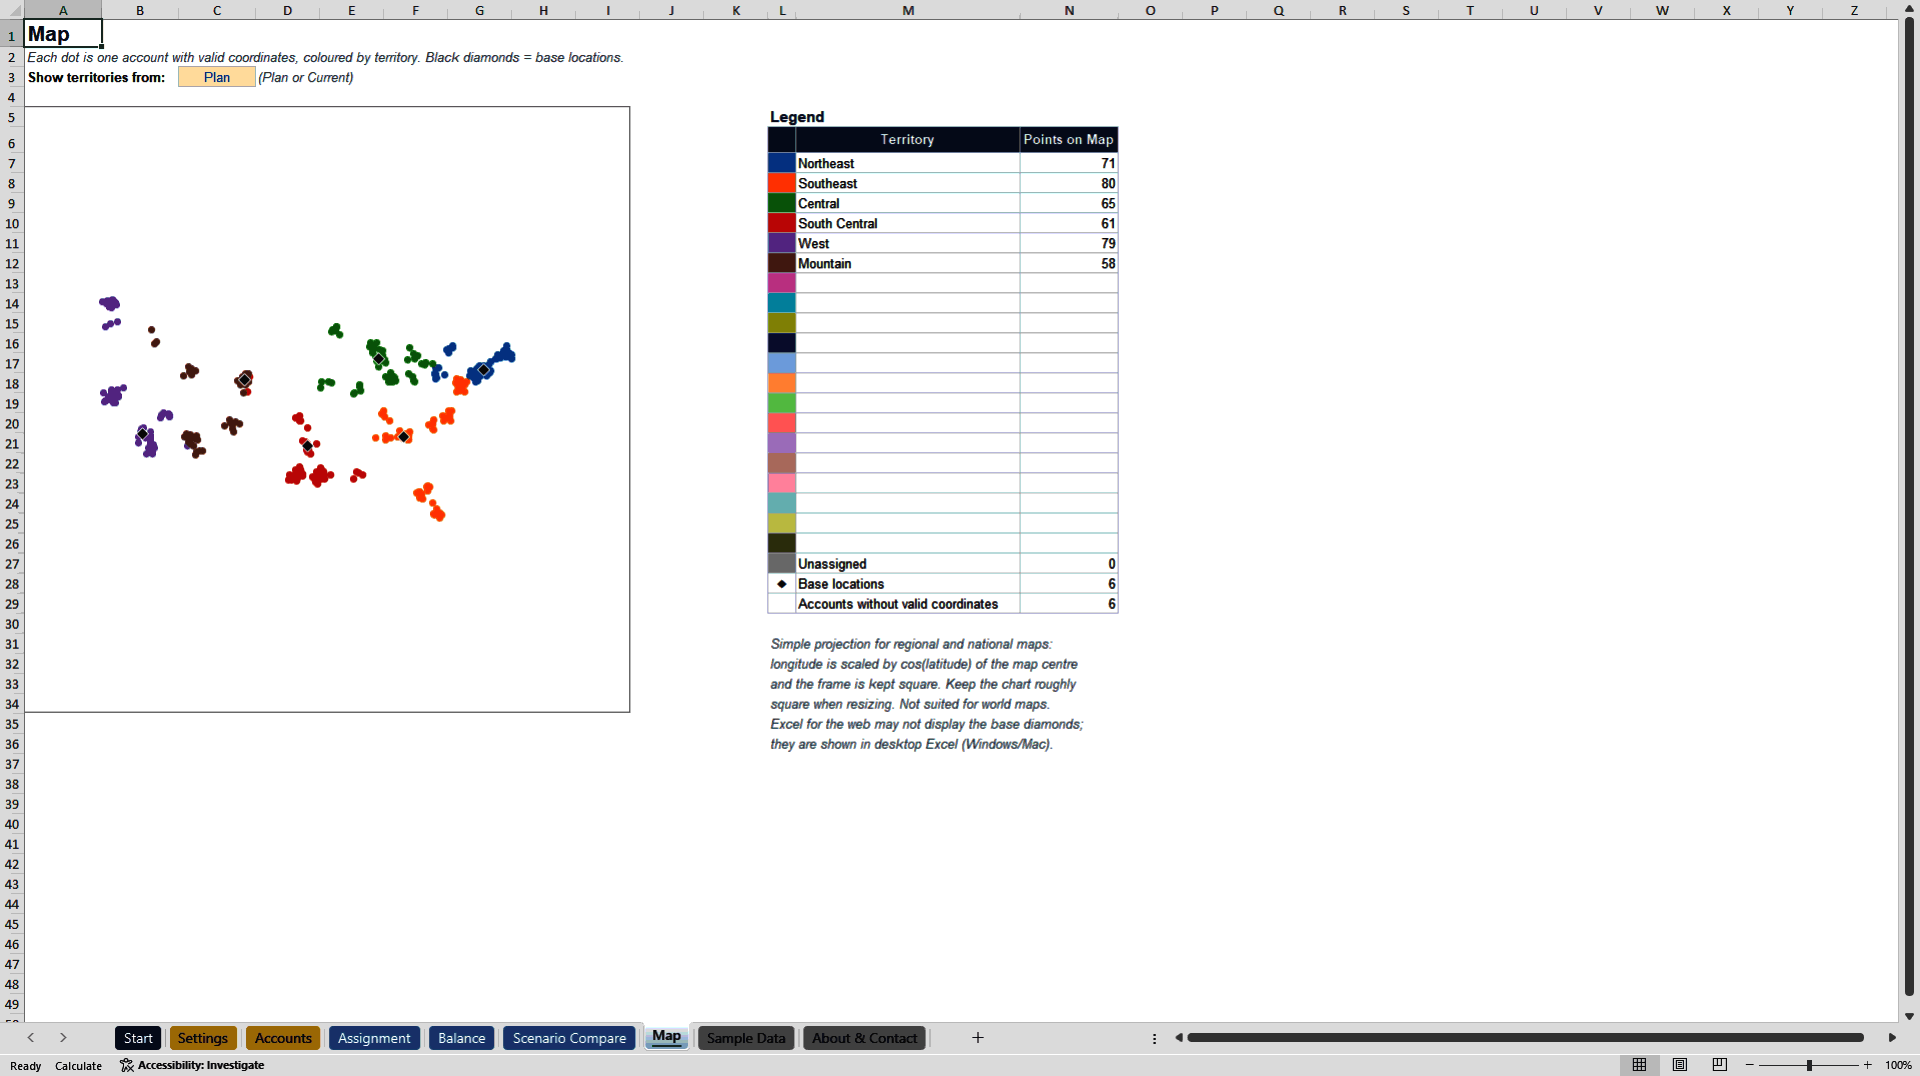
A Map sheet draws accounts with valid coordinates as coloured dots by territory; in desktop Excel the territory bases are marked as well. It is built with a standard Excel chart, needs no map files and works offline, and can switch between the current and the planned design. It uses a simple projection intended for regional and national data.
The toolkit deliberately does not optimise automatically. The user decides, and every change to a rule or an override updates all results at once, which keeps the outcome explainable to the sales team. All calculations use formulas compatible with Excel 2016 and later; there are no macros, so the file also works where macros are blocked. It was tested in Excel for Windows (Microsoft 365) and Excel for the web. Formula sheets are protected without a password.
The file opens with a fictional sample company so that every sheet shows results immediately. The secondary document is a four-page quick-start guide (PDF) with screenshots that explains the workflow and the calculation logic.
Contents: Start page with instructions, Settings, Accounts, Assignment, Balance, Scenario Compare, Map, Sample Data, About sheet, and the PDF quick-start guide.
Got a question about the product? Email us at support@flevy.com or ask the author directly by using the "Ask the Author a Question" form. If you cannot view the preview above this document description, go here to view the large preview instead.
Source: Best Practices in Sales Management, Sales Force Excel: Sales Territory Planning & Balancing Toolkit Excel (XLSX) Spreadsheet, CartoClear
ABOUT THE AUTHOR

CartoClear builds practical, data-driven tools for business planning, with a focus on location and territory questions.
Behind CartoClear is a geomatics professional specialising in geoinformatics. Professionally, I process and convert geospatial and business data and develop tools in Python, QGIS and FME. This background shapes every product: calculations are built transparently in standard
... [read more]
Ask the Author a Question
You must be logged in to contact the author.