 Click main image to view in full screen. Unlock all 16 preview images:
Non-Life Insurance Financial Model - 60-Month Forecast – Excel XLSX
Excel (XLSX) + supplemental PDF


BENEFITS OF THIS DOWNLOADABLE EXCEL DOCUMENT
- Build a 60-month forecast across 15 underwriting lines and trace how premium recognition and claims settlement timing affect profit and cash flow.
- Track gross, ceded and net technical reserves, quota-share reinsurance and investment income through three linked financial statements.
- Compare Base, Upside and Downside scenarios and use the dashboard, cash-buffer monitoring and reconciliation checks to review the forecast.
INSURANCE EXCEL DESCRIPTION
Model how written premiums become earned revenue, how incurred claims become cash payments, and how reinsurance changes what a non-life insurer retains. This editable Excel model connects underwriting assumptions to technical reserves, investment income, liquidity and three linked financial statements across 60 monthly forecast periods.
The model is designed for insurance finance teams, founders, analysts, consultants and educators who need a transparent planning model for a non-life insurance company. The supplied portfolio and financial results are fictional examples that you can replace with your own assumptions.
📊 REVIEW FIVE YEARS OF INSURANCE PERFORMANCE
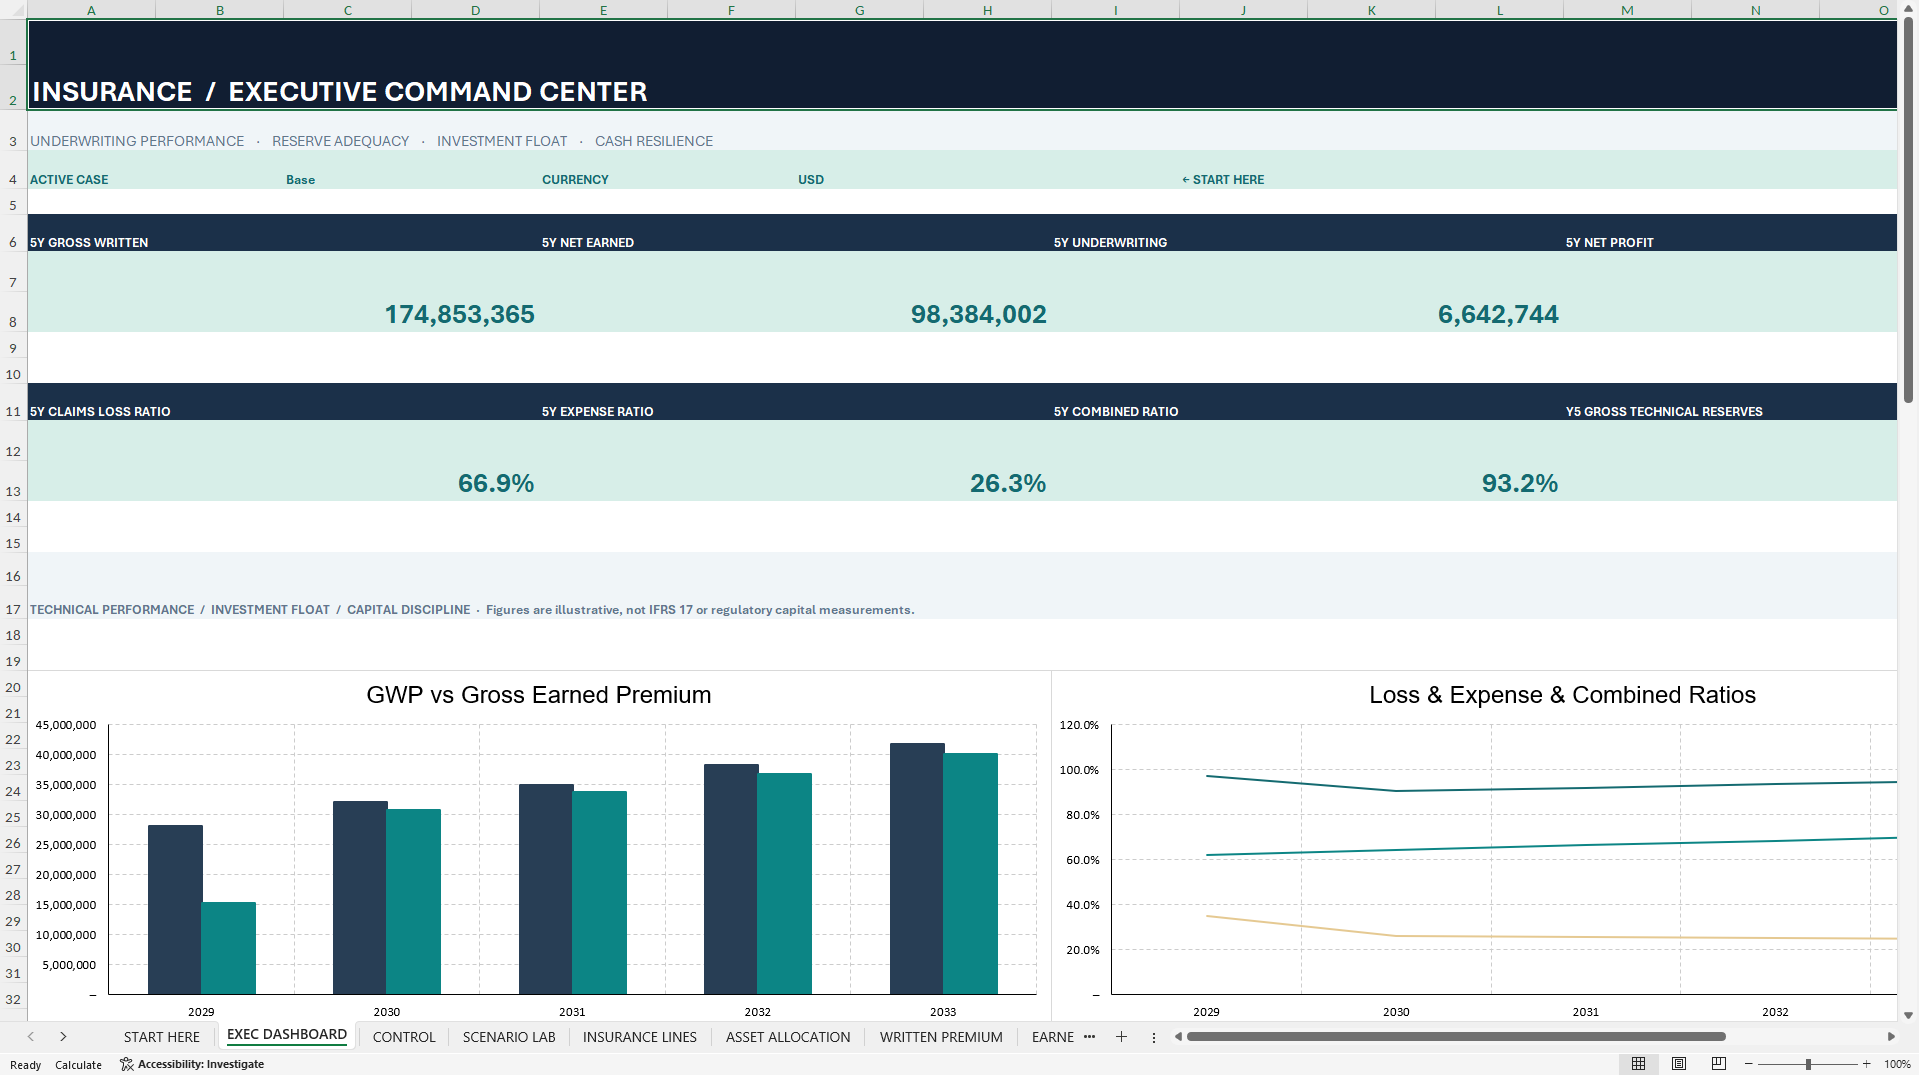
The executive dashboard summarises gross written premiums, net earned premiums, net profit, underwriting performance, the claims loss ratio, the expense ratio, the combined ratio and gross technical reserves. Eight native Excel charts draw on linked workbook calculations. Use the five-year annual summary to review full-year results and year-end financial balances alongside the monthly forecast.
📝 BUILD YOUR FORECAST ACROSS 15 UNDERWRITING LINES
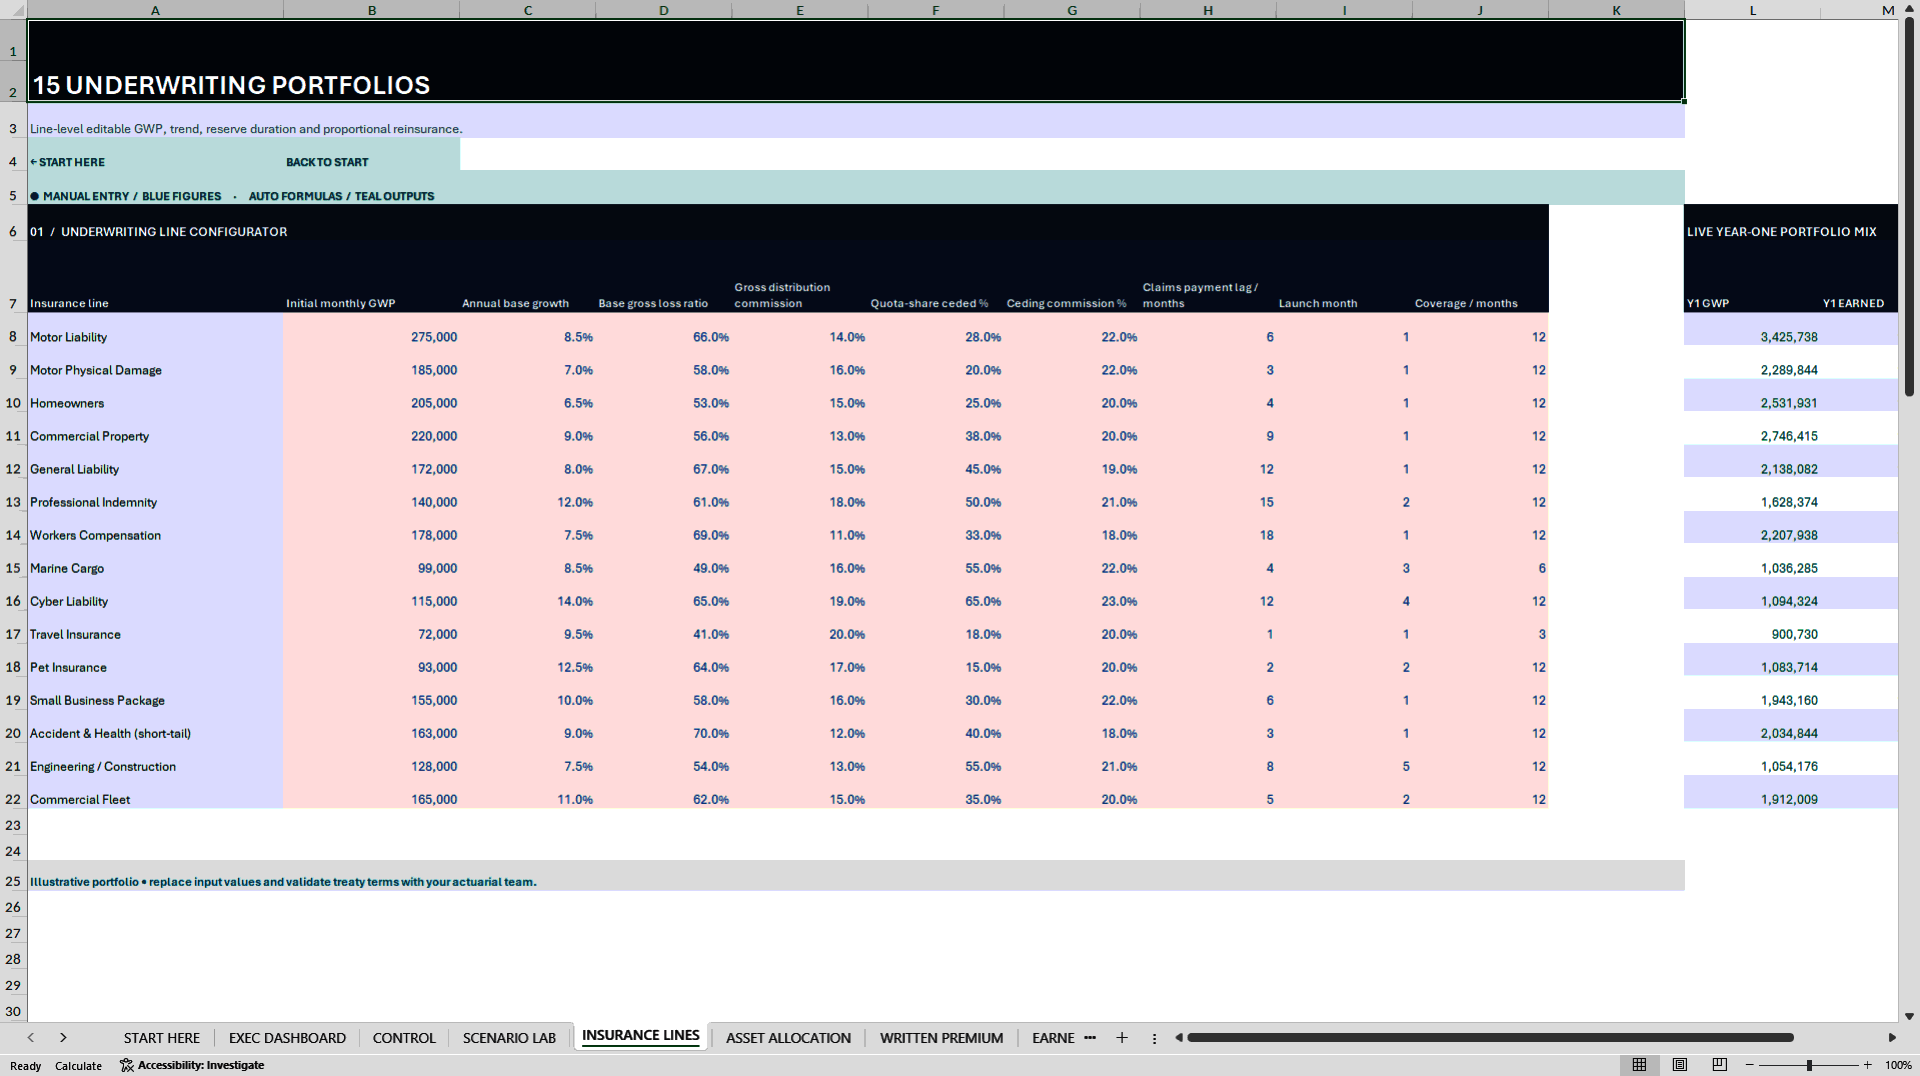
Configure 15 insurance lines, with example portfolios covering motor, property, liability, marine, cyber, travel, pet and commercial insurance. Edit written premiums, growth rates, loss ratios, acquisition commissions, launch months, coverage terms and claims settlement lags. Monthly seasonality and the selected scenario influence the premium forecast.
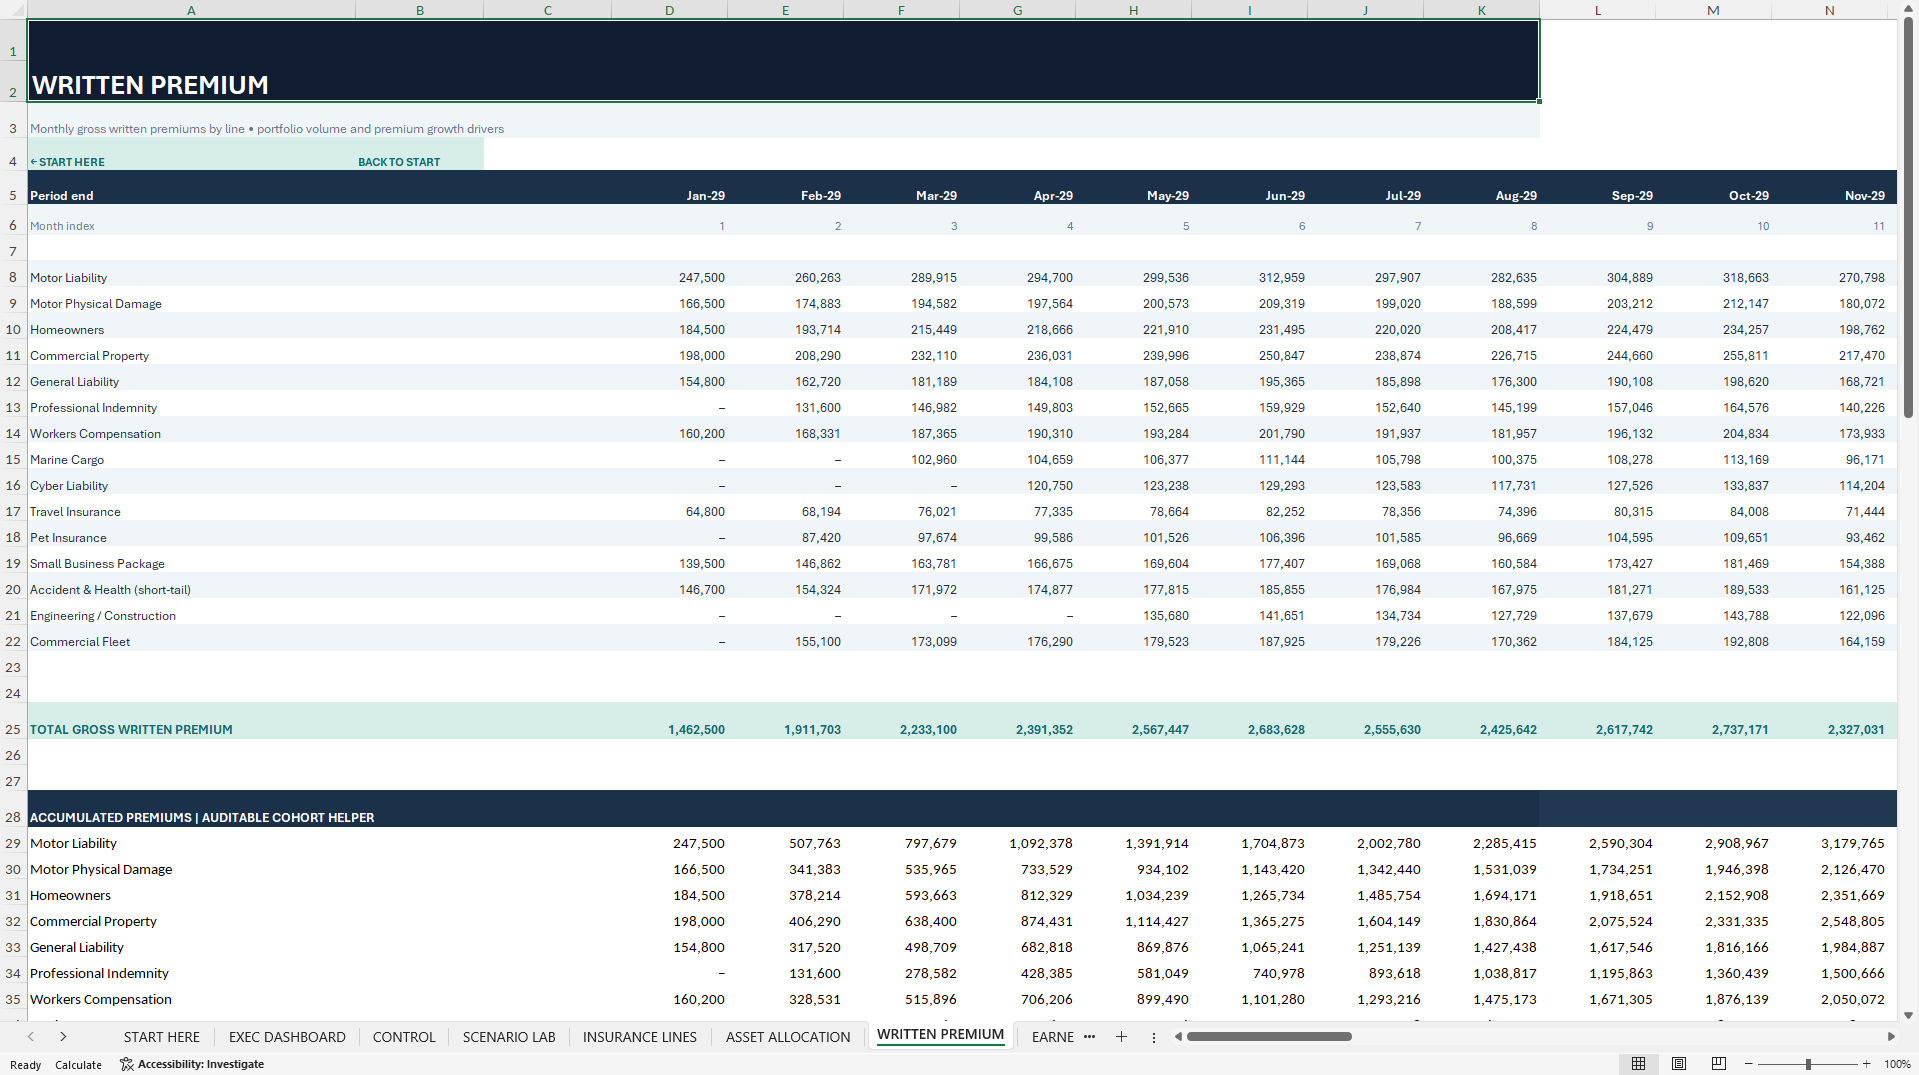
Follow written premiums, premium collections and earned premiums separately. A simplified straight-line earning convention spreads premium recognition over the coverage period and tracks the unearned portion as a reserve. Acquisition commission payments and recognised acquisition expenses are tracked separately, with deferred acquisition costs carried on the balance sheet.
📋 TRACE INCURRED CLAIMS, PAYMENTS AND OUTSTANDING RESERVES
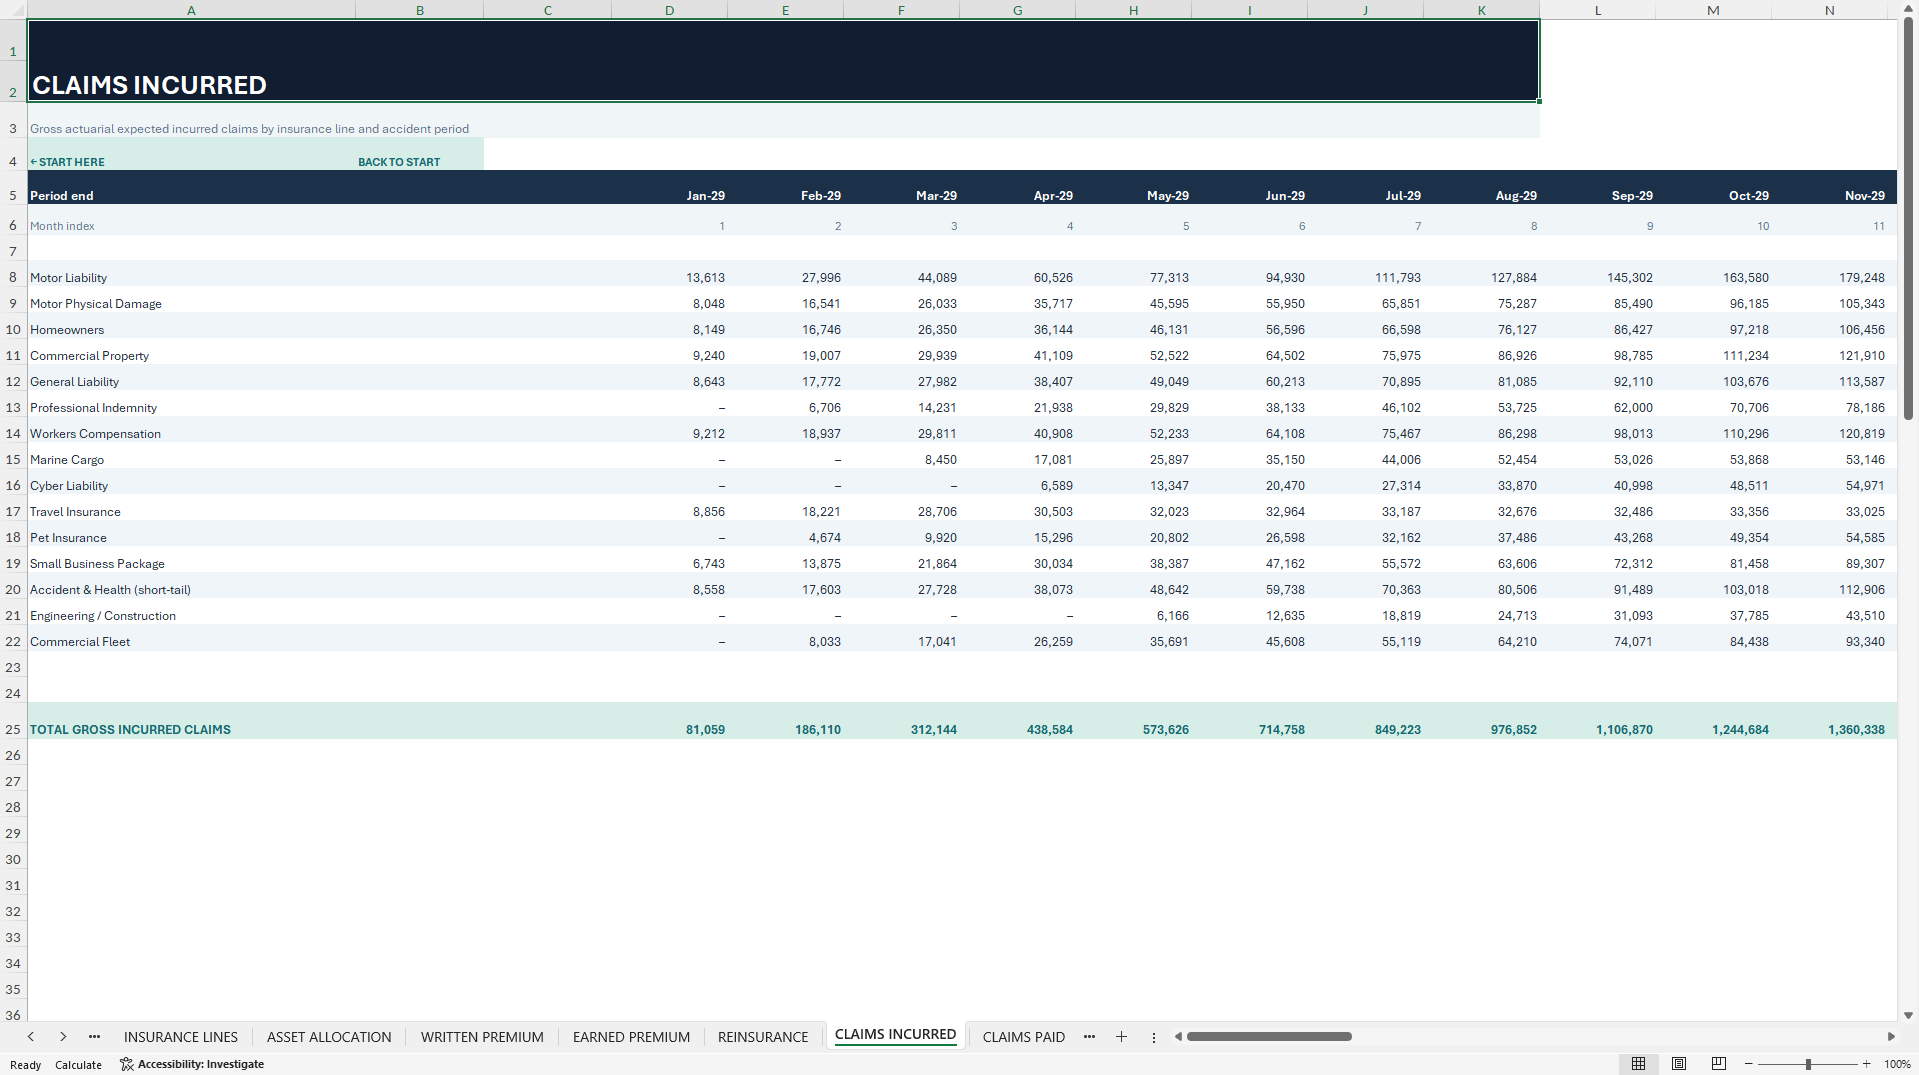
Estimate incurred claims from earned insurance exposure and line-specific loss ratios. Configurable whole-month settlement lags determine when claims are paid. Review outstanding gross claims, proportional reinsurance recoverables and the movements between gross, ceded and net technical balances.
These schedules are designed for management forecasting. They do not provide an actuarial claims development or incurred-but-not-reported (IBNR) study.
🛡️ MODEL REINSURANCE AND INVESTMENT INCOME
Analyse quota-share reinsurance through ceded premiums, ceding commissions, proportional claims recoverables and deferred reinsurance balances. An illustrative excess-of-loss module models premium costs only. It does not model catastrophe recoveries, event limits or reinstatement premiums.
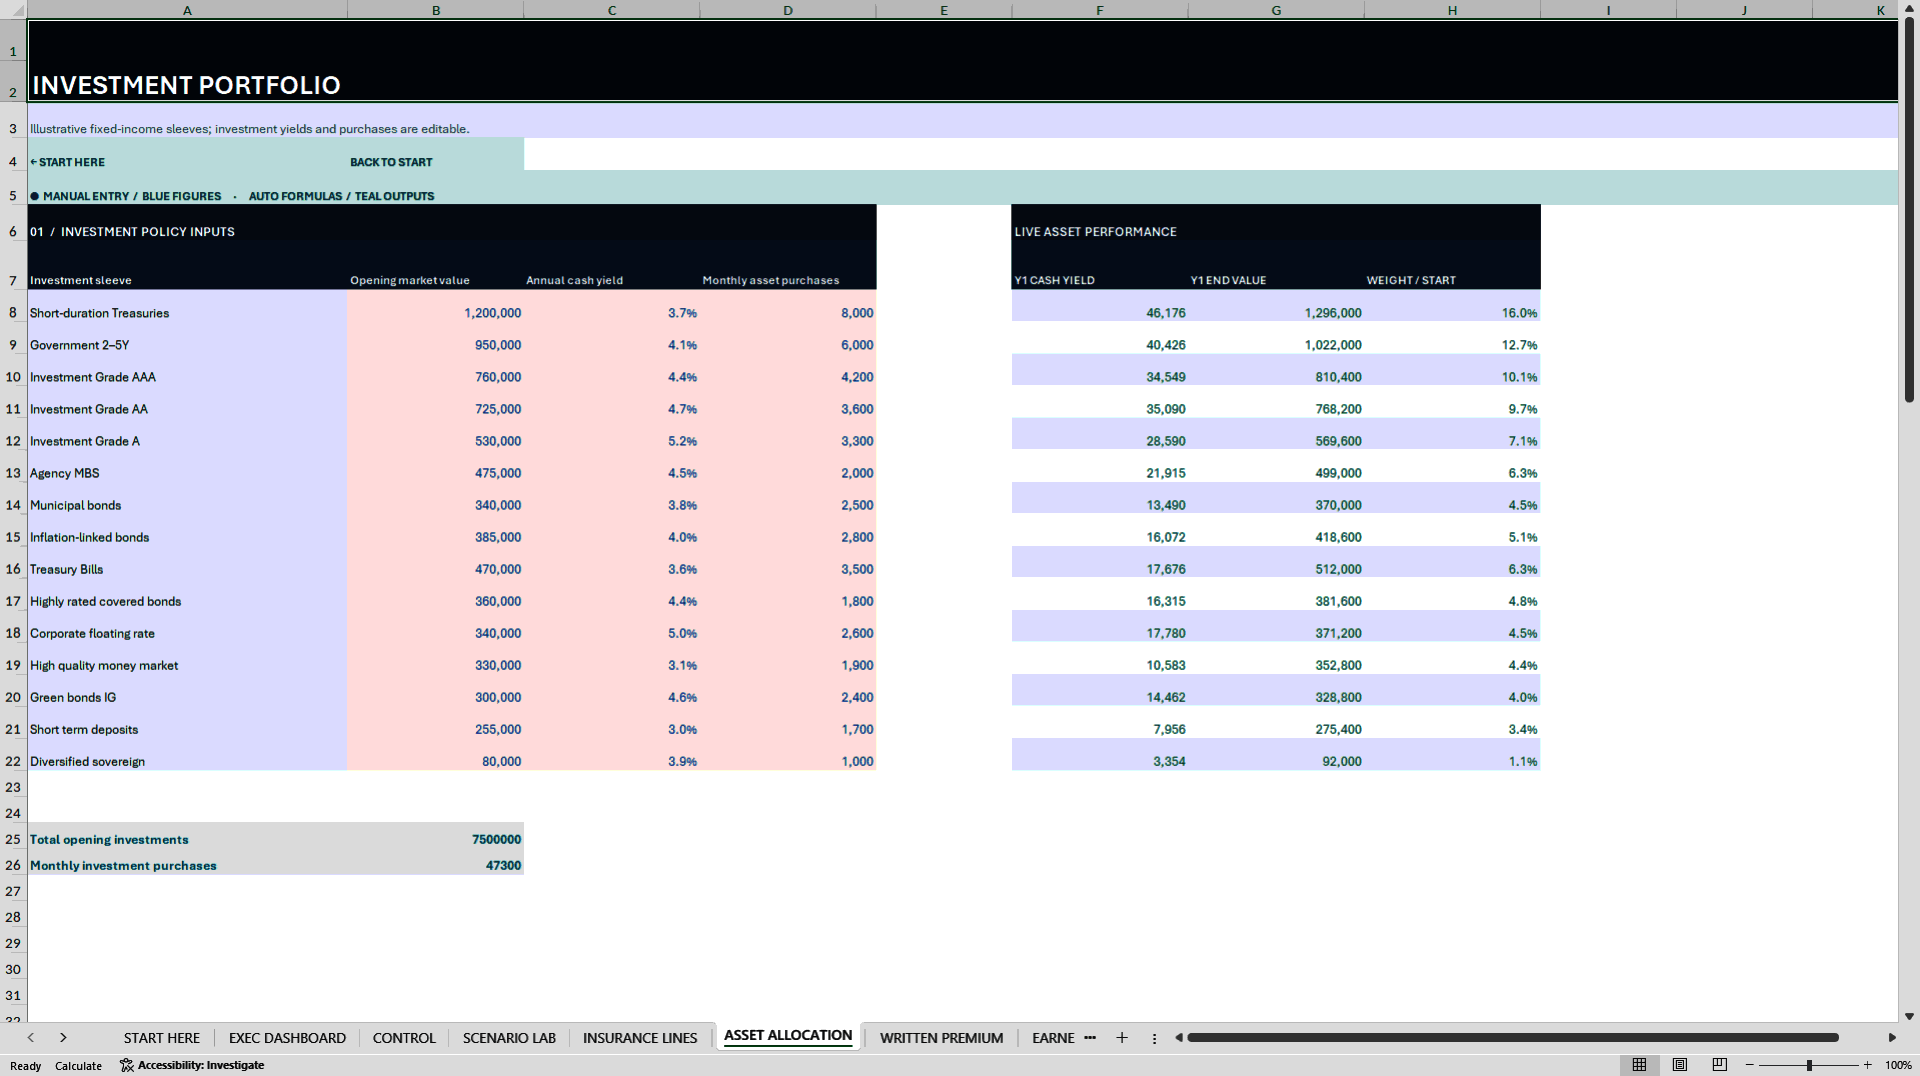
Use 15 editable investment allocation categories to enter opening balances, recurring purchases and assumed yields. Investment income flows into financial results, while purchases and related receipts feed into the cash flow forecast.
💰 CONNECT OPERATING DRIVERS TO THREE FINANCIAL STATEMENTS
The Income Statement brings together net earned premiums, incurred claims, acquisition expenses, underwriting results, investment income, financing costs, tax and net profit.
The Cash Flow Statement tracks premium receipts, claims settlements, commissions, operating expenses, investment purchases, capital expenditure, debt repayments and dividends. The Balance Sheet shows cash, investments, deferred acquisition costs, reinsurance recoverables, technical liabilities, property and equipment, debt and equity.
🔄 TEST THREE SCENARIOS AND CHECK THE MODEL
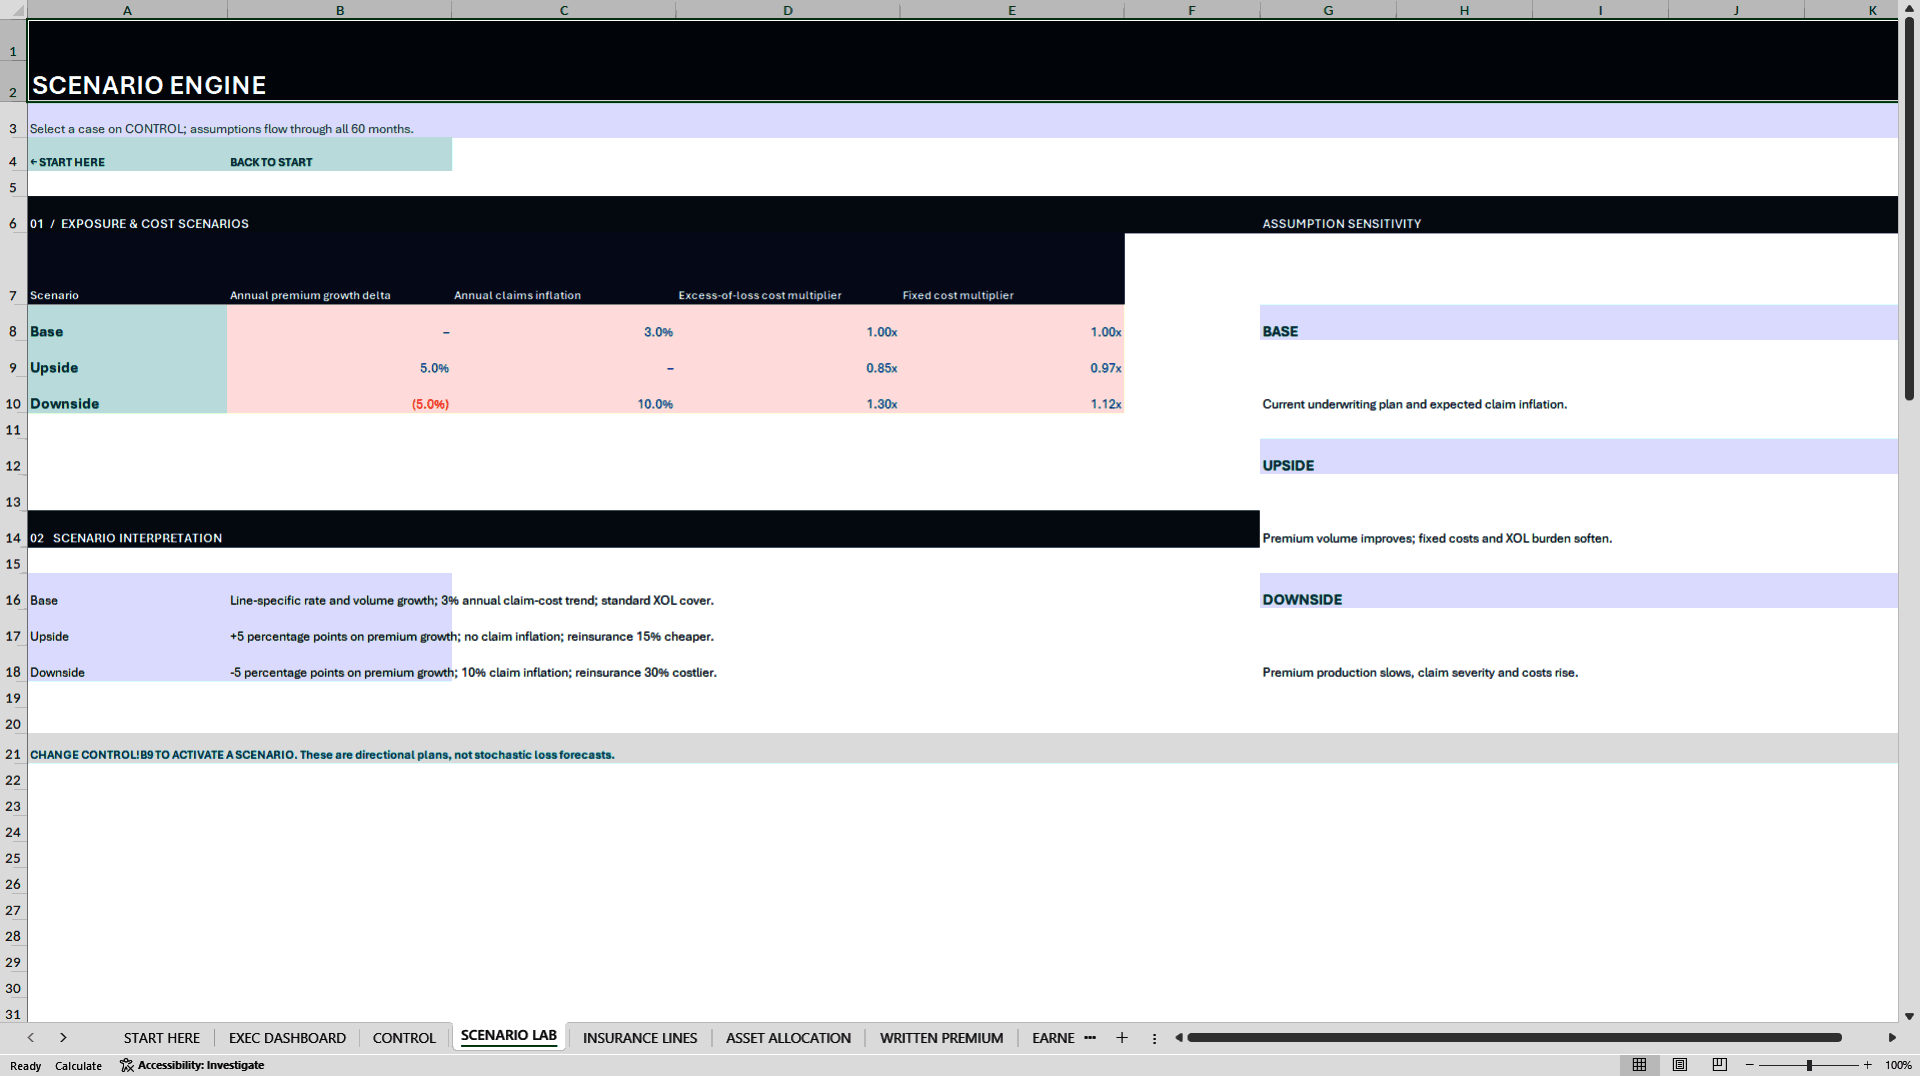
Switch between Base, Upside and Downside to assess how changes in premium growth, claims inflation, excess-of-loss premium costs and operating expenses affect the forecast. Review the cash buffer and use MODEL CHECKS to trace balance-sheet, cash, premium, reserve, recoverable, debt and investment reconciliations. A passing check means a specified model relationship reconciles. It does not establish solvency or reserve sufficiency.
📦 WHAT YOU RECEIVE
• Primary Document – Editable, macro-free Excel workbook (.xlsx) with 24 worksheets, 60 monthly forecast periods, 15 underwriting lines, 15 investment allocation categories, three scenarios, three linked financial statements, a five-year annual summary and eight native Excel charts.
• Supplementary Document – 37-page English How-to-Use Guide (PDF) covering setup, underwriting assumptions, premiums, claims, reserves, reinsurance, investments, financing, scenarios, liquidity, reconciliations and troubleshooting.
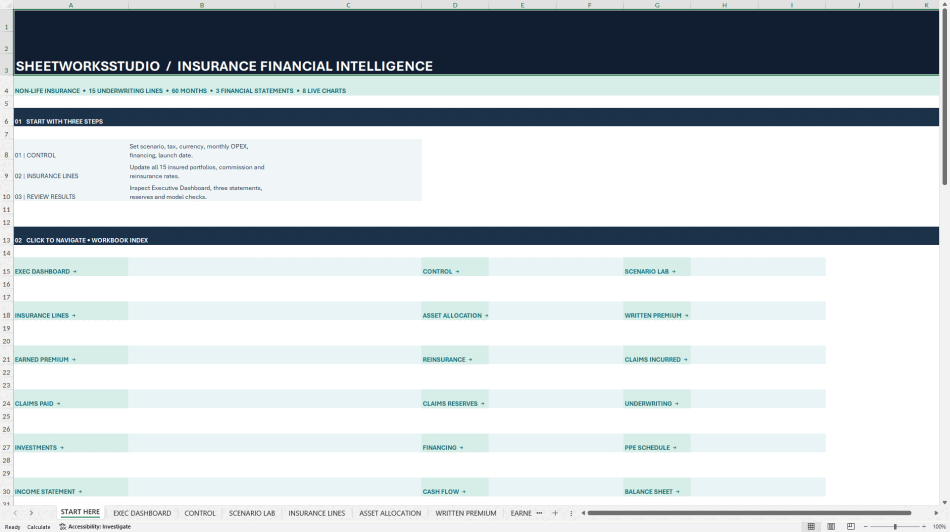
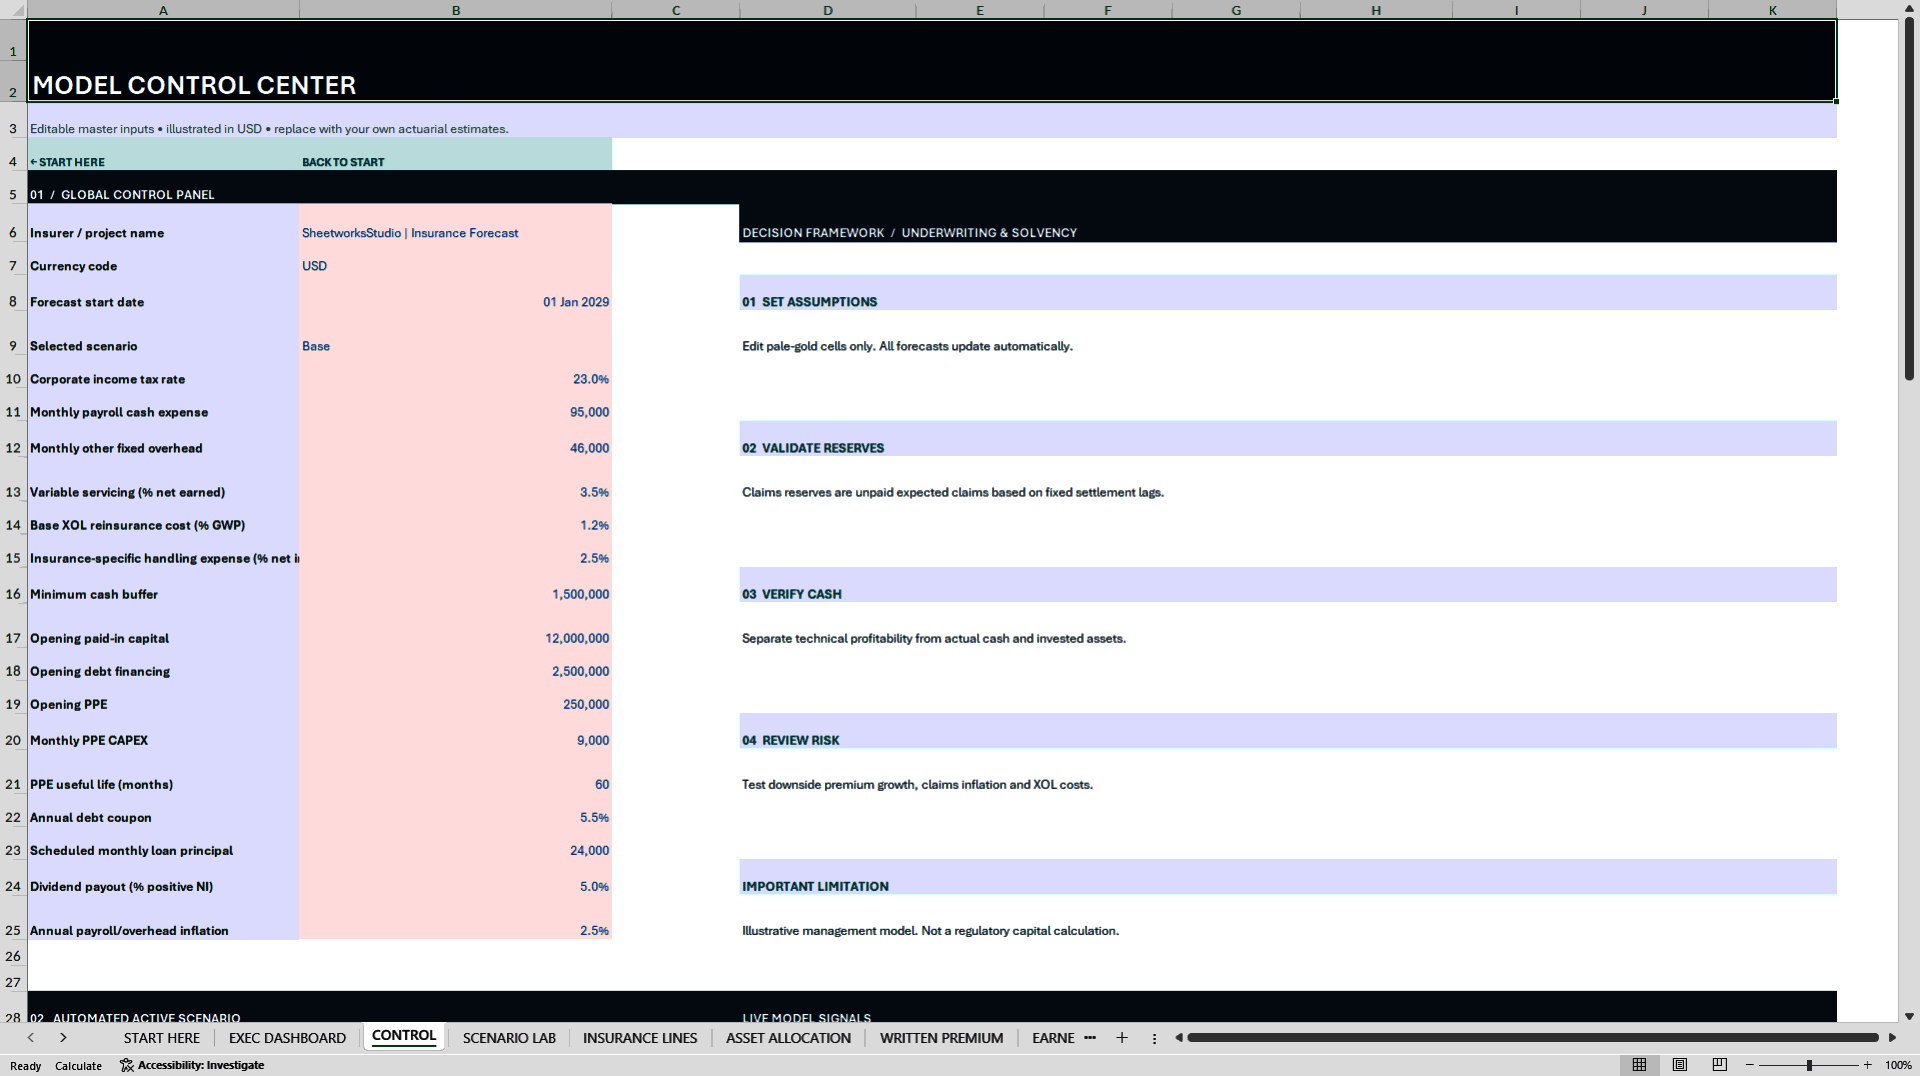
Start with the START HERE sheet, then set the reporting start date, currency label and scenario in CONTROL. Replace the sample inputs in INSURANCE LINES and ASSET ALLOCATION before reviewing the statements, dashboard and MODEL CHECKS.
⚙️ COMPATIBILITY AND SCOPE
The illustrative forecast runs from January 2029 to December 2033. The start date is editable. The currency setting changes the reporting label and does not convert currencies. The macro-free workbook does not require external data connections. Microsoft Excel Desktop is recommended. Excel Desktop recalculation and Google Sheets import have not been independently verified for this package.
This independent, unofficial financial planning template by SheetworksStudio is not an actuarial reserving platform, regulatory reporting system, IFRS 17 calculation engine, Solvency II capital model or Swiss SST model. It does not provide actuarial, financial, accounting, regulatory, tax or legal advice. All sample data is fictional. Validate your assumptions independently and obtain qualified review before relying on the forecast for decisions. No financial outcome is guaranteed.
Got a question about the product? Email us at support@flevy.com or ask the author directly by using the "Ask the Author a Question" form. If you cannot view the preview above this document description, go here to view the large preview instead.
Source: Best Practices in Insurance, Integrated Financial Model Excel: Non-Life Insurance Financial Model - 60-Month Forecast Excel (XLSX) Spreadsheet, SheetworksStudio
ABOUT THE AUTHOR

SheetworksStudio creates premium Excel-based business templates, dashboards, trackers, financial models, and management systems for professionals, consultants, entrepreneurs, and organizations.
Our portfolio covers finance, project management, operations, risk management, compliance, AI governance, HR, supply chain, performance management, and business planning. Each product is designed to
... [read more]
Ask the Author a Question
You must be logged in to contact the author.