 Click main image to view in full screen. Unlock all 15 preview images:
Food & Beverage Manufacturing Financial Model – Excel XLSX
Excel (XLSX) + supplemental PDF


BENEFITS OF THIS DOWNLOADABLE EXCEL DOCUMENT
- ⚙️ Trace recipe, packaging and conversion costs to the cost per saleable unit across 15 SKUs and compare direct-retail and wholesale margins.
- 🏭 See when whole-batch production, yield and three production lines limit shipments, and follow the impact on inventory, working capital and cash.
- 📈 Test four operating scenarios and trace their impact through three linked statements to investor IRR, MOIC, equity NPV and a hypothetical Year-10 exit.
FOOD & BEVERAGE INDUSTRY EXCEL DESCRIPTION
🏭 FOOD & BEVERAGE MANUFACTURING FINANCIAL MODEL
From recipe costing to factory cash flow and investor returns
What happens to margin when ingredients cost more, or to cash when a new production line opens before sales catch up? This editable 10-year Excel model connects those decisions. Trace ingredient and packaging costs through production yield, capacity, shipments, inventory, working capital and three financial statements, then review the effect on investor returns.
Built for food and beverage founders, manufacturing operators, finance teams and advisors, the workbook includes 15 editable SKU positions illustrated with fictional snacks, beverages and sauces. Replace the sample data with your own recipes, factory constraints, selling prices and financing assumptions.
⚙️ RECIPE COSTING & SKU ECONOMICS
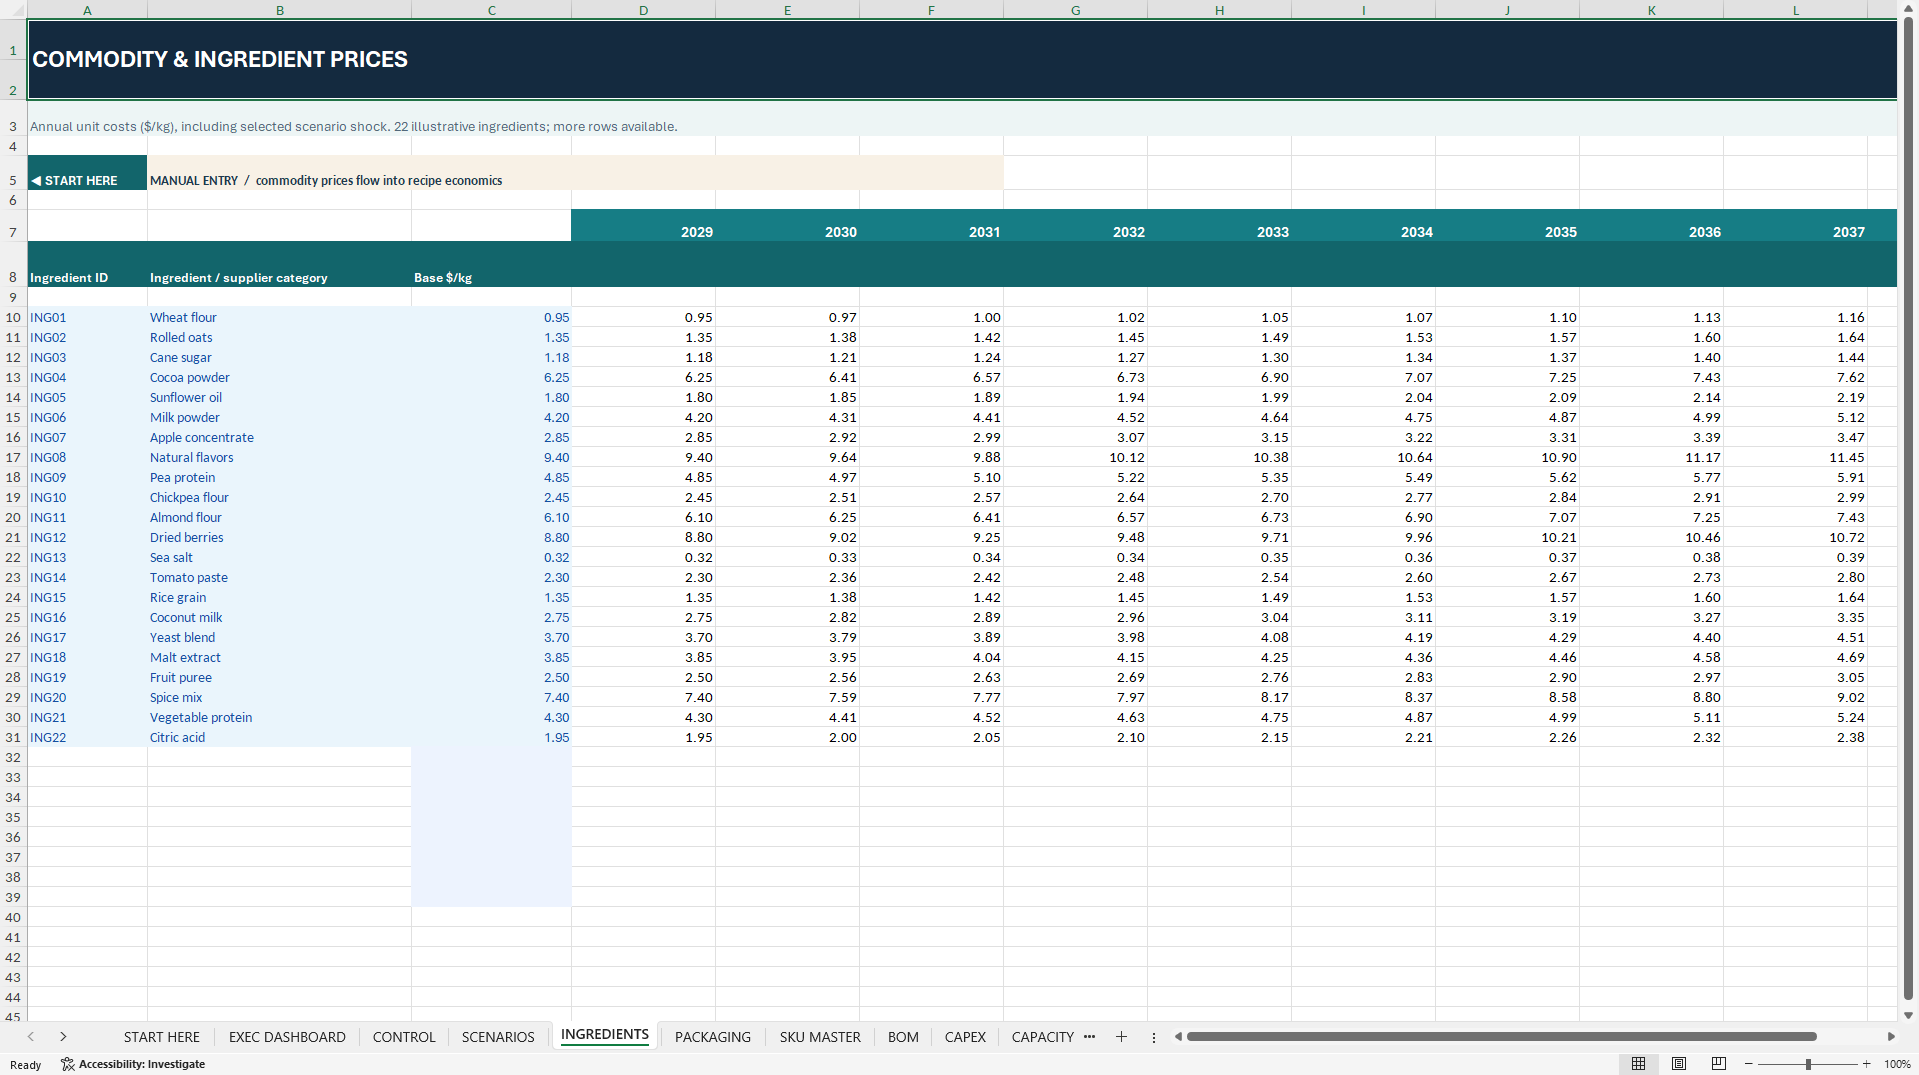
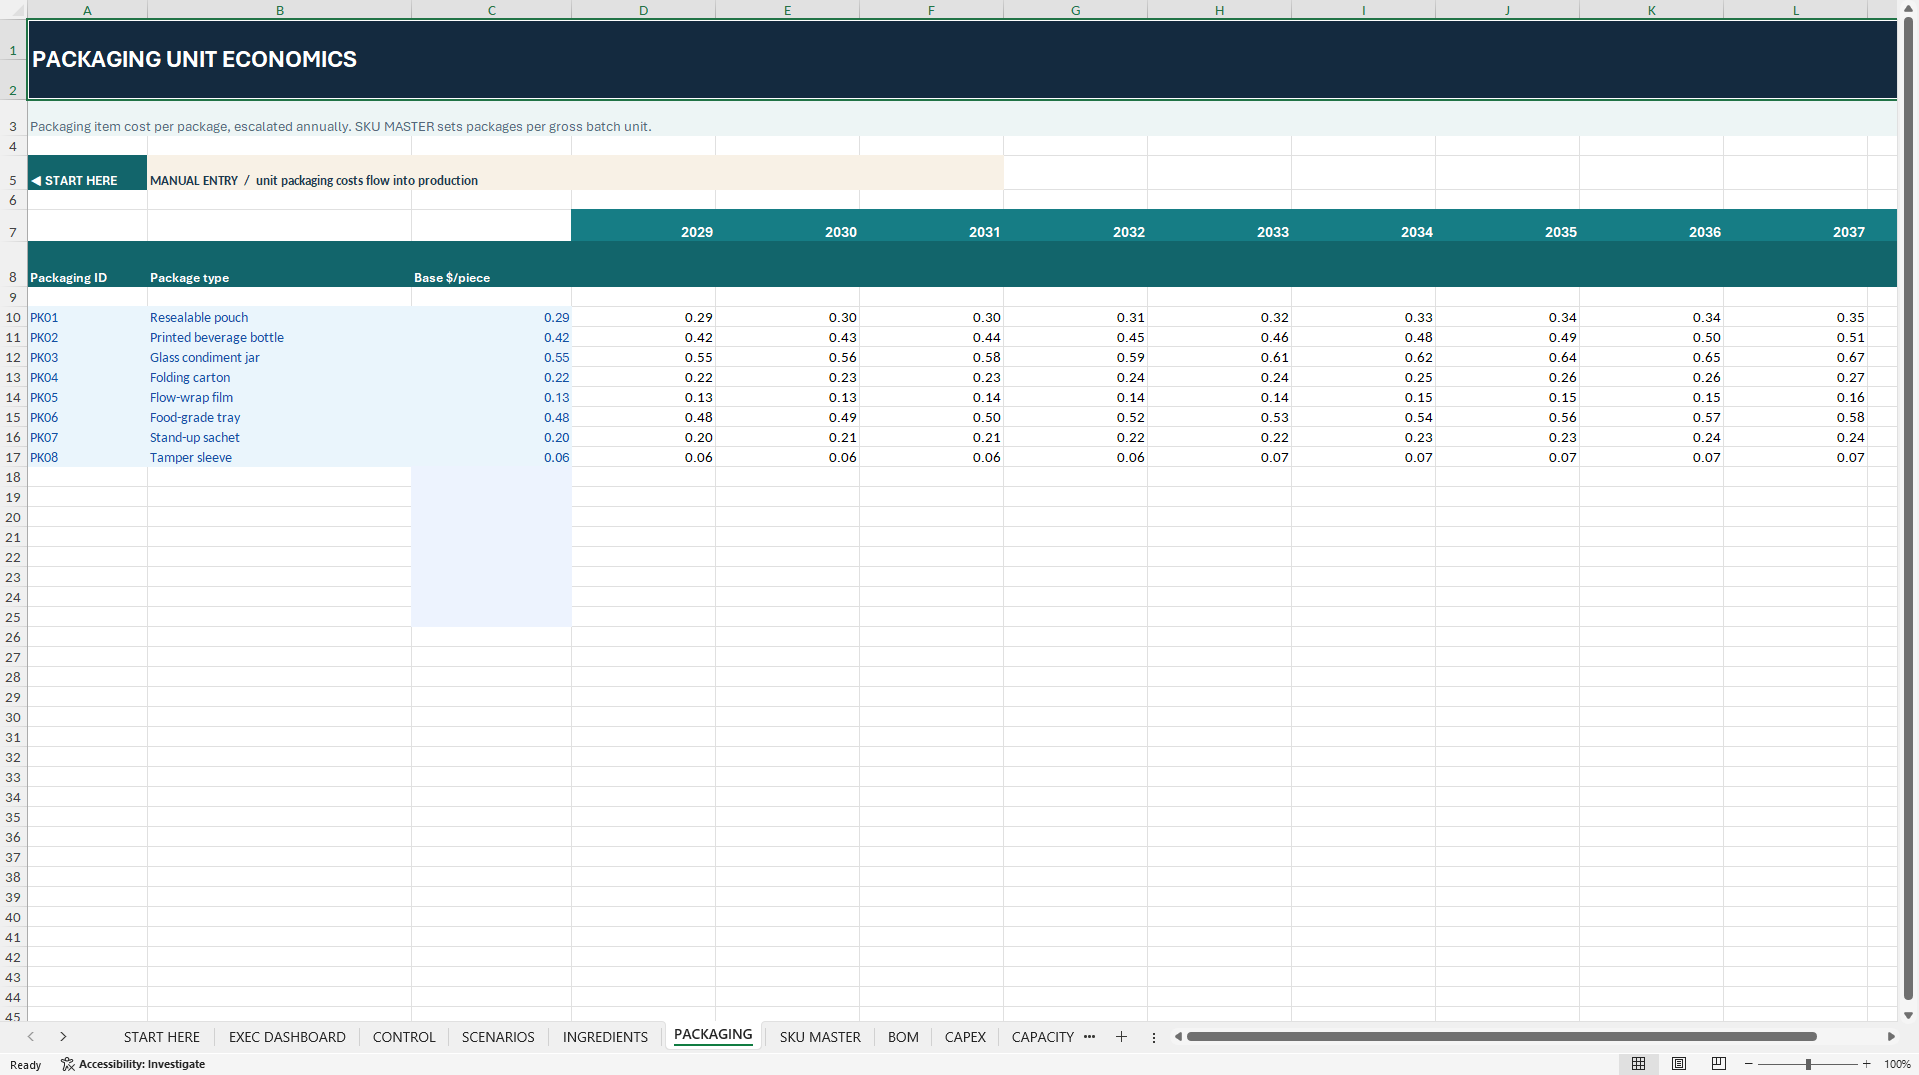
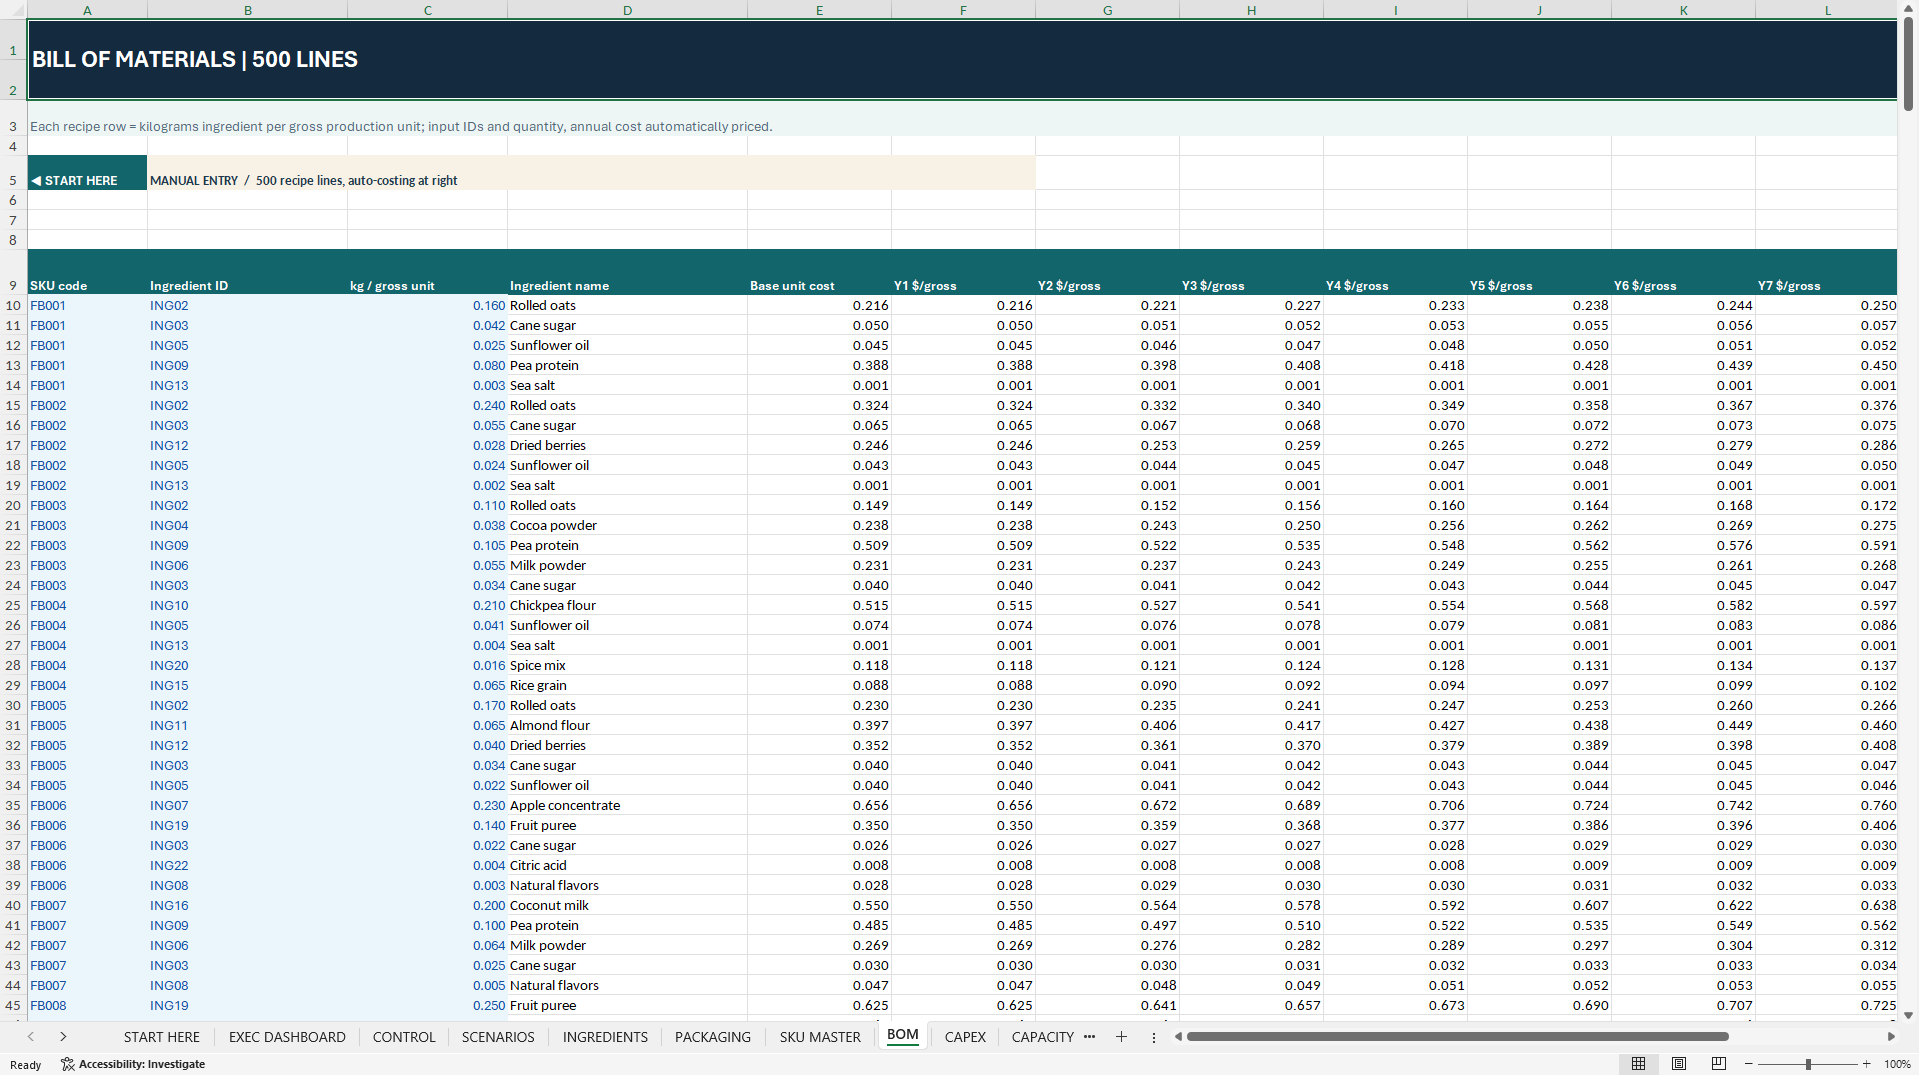
Use the prepared 500-row bill of materials (BOM) to assign ingredients and consumption quantities to each SKU. Combine raw-material prices, packaging, per-unit conversion costs and production yield to estimate variable manufacturing cost per saleable unit.
Set separate producer net selling prices for direct retail and wholesale. Review SKU-level margins and test whether a change in channel mix offsets its fulfillment costs and collection terms. The workbook has 15 prelinked SKU positions. Adding recipe rows within the BOM does not create additional SKU positions.
🏭 PRODUCTION BATCHES, YIELD & FACTORY CAPACITY
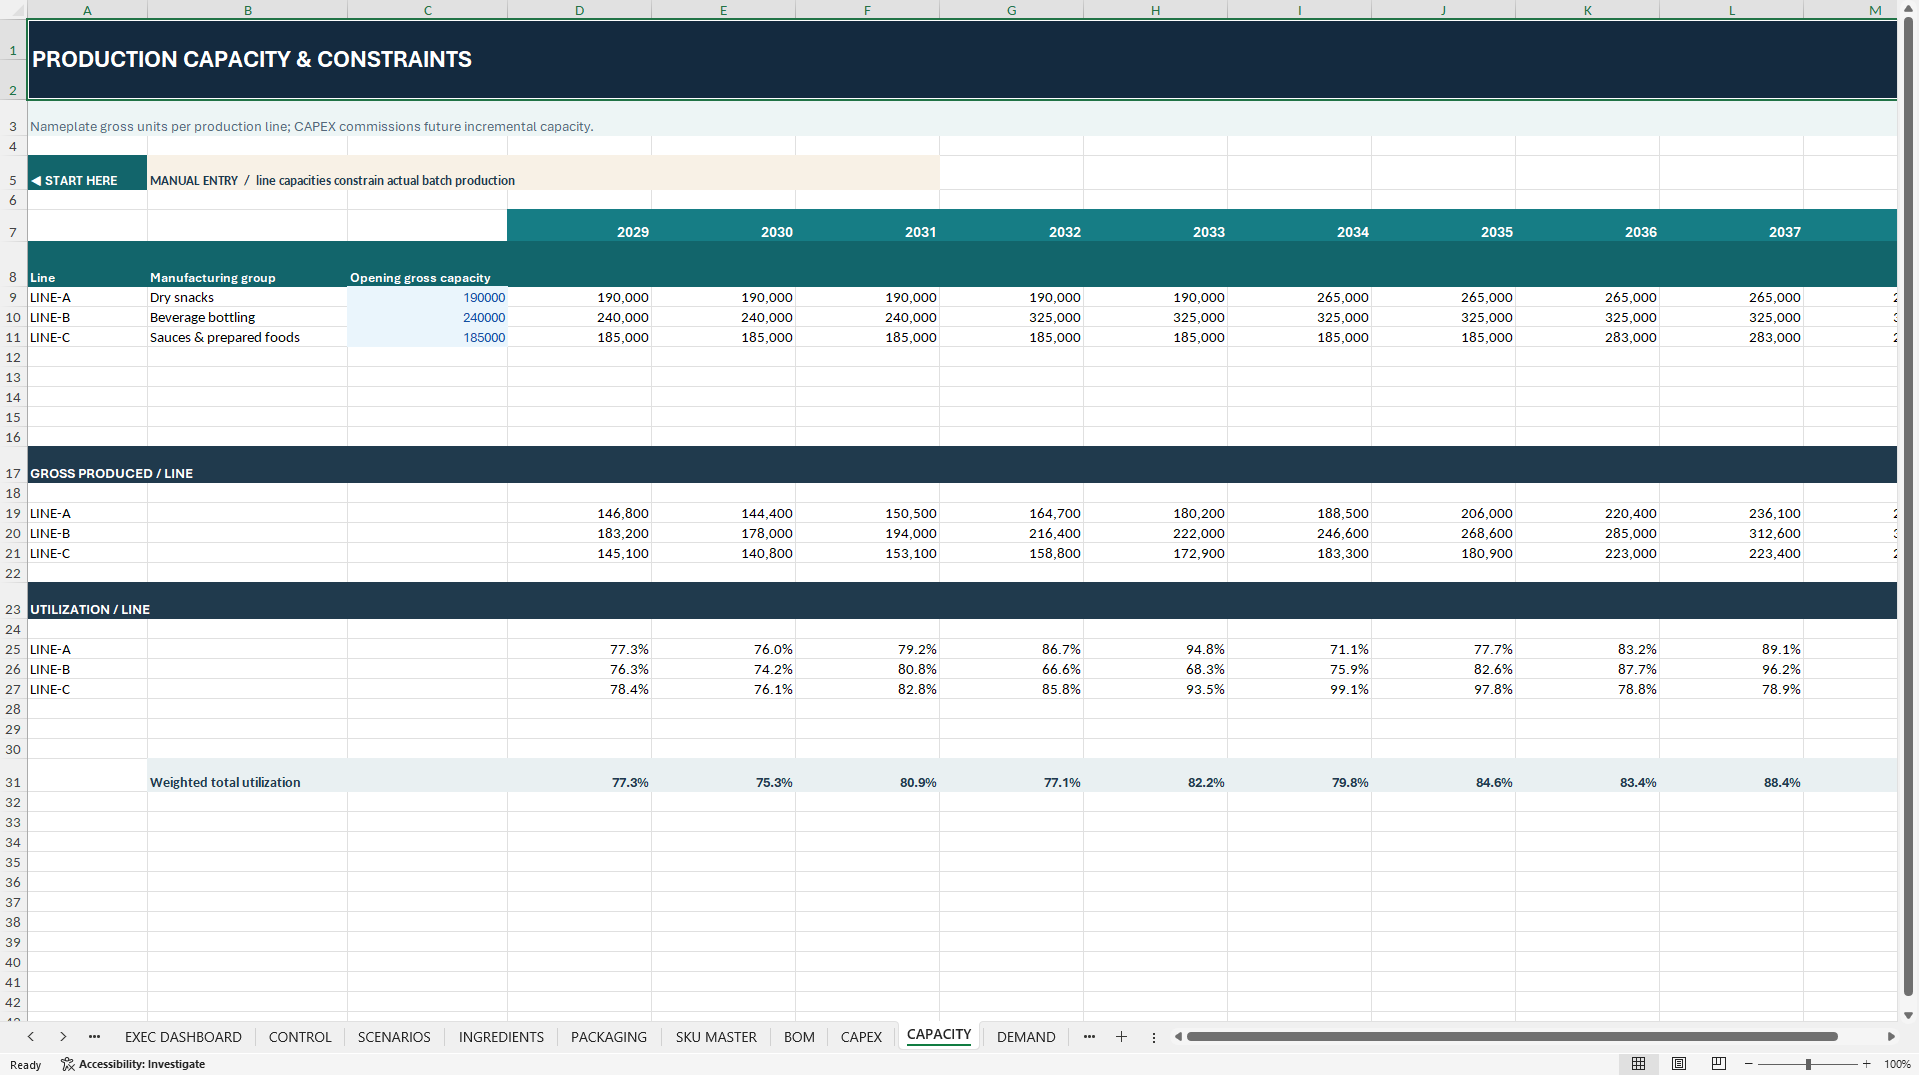
Model three production lines using editable nameplate capacity and capital investment that adds capacity over time. The forecast schedules production in whole batches at annual resolution, then applies the saleable yield to gross output.
Demand and shipments are tracked separately. Revenue is recognized on modeled shipments, so the forecast does not turn unmet demand into sales. Utilization measures production against gross nameplate capacity. It is not an OEE measure or a shift schedule.
📦 INVENTORY, WAREHOUSING & WORKING CAPITAL
Follow finished-goods quantities and costs through opening inventory, production, shipments and closing balances. The model applies annual weighted-average costing to finished goods and estimates raw-material and packaging inventory requirements.
Review warehousing, direct fulfillment, wholesale freight, receivables, payables, inventory days and the cash conversion cycle. The workbook is a financial planning model, not an ERP, lot-tracing, expiry-management or food-safety system.
📑 THREE LINKED FINANCIAL STATEMENTS
The Income Statement, Cash Flow Statement and Balance Sheet connect shipment revenue, finished-goods cost of sales, factory overhead, SG&A, marketing, CAPEX, depreciation, term debt and simplified income taxes.
Trace EBITDA through operating cash flow, working-capital changes, capital spending and debt service to closing cash. The cash flow schedule also shows modeled shareholder distributions subject to the workbook's cash constraints.
🔀 FOUR EDITABLE OPERATING SCENARIOS
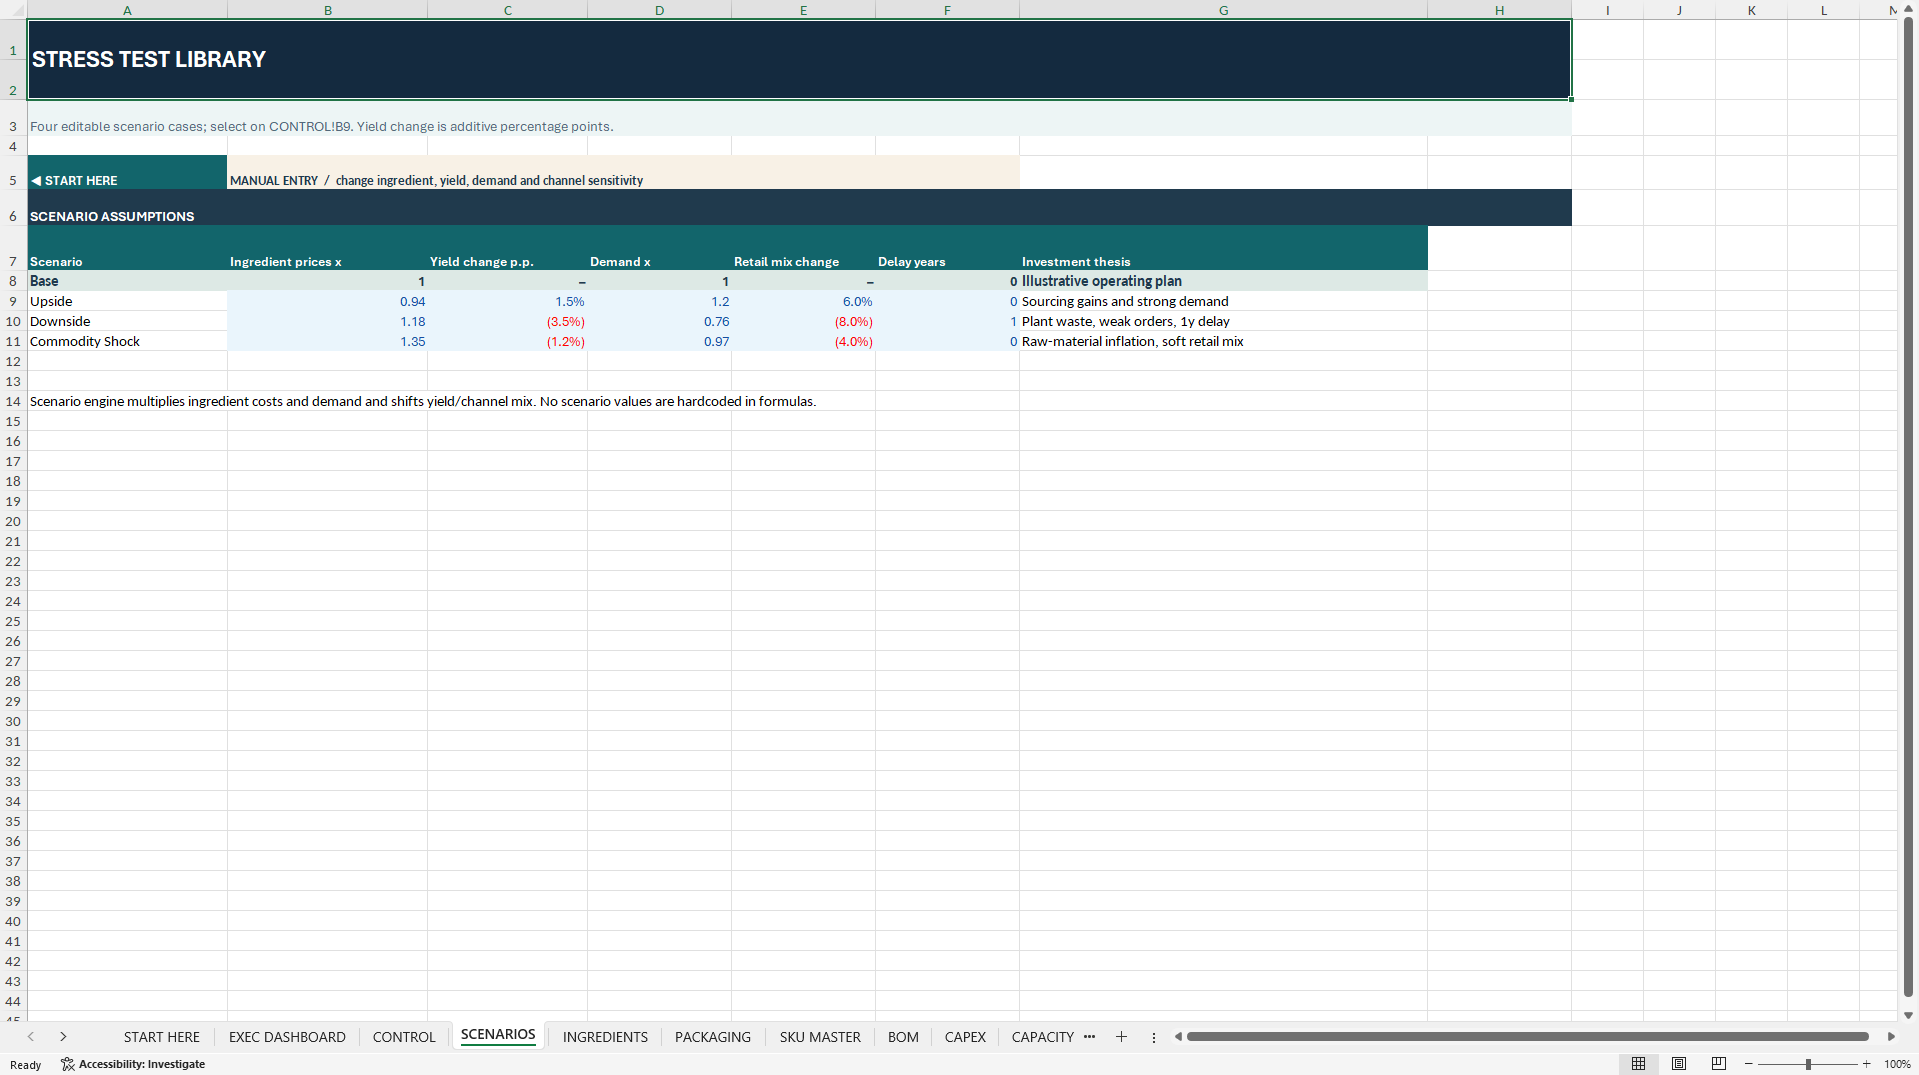
Switch between Base, Upside, Downside and Commodity Shock. Each case can change ingredient costs, effective production yield, demand, direct-retail share and launch timing. One scenario is active at a time.
The fictional Upside case illustrates how stronger demand can leave more orders unserved when production is constrained. The fictional Downside case delays launch, produces an EBITDA loss in Year 1 and shows a negative year-end cash balance in Year 2. The workbook flags funding pressure. It does not automatically add borrowing to cover a shortfall.
📈 INVESTOR RETURNS & YEAR-10 EXIT
Review modeled investor equity IRR, multiple on invested capital (MOIC) and equity NPV. The investor cash-flow series starts with the initial equity contribution, incorporates modeled distributions and includes hypothetical exit proceeds in Year 10.
The exit uses an editable EBITDA multiple and adjusts for closing debt and cash to estimate equity proceeds. The multiple is illustrative and is not benchmarked to actual transactions.
📊 EXECUTIVE DASHBOARD & MODEL CHECKS
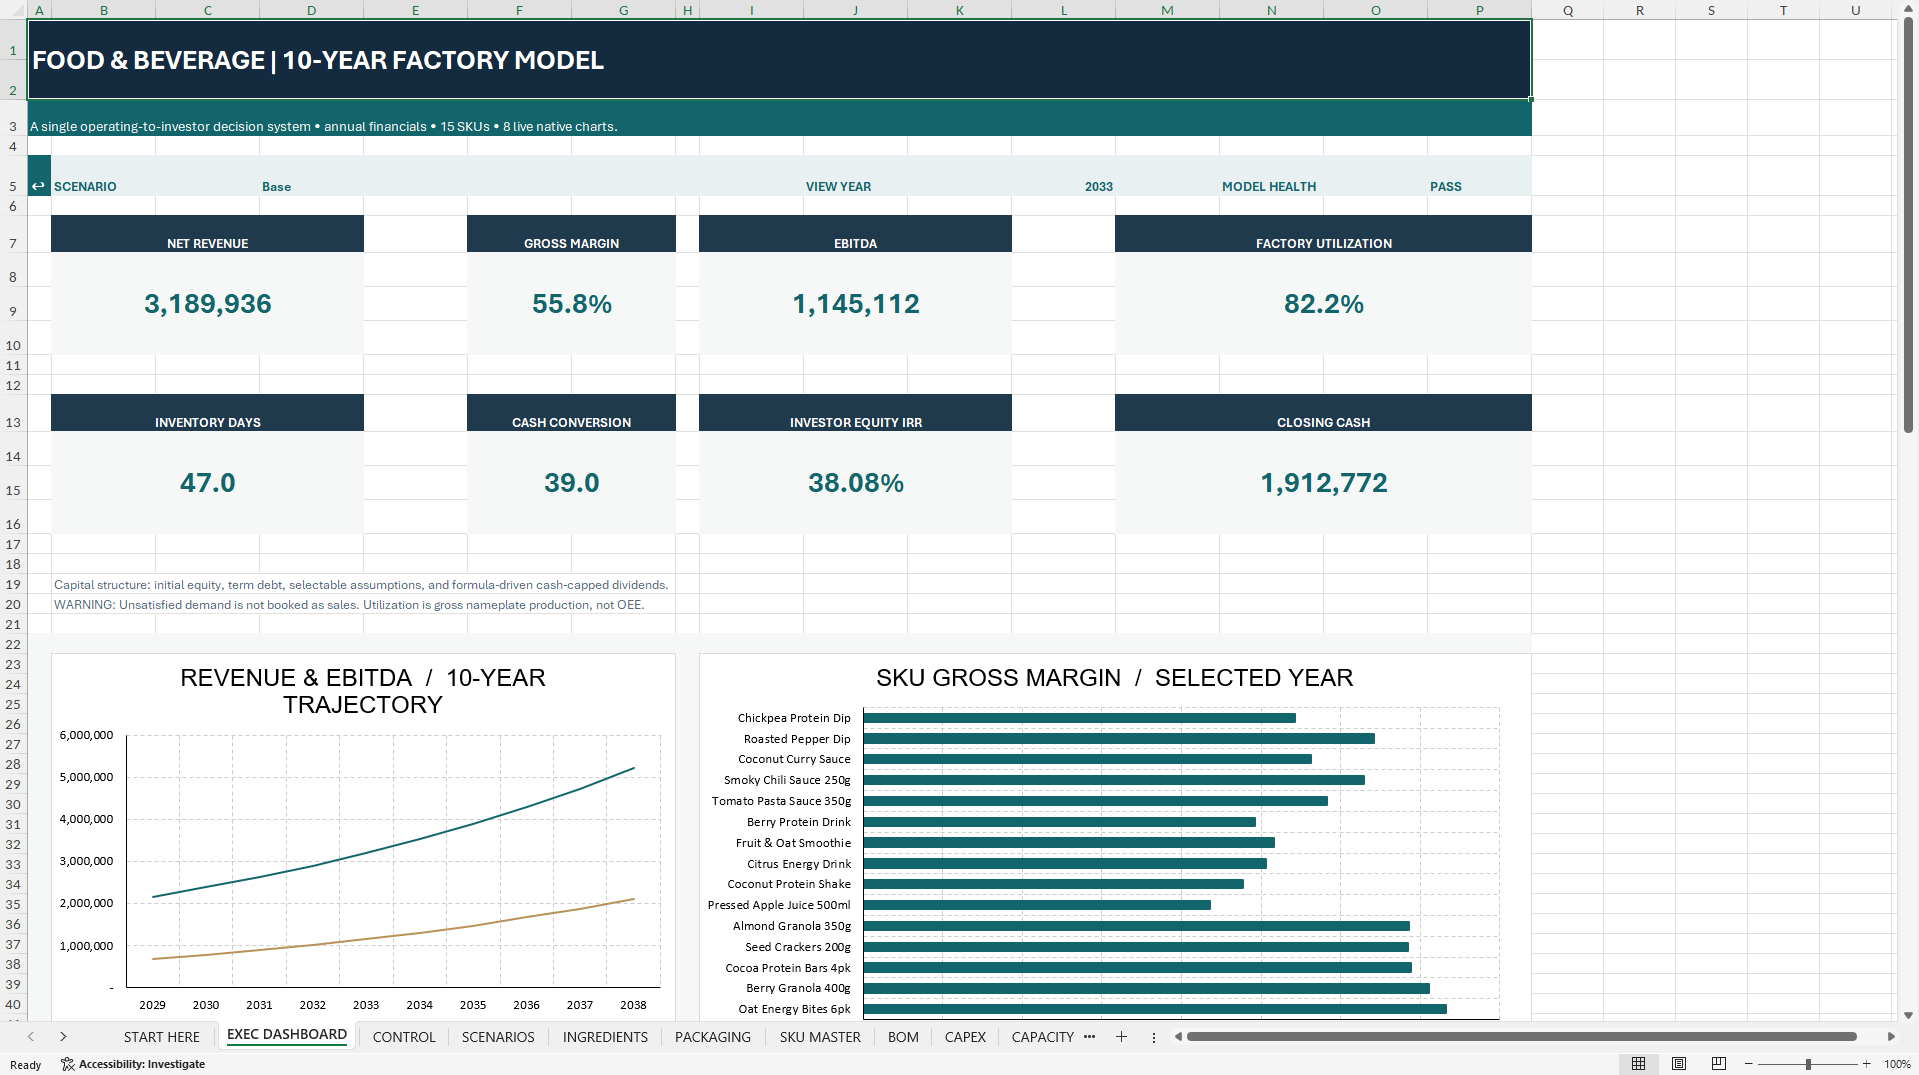
The dashboard presents eight KPIs covering net revenue, gross margin, EBITDA, factory utilization, inventory days, cash conversion cycle, investor equity IRR and closing cash.
Eight native Excel charts show revenue versus EBITDA, selected-year SKU margins, utilization by production line, revenue by channel, inventory days and cash cycle, cash versus debt, manufacturing cost drivers, and operating cash flow versus CAPEX.
MODEL CHECKS tests financial balances, debt and fixed-asset movements, production quantities, inventory costing, SKU revenue and unit costs. Economic WATCH flags separately identify unmet demand, cash below reserve, negative EBITDA and elevated inventory days. A technical PASS does not establish profitability or funding adequacy.
📘 WHAT YOU RECEIVE
• One editable, macro-free Excel workbook with 24 linked worksheets, 10 annual periods, 15 SKU positions, 500 prepared BOM rows, 3 production lines, 4 scenarios and 8 native dashboard charts.
• One 28-page English PDF guide covering setup, recipe costing, yield, production capacity, inventory, financing, valuation, model checks and troubleshooting.
🧭 GETTING STARTED
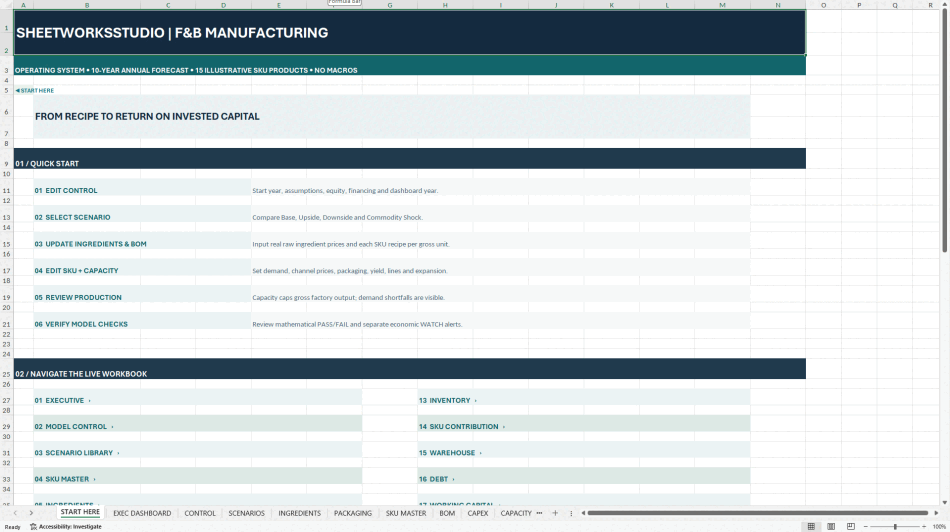
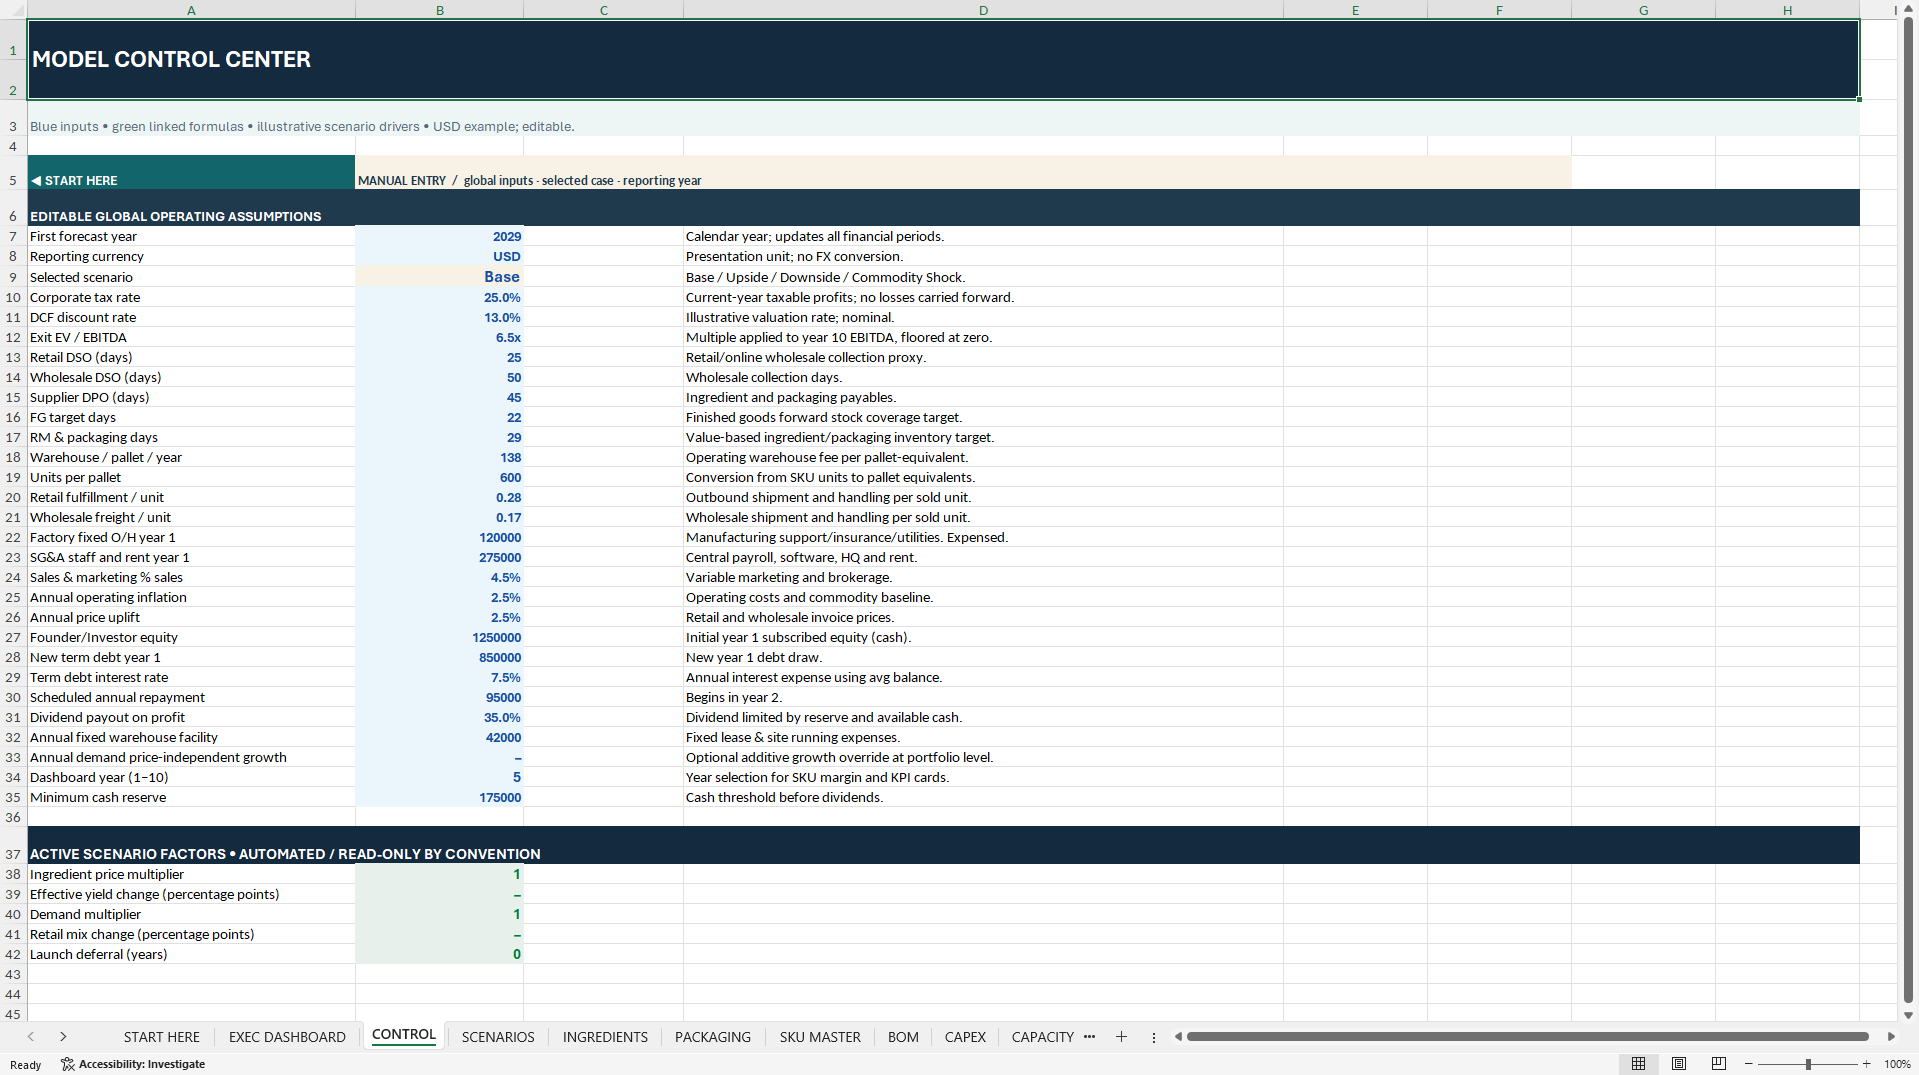
Save a working copy and begin in START HERE. Set the forecast year, scenario and global assumptions in CONTROL. Replace the sample ingredient, packaging, BOM and SKU inputs, then review line capacity and capital spending. After each material change, review production, working capital, all three financial statements and MODEL CHECKS before interpreting returns.
⚙️ COMPATIBILITY & SCOPE
The fictional example runs from 2029 to 2038 across ten annual periods. It is not a 120-month forecast. The workbook requires no macros, add-ins, live APIs or external workbook data feeds. Microsoft Excel Desktop is recommended. Native Excel Desktop opening, recalculation and saving, and Google Sheets import have not been independently verified. The reporting currency label does not perform FX conversion.
🛡️ INDEPENDENT TEMPLATE
Developed by SheetworksStudio as an independent, unofficial financial planning template. All sample businesses, inputs and outputs are fictional. The model is not an audit, lender-approved forecast, factory feasibility certification or source of accounting, tax, investment or food-safety advice. Validate assumptions and outputs before using the model for business decisions.
Got a question about the product? Email us at support@flevy.com or ask the author directly by using the "Ask the Author a Question" form. If you cannot view the preview above this document description, go here to view the large preview instead.
Source: Best Practices in Food & Beverage Industry, Integrated Financial Model Excel: Food & Beverage Manufacturing Financial Model Excel (XLSX) Spreadsheet, SheetworksStudio
ABOUT THE AUTHOR

SheetworksStudio creates premium Excel-based business templates, dashboards, trackers, financial models, and management systems for professionals, consultants, entrepreneurs, and organizations.
Our portfolio covers finance, project management, operations, risk management, compliance, AI governance, HR, supply chain, performance management, and business planning. Each product is designed to
... [read more]
Ask the Author a Question
You must be logged in to contact the author.