
General Insurance Company 10-Year Financial Model – Excel XLSX
Excel (XLSX)
BENEFITS OF THIS DOWNLOADABLE EXCEL DOCUMENT
- Provides a structured framework for forecasting the financial performance of a general insurance business over a 10-year period.
- Enables insurance companies and InsurTech startups to model premiums, claims, reinsurance, and profitability in a single integrated system.
- Helps founders, analysts, and investors plan growth, evaluate risk, and build investor-ready financial projections for an insurance company.
INSURANCE EXCEL DESCRIPTION
Curated by McKinsey-trained Executives
🛡️ General Insurance Financial Model (10-Year Forecast)
The Complete Financial Planning & Forecasting System for Insurance Companies, InsurTech Startups, and Underwriting Businesses 📊
The General Insurance Financial Model is a fully integrated 10-year financial forecasting Excel workbook built specifically for insurance companies, underwriting businesses, and InsurTech platforms.
This model allows you to project and analyze:
• policy growth
• premium revenue
• claims and loss ratios
• reinsurance structures
• underwriting profitability
• investment portfolio income
• operating expenses
• capital investments
• full 3-statement financial projections
All financial projections are driven by core insurance industry operating drivers – not simple revenue growth assumptions.
No generic templates.
No simplified financial calculators.
Just a structured insurance financial model designed around how real insurance companies actually operate.
📊 Built Around Real Insurance Industry Revenue Drivers
Unlike generic financial templates, this model reflects the real economics of a general insurance business.
Insurance companies generate revenue from multiple sources including:
• insurance premiums
• underwriting margins
• investment income
• reinsurance strategies
• portfolio returns
Each of these drivers is modeled using operational assumptions defined in the Assumptions sheet and calculated across the 10-year forecast period.
📑 Policy & Underwriting Model
The Policy Model sheet is the core operational engine of the financial model.
It tracks the growth of insurance policies, premium generation, and underwriting activity over the entire forecast period.
Key underwriting drivers include:
• Starting number of policies
• Annual policy growth rate
• Average premium per policy
• Policy retention rate
• Customer acquisition growth
• Policy mix assumptions
From these inputs, the model automatically calculates:
• Total policies in force
• Gross written premiums
• Premium growth across the forecast horizon
These metrics then drive the entire revenue structure of the insurance company.
💰 Premium Revenue Model
Insurance premium revenue is generated from policies written and renewed across the client base.
The model calculates premium revenue using:
• Policies in force
• Average premium per policy
• Annual policy growth assumptions
As policy volume grows, the model automatically scales:
• gross written premiums
• net written premiums
• premium revenue over time
This allows users to simulate realistic premium growth trajectories.
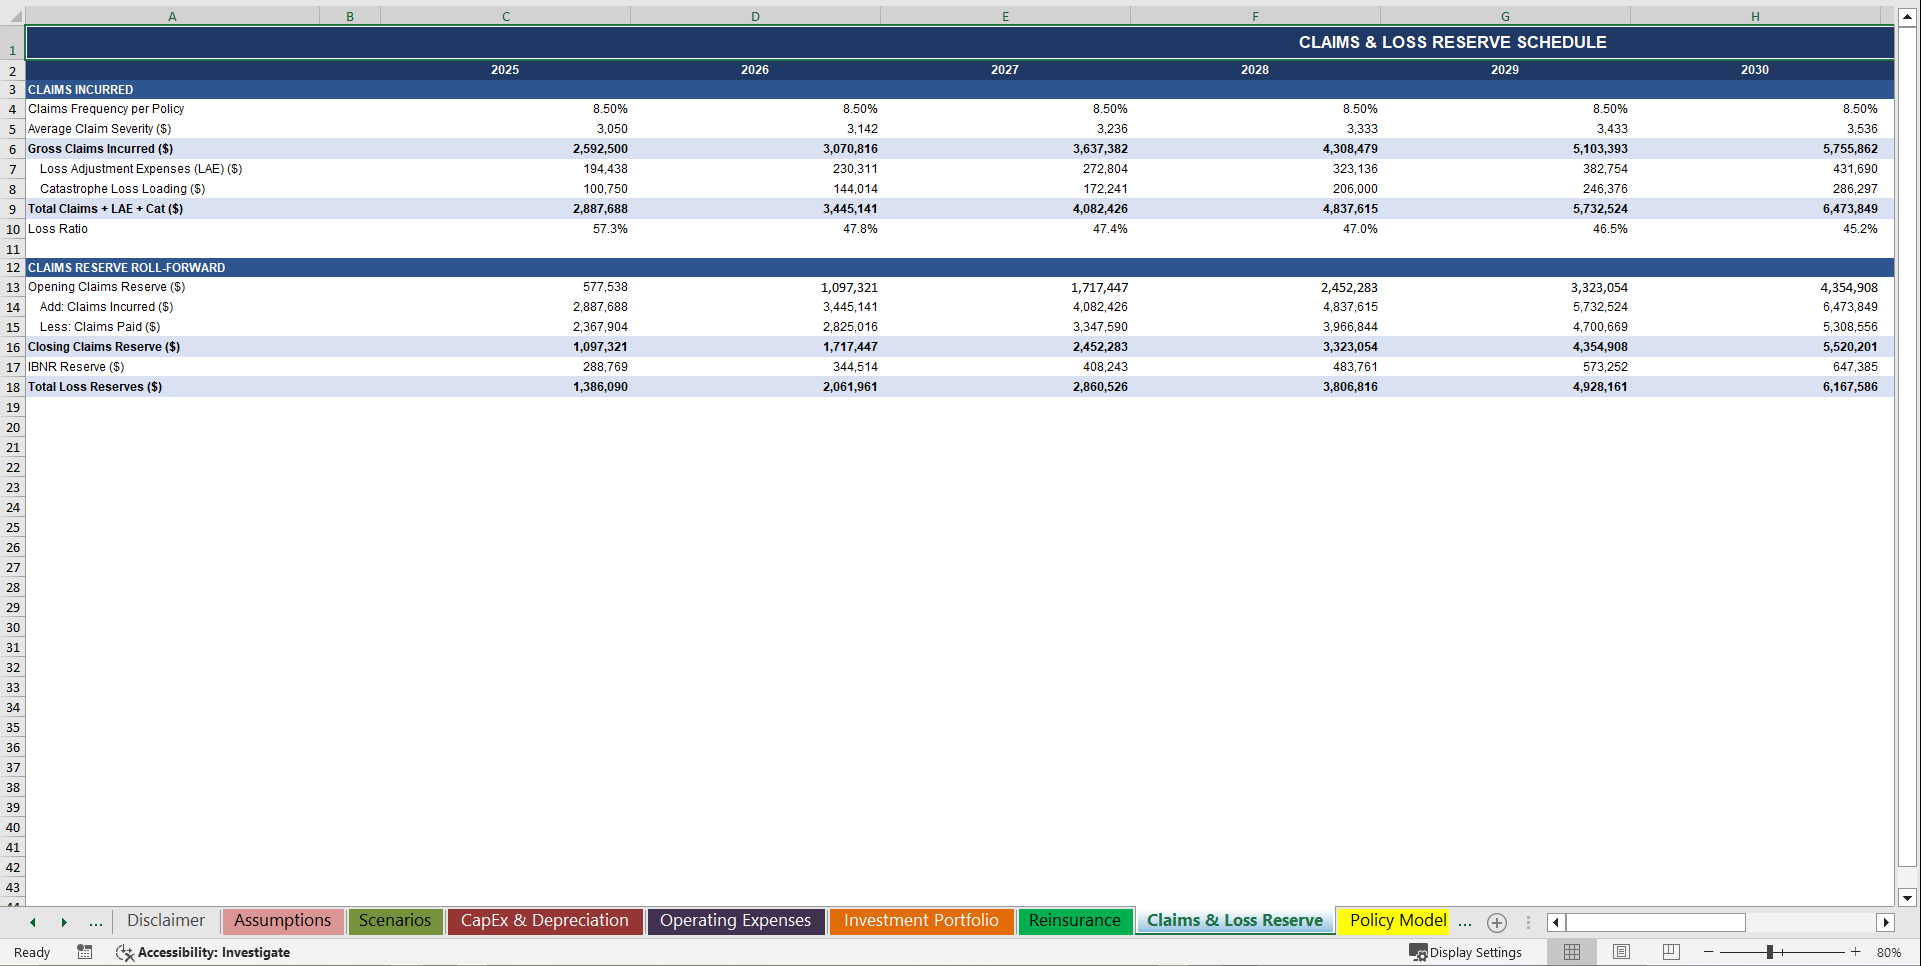
📉 Claims & Loss Ratio Modeling
The Claims & Loss Reserve Schedule models one of the most critical components of any insurance business: claims payments.
Claims expenses are calculated using:
• Loss ratio assumptions
• Premium volume
• Claims development patterns
The model calculates:
• Claims incurred
• Claims paid
• Outstanding claims reserves
• Total loss expense
This structure allows users to test how different loss ratios impact profitability and capital requirements.
🔁 Reinsurance Strategy Modeling
The Reinsurance Schedule sheet models how insurance companies transfer risk to reinsurers.
The model tracks:
• premiums ceded to reinsurers
• reinsurance coverage ratios
• net retained premiums
• reinsurance recoveries
Reinsurance allows insurers to reduce catastrophic exposure and stabilize underwriting results.
The financial model shows how reinsurance strategies affect:
• underwriting profit
• capital risk
• net revenue.
📈 Investment Portfolio Income
Insurance companies generate significant revenue from investing their premium reserves.
The Investment Portfolio sheet models the company's investment strategy.
Key investment assumptions include:
• portfolio size
• annual portfolio growth
• investment return rate
• asset allocation assumptions
The model calculates:
• investment income
• portfolio growth over time
• contribution of investments to total company profitability
This reflects the dual revenue structure of insurance companies: underwriting + investments.
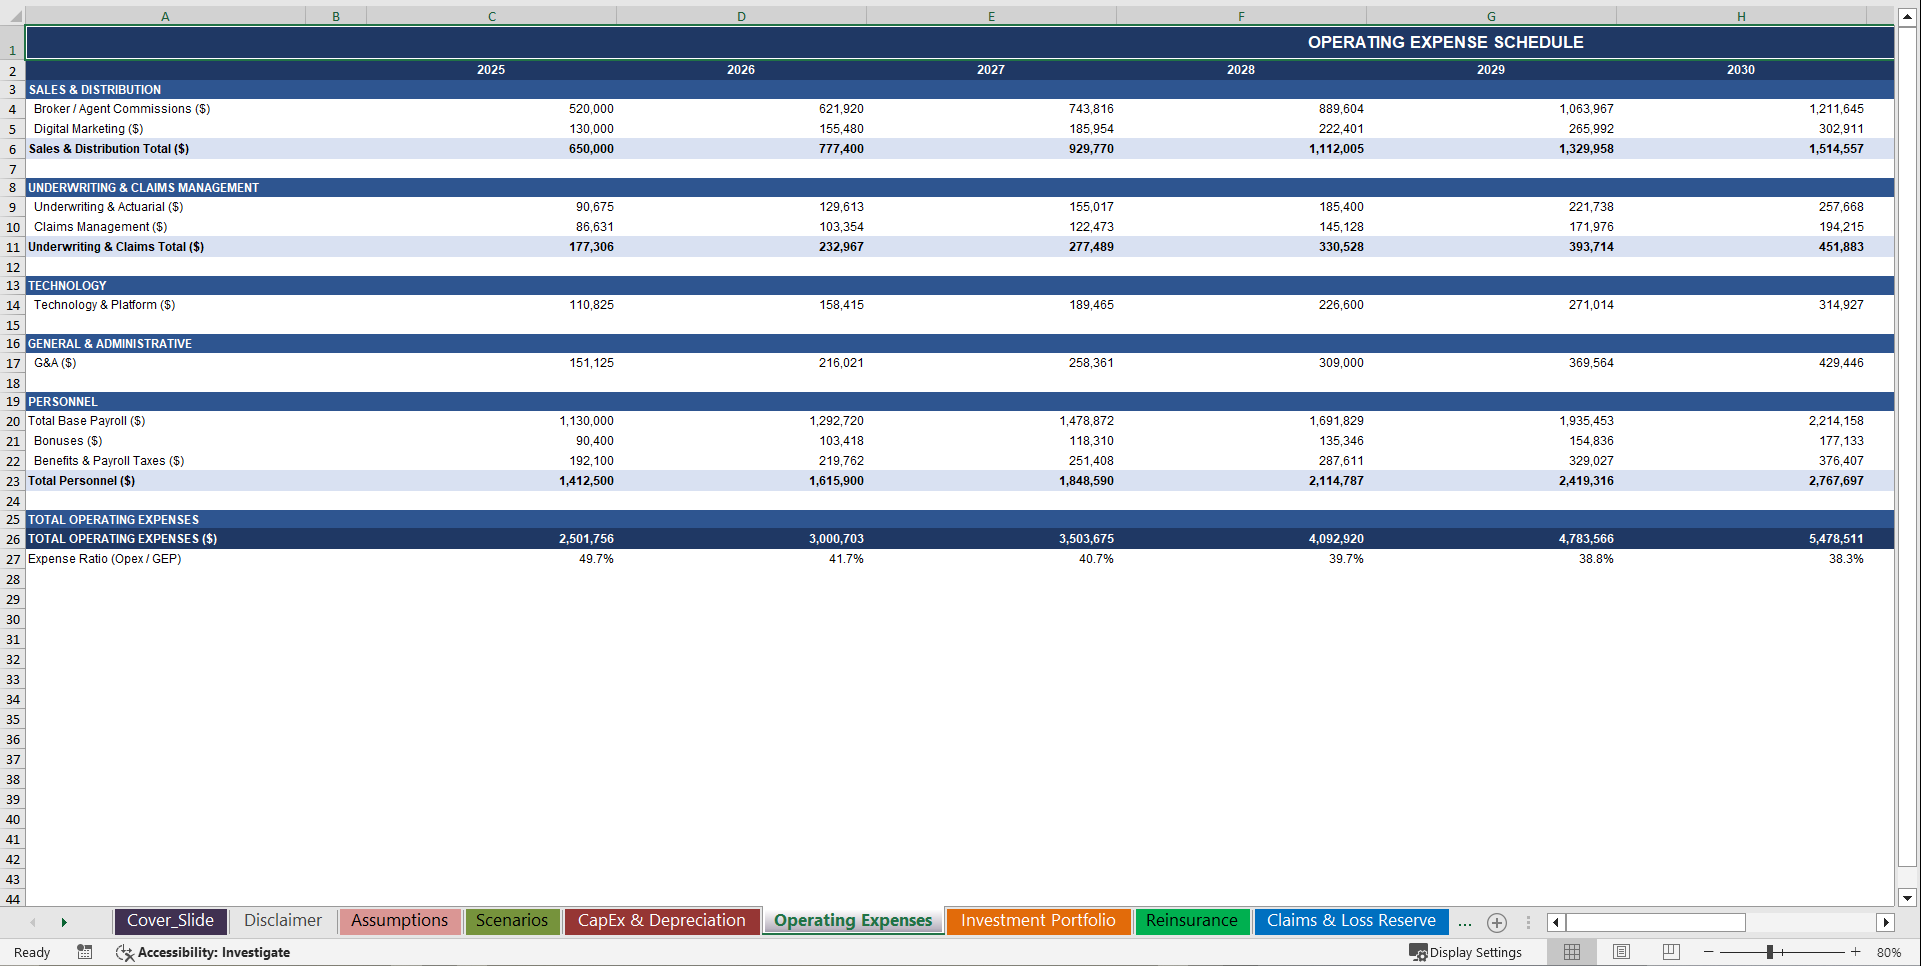
🧾 Operating Expense Structure
The Operating Expenses sheet models the cost structure required to run an insurance company.
Expense categories included in the model:
Sales & Distribution
• insurance agents
• broker commissions
• policy acquisition costs
• marketing expenses
Administrative Expenses
• executive salaries
• underwriting staff
• compliance & regulatory costs
• office overhead
• IT infrastructure
Technology & Systems
Insurance platforms require specialized technology such as:
• underwriting systems
• claims management systems
• policy administration software
• cloud infrastructure
These costs are fully modeled in the operating expense structure.
🏗 Capital Expenditures & Infrastructure Investment
The CapEx & Depreciation Schedule models long-term investments required to grow the insurance company.
Capital investments may include:
• technology platforms
• claims management systems
• underwriting software
• data infrastructure
• office equipment
• digital insurance platforms
The model tracks:
• annual capital expenditures
• accumulated asset balances
• depreciation expense.
📉 Depreciation Schedule
All capital assets are depreciated using straight-line depreciation.
Depreciation is tracked across asset categories including:
• software systems
• IT infrastructure
• office assets
• technology platforms
Depreciation flows automatically into:
• the Income Statement
• the Cash Flow Statement
• the Balance Sheet.
💼 Insurance Reserve & Risk Management Modeling
The model incorporates insurance reserve accounting structures commonly used in the industry.
Reserve calculations include:
• loss reserves
• claims liabilities
• outstanding claim obligations
These reserves ensure the company maintains financial solvency and regulatory compliance.
💵 Fully Integrated 3-Statement Financial Model
All operational assumptions feed directly into a fully integrated financial model including:
• Income Statement
• Cash Flow Statement
• Balance Sheet
Changing a single assumption updates the entire financial model automatically.
📑 Income Statement
The Income Statement tracks the profitability of the insurance company.
Metrics included:
• premium revenue
• reinsurance expenses
• claims expenses
• underwriting profit
• investment income
• operating expenses
• EBITDA
• taxes
• net income
💰 Cash Flow Statement
The Cash Flow Statement (Indirect Method) tracks the company's liquidity.
Sections include:
Operating Activities
• net income
• changes in reserves
• working capital adjustments
Investing Activities
• capital expenditures
• investment portfolio growth
Financing Activities
• capital injections
• shareholder distributions
This allows users to track cash generation and capital requirements.
🧾 Balance Sheet
The Balance Sheet shows the financial position of the insurance company.
Assets include:
• cash
• investment portfolio
• accounts receivable
• capital assets
Liabilities include:
• claims reserves
• reinsurance obligations
• operating liabilities
Equity includes:
• shareholder capital
• retained earnings.
📊 Scenario & Sensitivity Analysis
The Scenario Analysis sheet allows users to stress test different operating environments.
Included scenarios:
• Base Case
• High Growth
• Recession
• Catastrophic Loss Event
• Interest Rate Shock
Each scenario automatically adjusts assumptions such as:
• policy growth
• loss ratios
• premium pricing
• claims costs
Users can instantly see how these changes impact profitability and solvency.
📈 Executive Dashboard
The Executive Dashboard sheet provides a visual overview of the insurance company's performance.
The dashboard includes charts and KPIs such as:
• premium growth
• policy growth
• claims ratios
• underwriting profit
• investment income
• net profit
• financial performance over the 10-year forecast
All charts update automatically when assumptions change.
⚙️ Simple Professional Input Structure
The model uses a clean, professional Excel input system.
All major inputs are centralized in the Assumptions sheet, including:
• policy growth assumptions
• premium pricing
• loss ratios
• investment returns
• operating cost drivers
• capital expenditure assumptions
Changing an assumption instantly updates the entire financial model.
📊 Complete Workbook Structure
The model includes 14 structured Excel worksheets:
1️⃣ Cover Slide
2️⃣ Disclaimer
3️⃣ Assumptions
4️⃣ Scenario Analysis
5️⃣ Policy & Underwriting Model
6️⃣ Claims & Loss Reserve Schedule
7️⃣ Reinsurance Schedule
8️⃣ Investment Portfolio
9️⃣ Operating Expenses
🔟 CapEx & Depreciation
1️⃣1️⃣ Income Statement
1️⃣2️⃣ Cash Flow Statement
1️⃣3️⃣ Balance Sheet
1️⃣4️⃣ Executive Dashboard
🎯 Who This Financial Model Is For
This model is designed for:
✔ Insurance startups
✔ General insurance companies
✔ InsurTech platforms
✔ underwriting businesses
✔ insurance consultants
✔ financial analysts
✔ venture capital investors
✔ insurance founders raising capital
✔ strategic planners and CFOs
If your business writes insurance policies, manages claims risk, and invests premium reserves, this model provides a complete financial forecasting system.
🚀 Build and Scale a Profitable Insurance Company
The General Insurance Financial Model connects:
• underwriting activity
• premium revenue
• claims risk
• reinsurance structures
• investment income
• operating costs
• capital investment
into a single integrated financial forecasting system.
Everything flows into:
📊 clear financial projections
📈 operational performance metrics
💰 full financial statements
A complete financial planning framework for building, analyzing, and scaling a modern insurance company.
✅ Perfect for financial planning
✅ Investor-ready projections
✅ Institutional-grade model structure
✅ 10-year forecasting horizon
Key Words:
Strategy & Transformation, Growth Strategy, Strategic Planning, Strategy Frameworks, Innovation Management, Pricing Strategy, Core Competencies, Strategy Development, Business Transformation, Marketing Plan Development, Product Strategy, Breakout Strategy, Competitive Advantage, Mission, Vision, Values, Strategy Deployment & Execution, Innovation, Vision Statement, Core Competencies Analysis, Corporate Strategy, Product Launch Strategy, BMI, Blue Ocean Strategy, Breakthrough Strategy, Business Model Innovation, Business Strategy Example, Corporate Transformation, Critical Success Factors, Customer Segmentation, Customer Value Proposition, Distinctive Capabilities, Enterprise Performance Management, KPI, Key Performance Indicators, Market Analysis, Market Entry Example, Market Entry Plan, Market Intelligence, Market Research, Market Segmentation, Market Sizing, Marketing, Michael Porter's Value Chain, Organizational Transformation, Performance Management, Performance Measurement, Platform Strategy, Product Go-to-Market Strategy, Reorganization, Restructuring, SWOT, SWOT Analysis, Service 4.0, Service Strategy, Service Transformation, Strategic Analysis, Strategic Plan Example, Strategy Deployment, Strategy Execution, Strategy Frameworks Compilation, Strategy Methodologies, Strategy Report Example, Value Chain, Value Chain Analysis, Value Innovation, Value Proposition, Vision Statement, Corporate Strategy, Business Development, Business plan pdf, business plan, PDF, Business Plan DOC, Business Plan Template, PPT, Market strategy playbook, strategic market planning, competitive analysis tools, market segmentation frameworks, growth strategy templates, product positioning strategy, market execution toolkit, strategic alignment playbook, KPI and OKR frameworks, business growth strategy guide, cross-functional strategy templates, market risk management, market strategy PowerPoint doc, guide, ebook, e-book ,McKinsey Change Playbook, Organizational change management toolkit, Change management frameworks 2025, Influence model for change, Change leadership strategies, Behavioral change in organizations, Change management PowerPoint templates, Transformational leadership in change, supply chain KPIs, supply chain KPI toolkit, supply chain PowerPoint template, logistics KPIs, procurement KPIs, inventory management KPIs, supply chain performance metrics, manufacturing KPIs, supply chain dashboard, supply chain strategy KPIs, reverse logistics KPIs, sustainability KPIs in supply chain, financial supply chain KPIs, warehouse KPIs, digital supply chain KPIs, 1200 KPIs, supply chain scorecard, KPI examples, supply chain templates, Corporate Finance SOPs, Finance SOP Excel Template, CFO Toolkit, Finance Department Procedures, Financial Planning SOPs, Treasury SOPs, Accounts Payable SOPs, Accounts Receivable SOPs, General Ledger SOPs, Accounting Policies Template, Internal Controls SOPs, Finance Process Standardization, Finance Operating Procedures, Finance Department Excel Template, FP&A Process Documentation, Corporate Finance Template, Finance SOP Toolkit, CFO Process Templates, Accounting SOP Package, Tax Compliance SOPs, Financial Risk Management Procedures.
NOTE: Our digital products are sold on an "as is" basis, making returns and refunds unavailable post-download. Please preview and inquire before purchasing. Please contact us before purchasing if you have any questions! This policy aligns with the standard Flevy Terms of Usage.
Got a question about the product? Email us at support@flevy.com or ask the author directly by using the "Ask the Author a Question" form. If you cannot view the preview above this document description, go here to view the large preview instead.
Source: Best Practices in Insurance, Integrated Financial Model Excel: General Insurance Company 10-Year Financial Model Excel (XLSX) Spreadsheet, SB Consulting
ABOUT THE AUTHOR
SB Consulting is dedicated to empowering businesses to communicate their ideas with impact. This consulting firm specializes in teaching organizations how to create effective corporate and management presentations. With training from top-tier global consulting firms, including McKinsey, BCG, and Porsche Consulting, extensive expertise in presentation design and ... [read more]
Ask the Author a Question
You must be logged in to contact the author.
