 Click main image to view in full screen. Unlock all 22 preview images:
Upstream Oil & Gas Project Finance Model – Excel XLSX
Excel (XLSX) + supplemental PDF


BENEFITS OF THIS DOWNLOADABLE EXCEL DOCUMENT
- 🛢️ Forecast production across 100 prepared well positions using Arps-style decline, well timing, availability and recoverable volume limits.
- 🏦 Identify when development spending, workovers and abandonment compete with debt service by tracing CFADS and DSCR through three linked financial statements.
- 📈 Compare project and equity returns across three scenarios and test 31 realized oil prices to estimate break-even under a fixed operating plan.
OIL & GAS EXCEL DESCRIPTION
🛢️ UPSTREAM OIL & GAS PROJECT FINANCE MODEL
Follow a multi-well development from first production to debt repayment and abandonment.
A project can show a positive net present value and still miss debt service in an individual year. This editable Excel model helps you see both outcomes by linking well-level production, recoverable reserves, realized commodity prices and field costs to development spending, financing and investor cash flow.
Designed for exploration and production teams, upstream investment analysts, petroleum consultants and project finance advisors, the workbook covers 20 annual forecast periods plus a separate Year 0 investment. The default example runs from 2029 to 2048. All sample wells, prices and results are fictional.
⚙️ WELL REGISTER & DECLINE CURVES
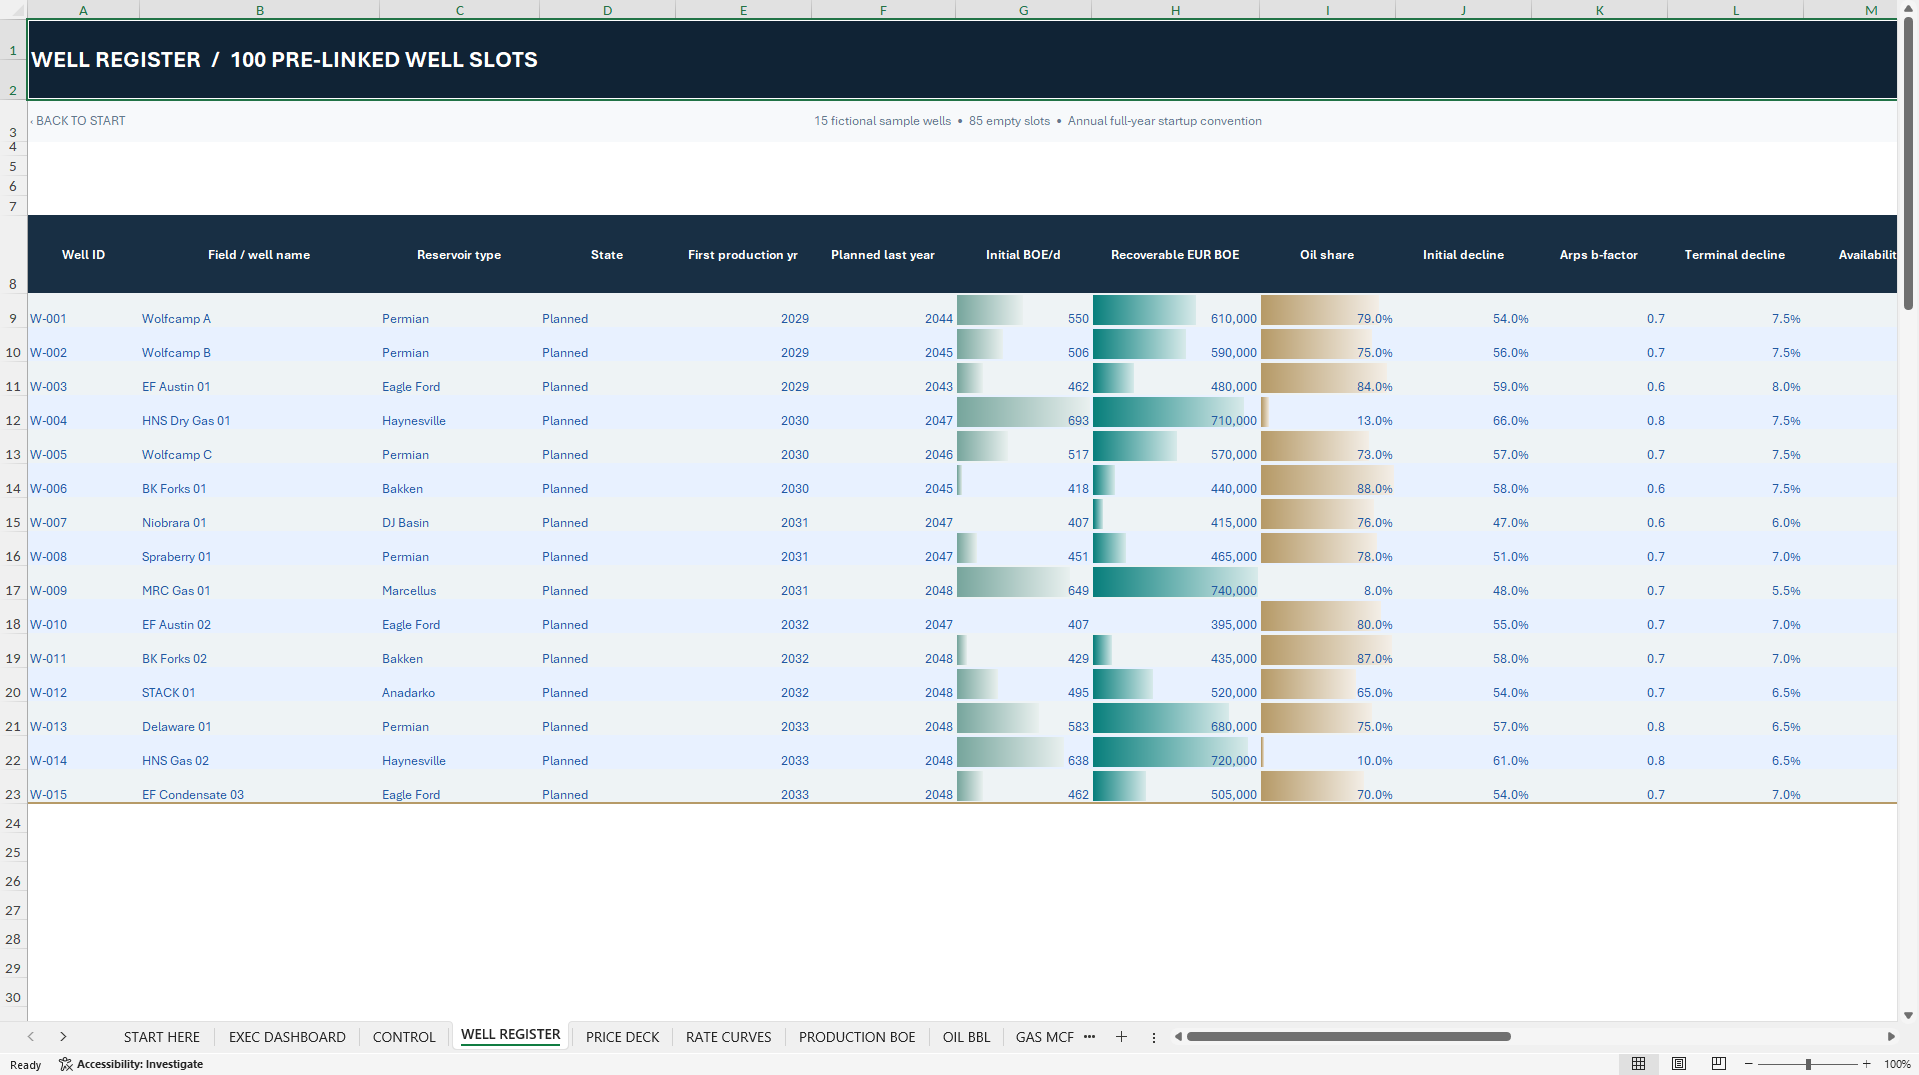
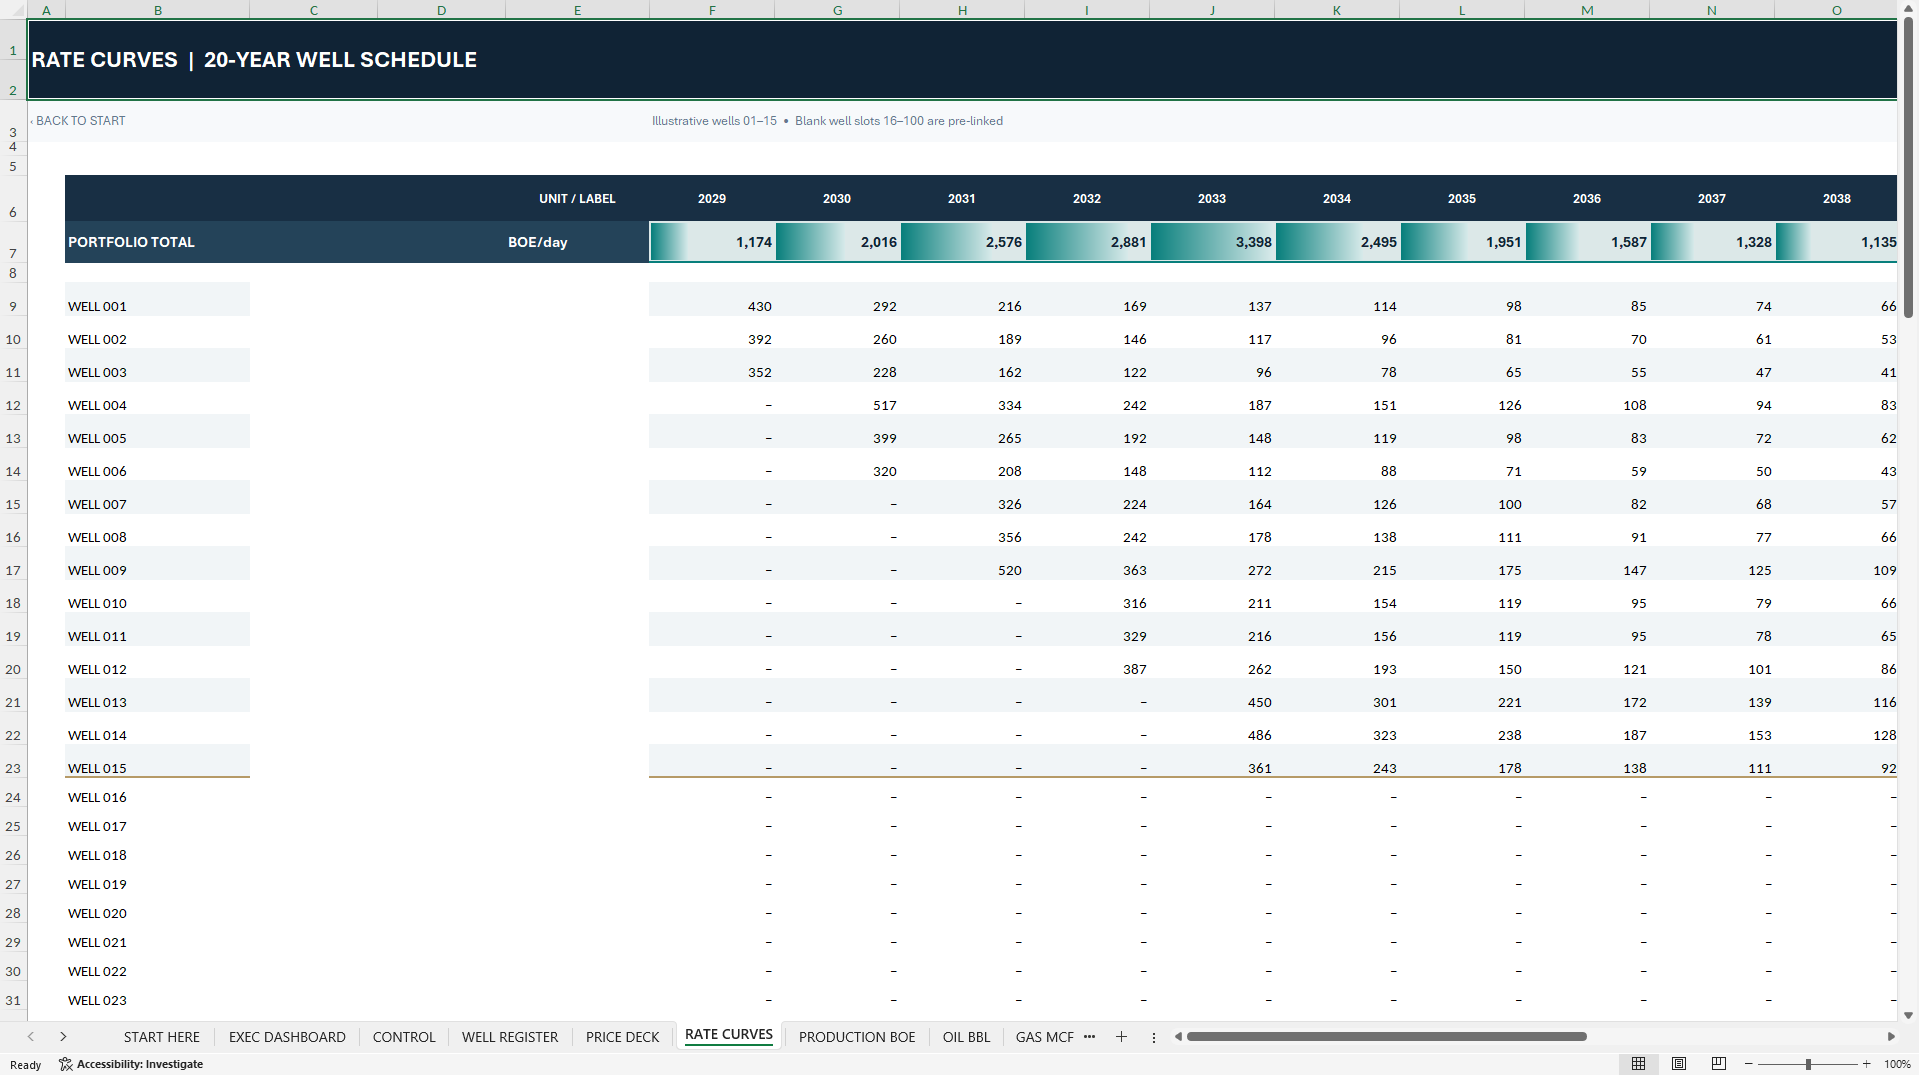
Start with 100 pre-linked well positions, including 15 illustrative wells and 85 prepared positions. Set each well's first and final production years, initial BOE per day, estimated ultimate recovery (EUR), oil share, initial decline, Arps b-factor, terminal decline and producing availability. Enter well-specific royalties, lifting costs, drilling and completion expenditure, workovers and plugging and abandonment costs.
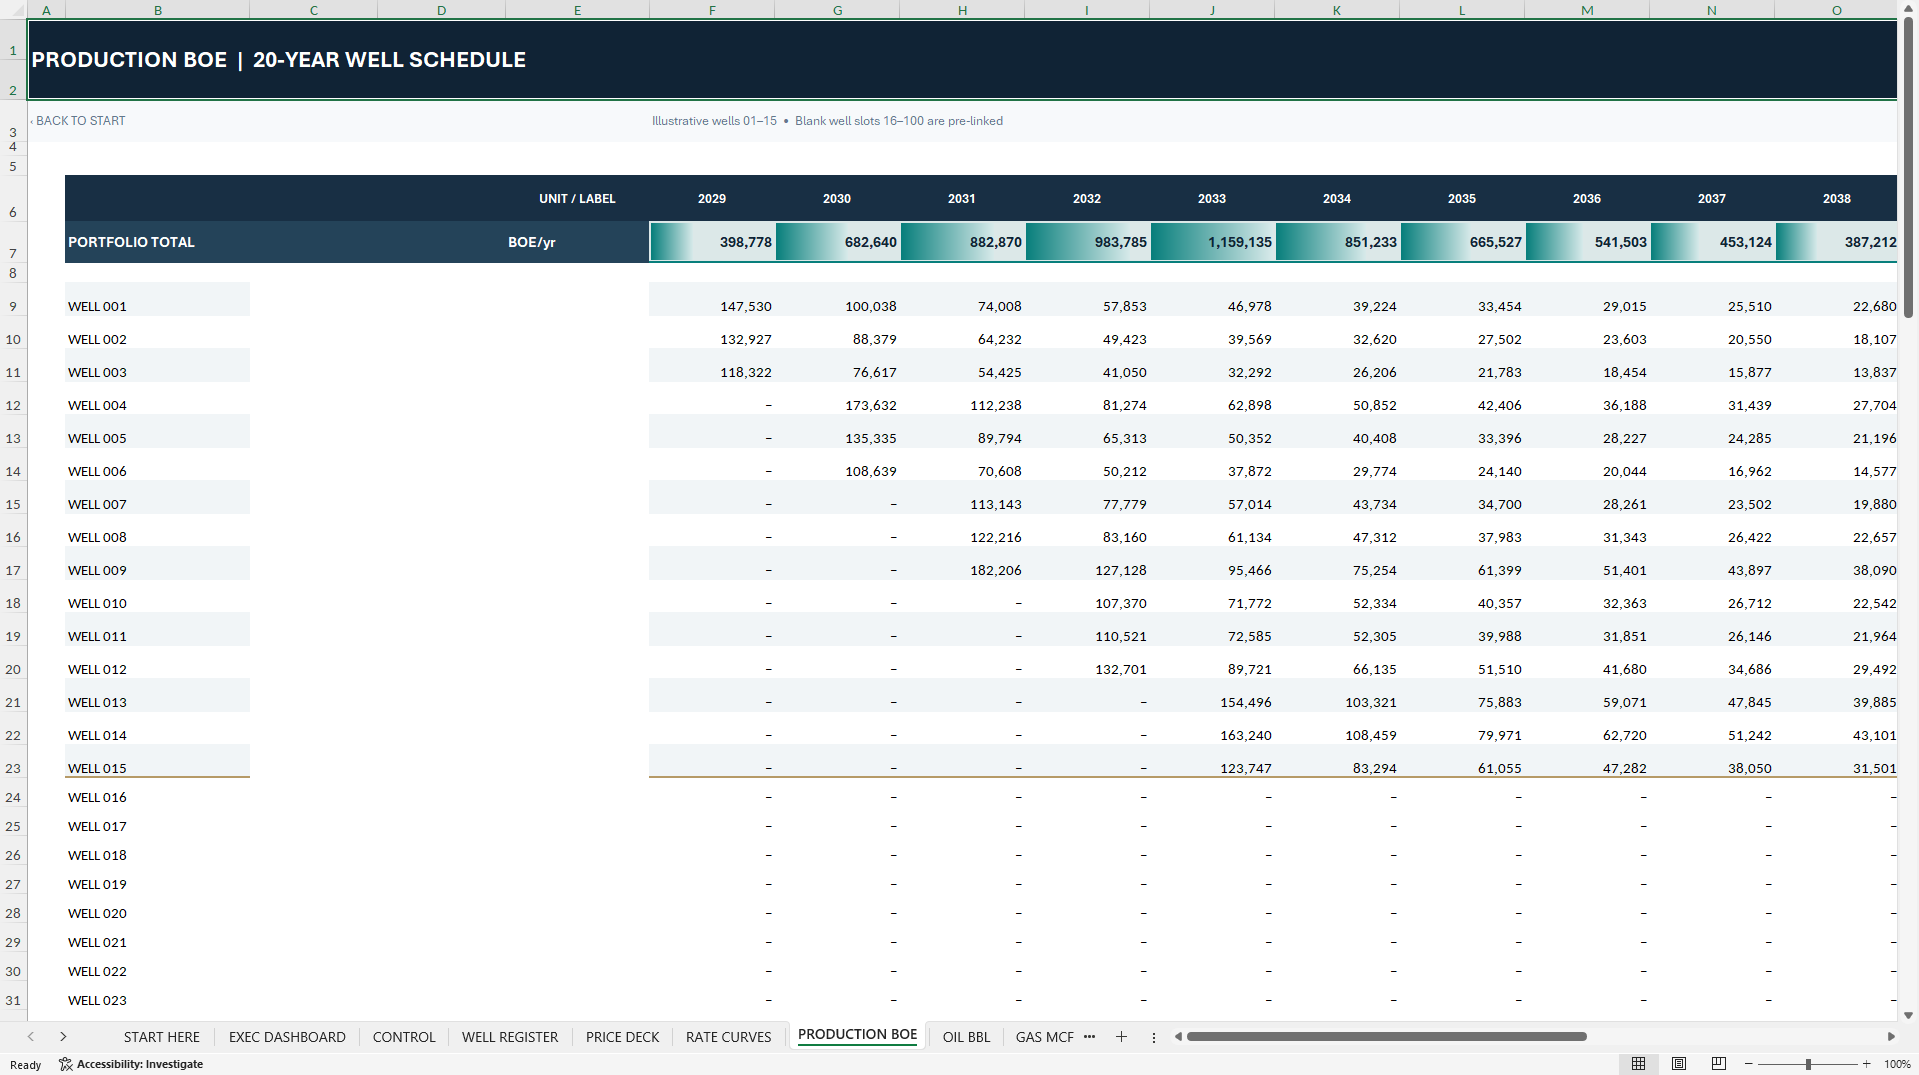
The production engine uses an annual midpoint-rate approximation with Arps-style decline and terminal exponential behavior. Modeled output reflects operating days, producing availability, the active scenario and remaining well-level EUR. Blank well positions do not generate output. The status field is descriptive and does not turn production on or off.
◈ OIL & GAS PRODUCTION, RESERVES & NETBACK
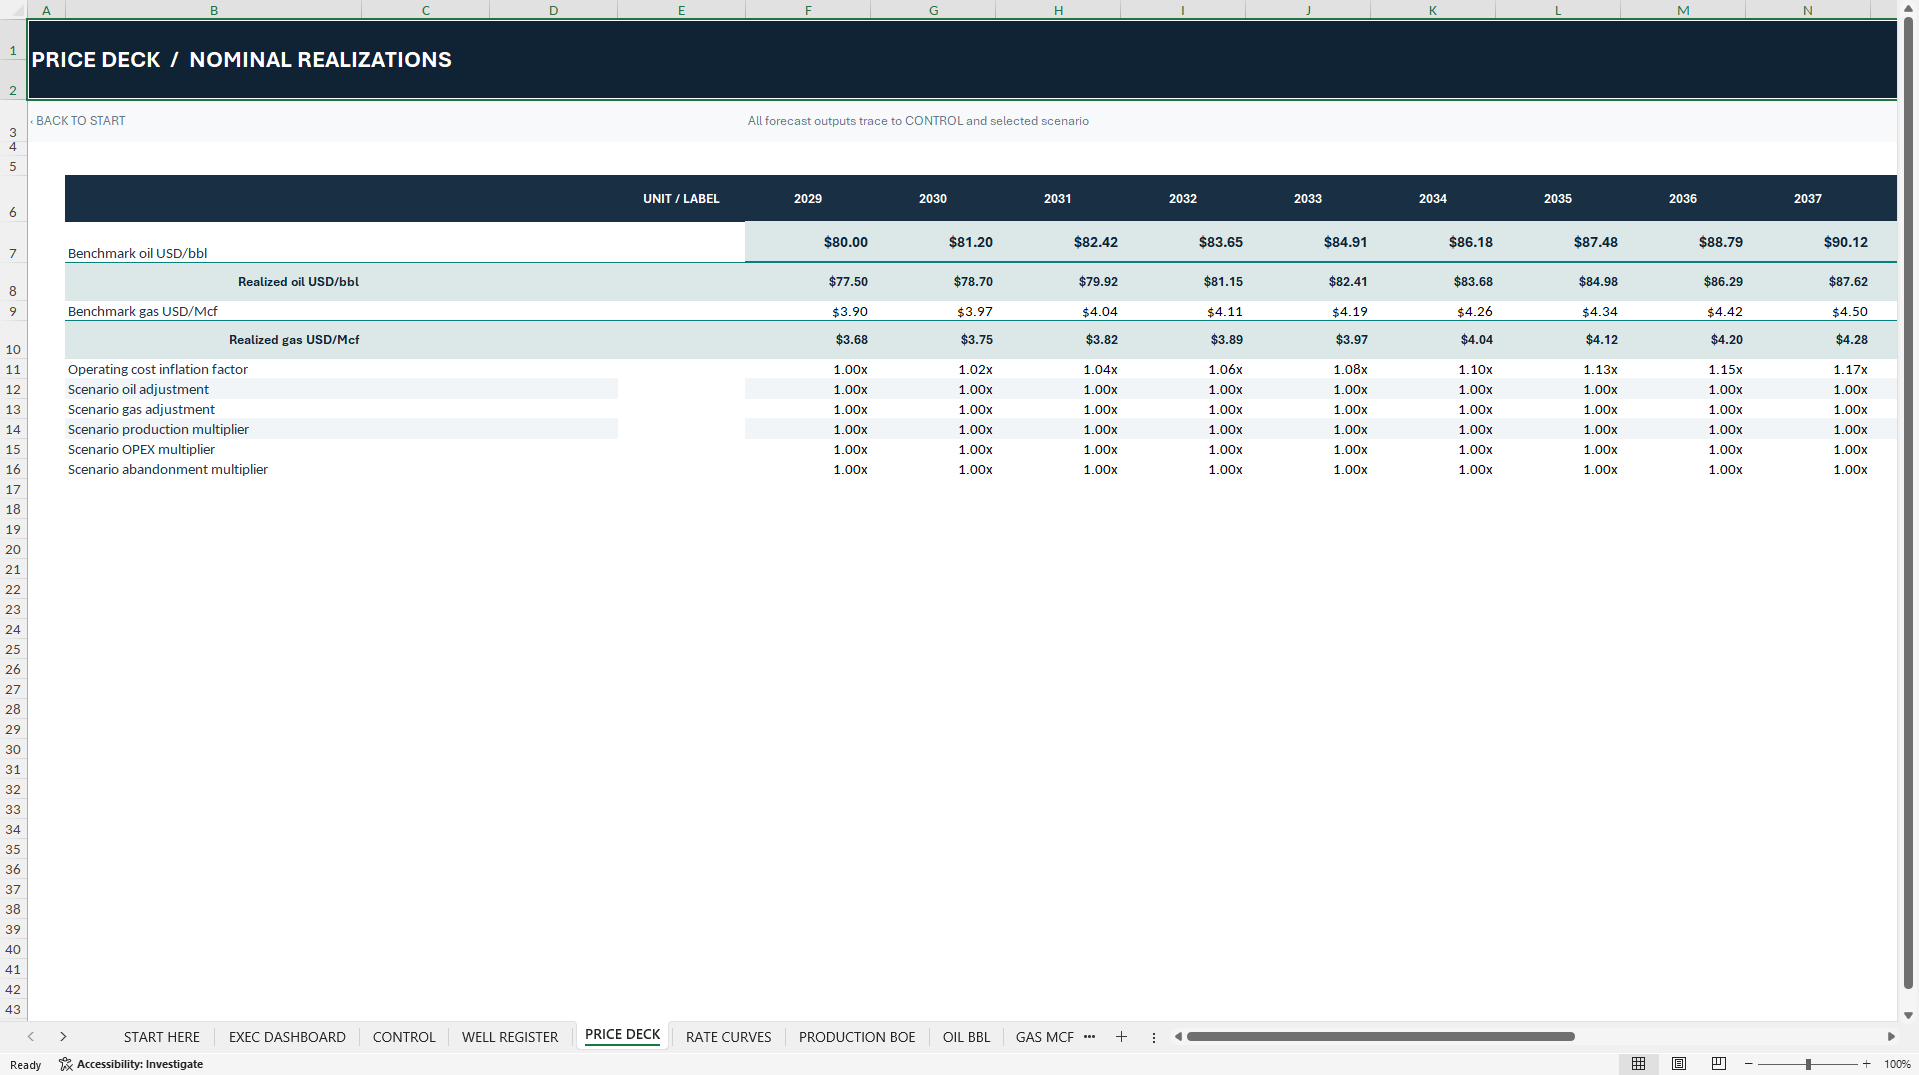
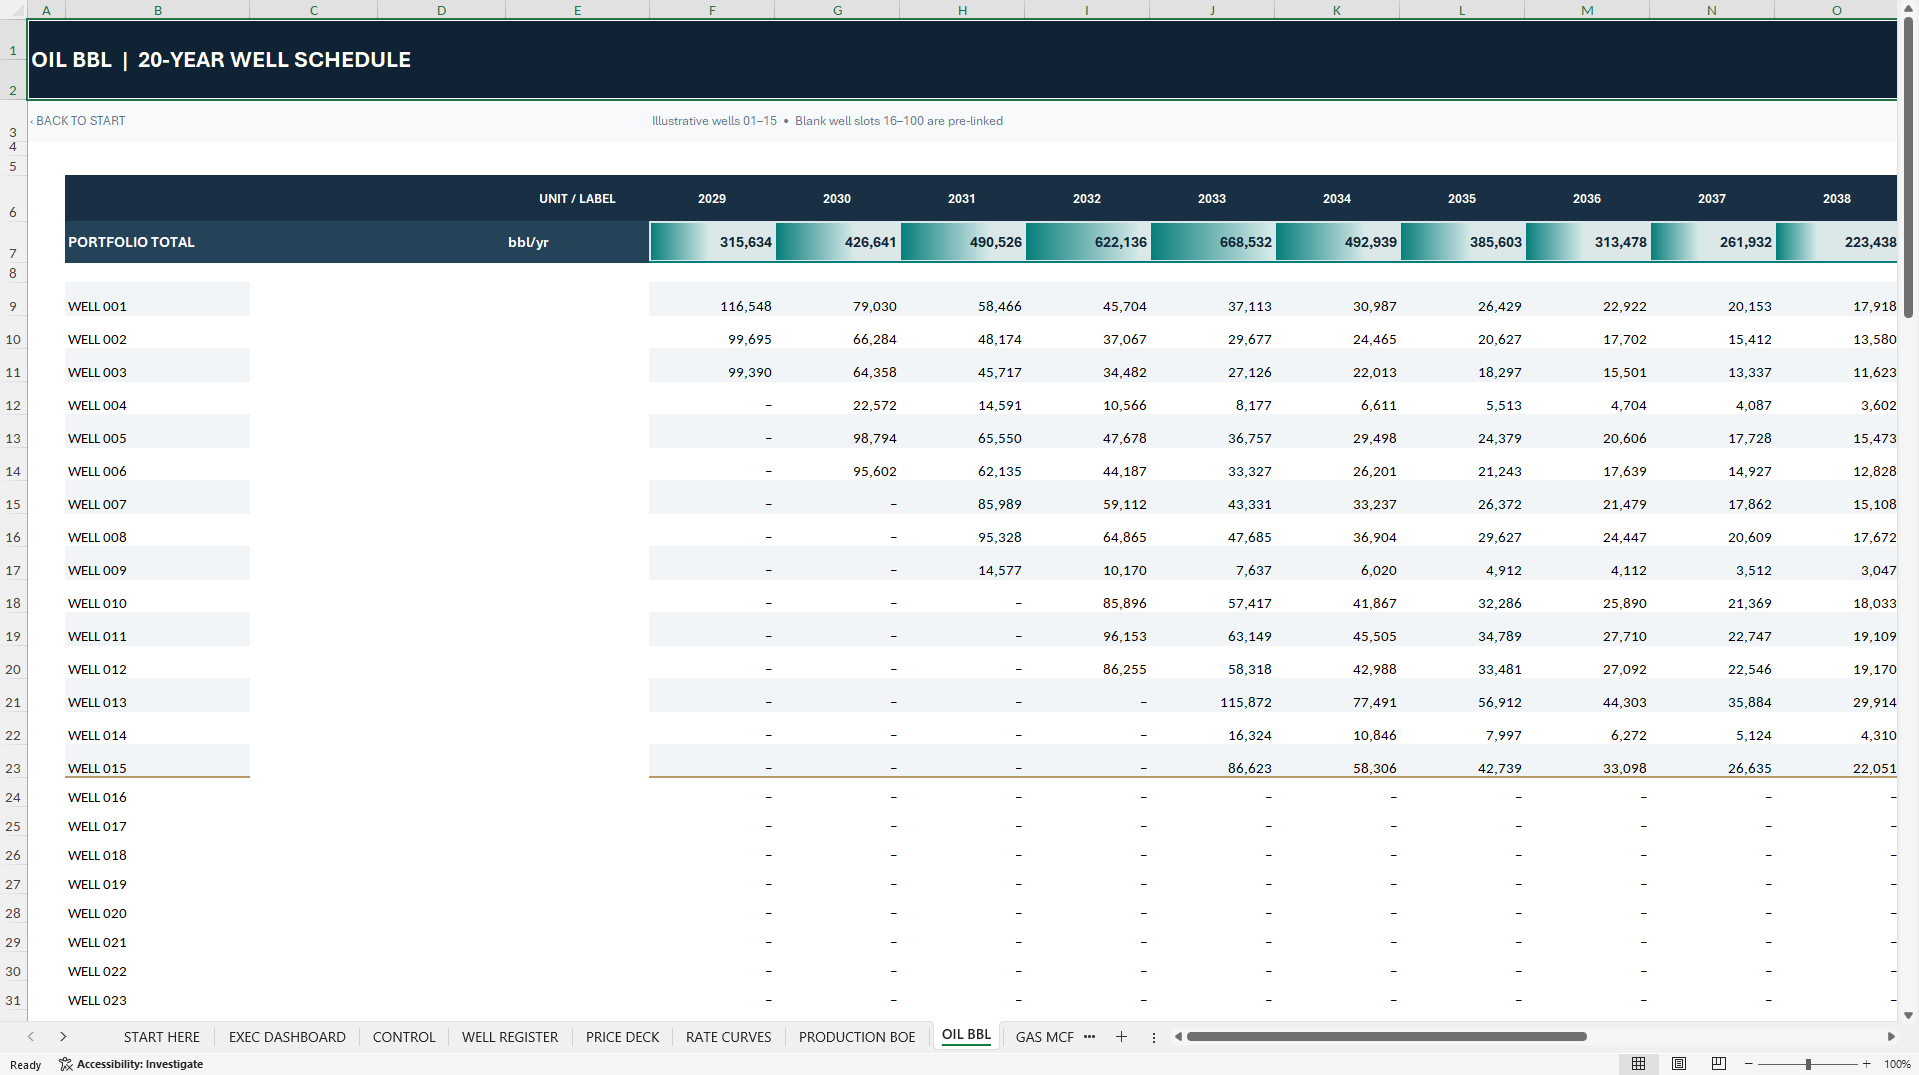
Track oil in barrels, associated gas in Mcf and combined production in BOE using an editable gas conversion factor. Set oil and gas benchmarks, price escalation and realized-price differentials in the price deck.
Follow royalties, production or severance taxes, lifting, transportation and overhead through to field EBITDA and operating netback per BOE. The reserves schedule reconciles modeled production, remaining recoverable volumes and end-of-life write-offs. These schedules are planning tools, not certified reserve estimates.
🏗️ DEVELOPMENT CAPEX, WORKOVERS & ABANDONMENT
Trace drilling, completion, facilities and tie-in spending through the annual forecast. Review workovers and plugging and abandonment costs separately so their timing remains visible in project cash flow.
The model includes pooled units-of-production depreciation and depletion, closure cash charges and end-of-forecast asset write-offs. It does not include a full asset retirement obligation accrual, accretion or funded abandonment reserve.
🏦 DEBT, CFADS & THREE LINKED FINANCIAL STATEMENTS
Model annual borrowing vintages tied to eligible development CAPEX, with editable interest, amortization and grace-period assumptions. Compare Cash Flow Available for Debt Service (CFADS) with scheduled principal and interest, then review annual and minimum Debt Service Coverage Ratios (DSCR).
The FINANCIALS worksheet links the Income Statement, Cash Flow Statement and Balance Sheet. Follow operating earnings, depletion, simplified cash taxes and loss carryforwards, receivables, payables, debt draws and repayments, sponsor equity and shareholder distributions.
The workbook can calculate illustrative sponsor contributions under its selected cash policy. These are modeled funding assumptions, not committed capital. The debt schedule does not include borrowing-base redetermination, a cash sweep, automatic restructuring or a negotiated lender waterfall.
📈 PROJECT & EQUITY VALUATION
Review project and equity NPV and IRR, undiscounted project payback, equity multiple, reserve life, cumulative production, peak EBITDA and lifetime development and abandonment spending.
NPV combines the Year 0 investment with 20 year-end cash flows. NPV10 reflects the default 10% discount rate. Changing the discount rate updates the result but not the static NPV10 label.
Late-life abandonment can create additional cash-flow sign changes. In that situation IRR may be ambiguous or non-meaningful. Read it alongside NPV, the annual cash-flow series and debt-service coverage.
🔀 THREE SCENARIOS & 31 OIL-PRICE TESTS
Select Base, Upside or Downside to change oil prices, gas prices, production volumes, cash operating costs and abandonment spending. The workbook calculates one active scenario at a time.
The separate OIL SENSITIVITY worksheet tests 31 flat realized oil prices. The default grid runs from USD 20 to USD 170 per barrel and incorporates simplified tax-loss and working-capital effects. When the grid brackets zero project NPV, the model interpolates a break-even price. The calculation holds the operating plan fixed. It is not a WTI futures forecast or a price-triggered drilling optimization.
📊 EXECUTIVE DASHBOARD & MODEL CHECKS
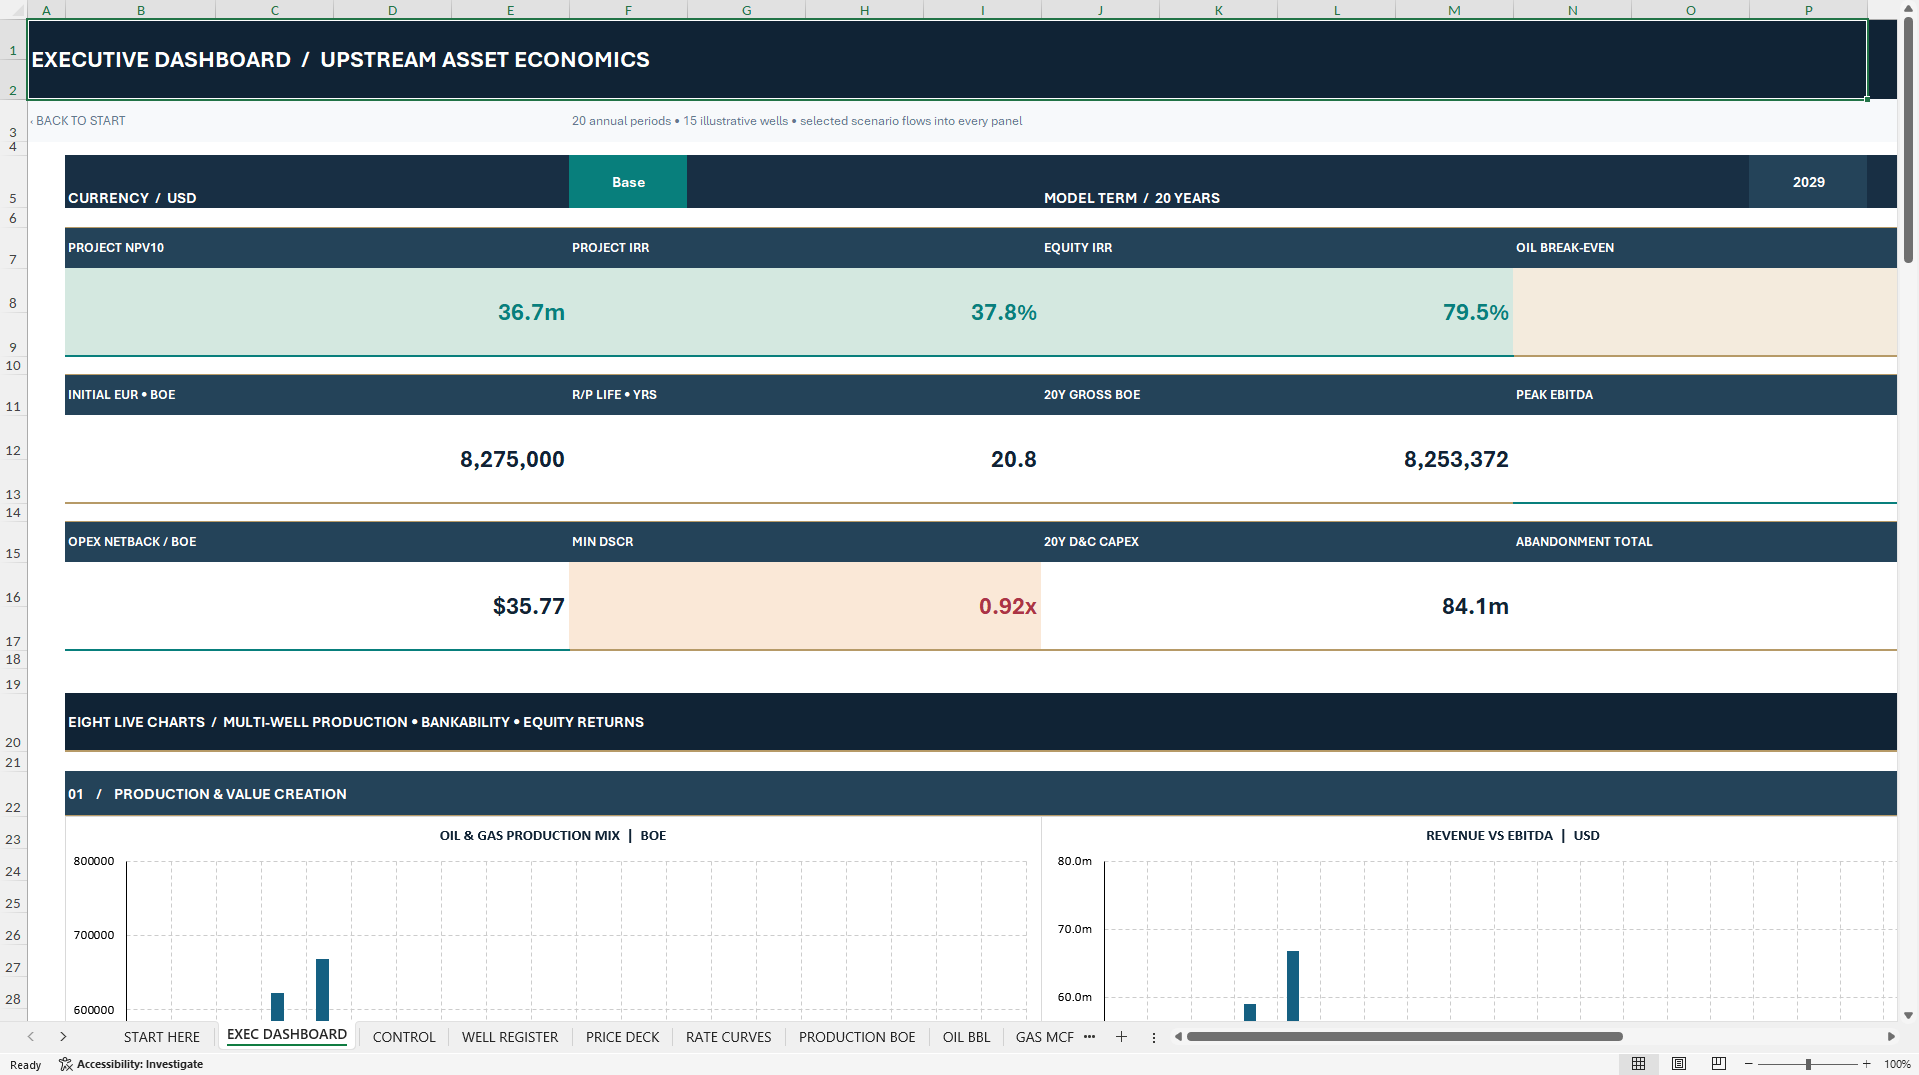
The dashboard presents 12 KPIs and eight native Excel charts covering production mix, revenue and EBITDA, reserves, operating netback, CFADS versus debt service, development and late-life spending, senior debt outstanding and cumulative equity cash flow.
Annual technical checks cover production, reserves, well timing, drilling limits, debt, cash movements and the balance sheet. DSCR warnings are tracked separately.
In the fictional examples, minimum DSCR is 0.92× in Base, 0.46× in Upside and −0.51× in Downside. The cases show one, three and eight years below the illustrative 1.15× threshold, respectively. Downside project and equity IRR are marked non-meaningful. A technical PASS or a positive NPV does not establish funding adequacy or loan compliance.
📦 WHAT YOU RECEIVE
• One editable, macro-free Excel workbook with 22 worksheets, 20 annual periods plus Year 0, 100 pre-linked well positions, 3 selectable scenarios, 31 oil-price tests, 3 linked financial statements and 8 native dashboard charts.
• One 25-page English PDF guide covering setup, decline methodology, reserves, costs, abandonment, financing, valuation, sensitivity, model checks and troubleshooting.
🧭 GETTING STARTED
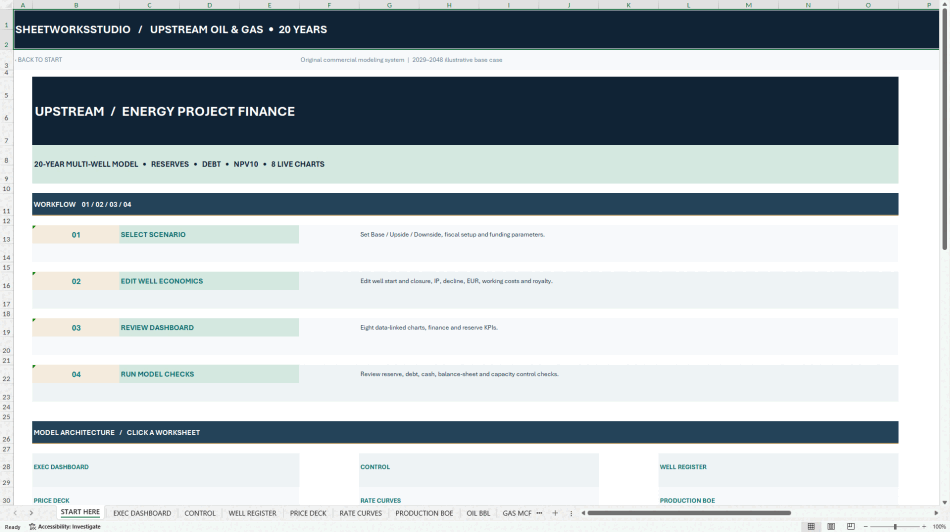
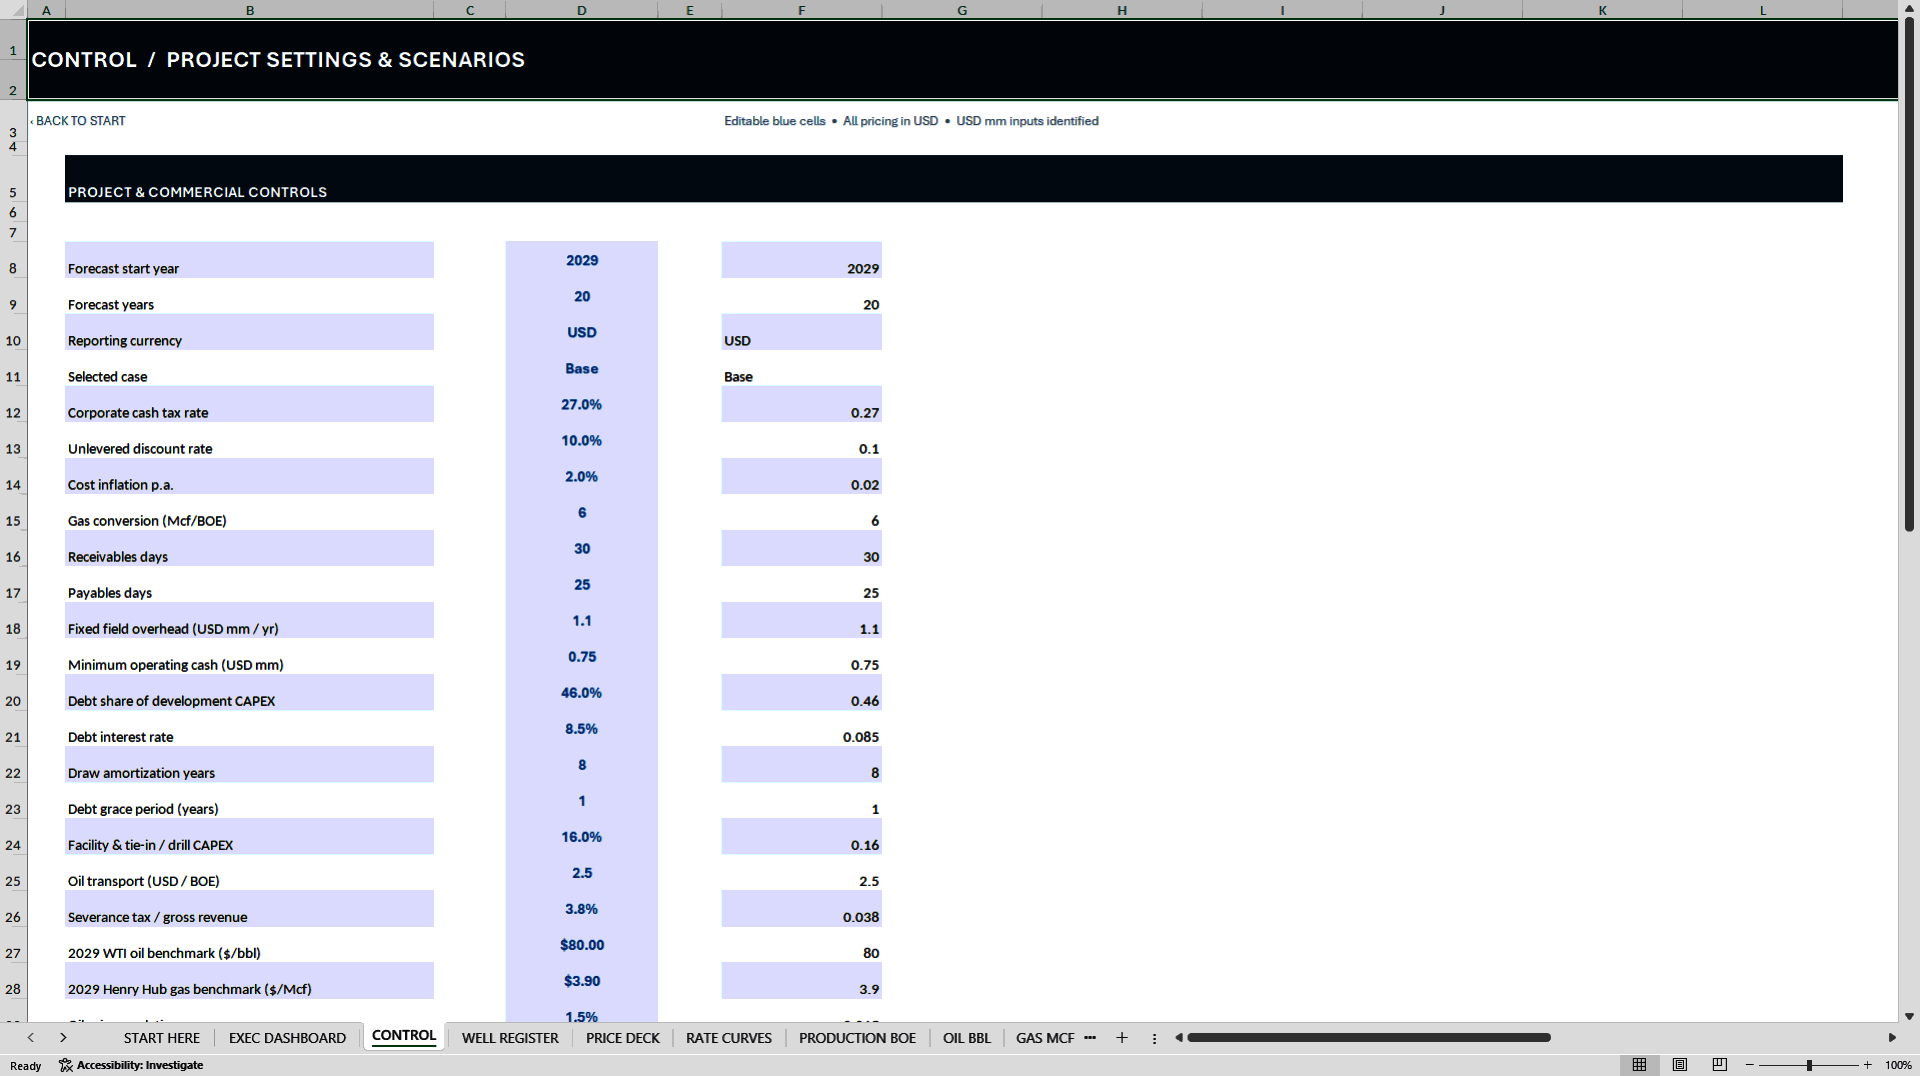
Save a working copy and open START HERE. Update CONTROL, then replace the fictional records in WELL REGISTER. Review well timing, decline parameters and reserve limits before entering project-specific prices, costs and funding assumptions. After a material change, compare the statements, valuation, price sensitivity and model checks across all three scenarios.
⚙️ COMPATIBILITY & SCOPE
Microsoft Excel Desktop is recommended. The XLSX requires no VBA macros or live external data connections. Native Excel Desktop opening, recalculation and saving, as well as Google Sheets compatibility, have not been independently verified. The currency setting is a display label and does not convert monetary values.
This is an annual financial planning model. It is not a monthly drilling simulator, hedging system, geological risk simulation or jurisdiction-specific petroleum tax engine.
🛡️ INDEPENDENT TEMPLATE
Developed by SheetworksStudio as an independent, unofficial planning template. All example wells, prices and outcomes are fictional. The model is not audited, reserves-certified, regulator-approved or lender-approved. It does not provide individualized investment, engineering, accounting, tax or legal advice. Validate project assumptions and outputs before using them for actual development or financing decisions.
Got a question about the product? Email us at support@flevy.com or ask the author directly by using the "Ask the Author a Question" form. If you cannot view the preview above this document description, go here to view the large preview instead.
Source: Best Practices in Oil & Gas, Integrated Financial Model Excel: Upstream Oil & Gas Project Finance Model Excel (XLSX) Spreadsheet, SheetworksStudio
ABOUT THE AUTHOR

SheetworksStudio creates premium Excel-based business templates, dashboards, trackers, financial models, and management systems for professionals, consultants, entrepreneurs, and organizations.
Our portfolio covers finance, project management, operations, risk management, compliance, AI governance, HR, supply chain, performance management, and business planning. Each product is designed to
... [read more]
Ask the Author a Question
You must be logged in to contact the author.