
Marketplace (Two-sided Platform) 3 Statement Financial Model – Excel XLSX
Excel (XLSX)
BENEFITS OF THIS DOWNLOADABLE EXCEL DOCUMENT
- Provides a comprehensive framework for building a two-sided marketplace financial model grounded in real operational drivers and unit economics.
- Equips founders, investors, and operators with an institutional-grade 3-statement forecasting system designed for fundraising, acquisitions, and board-level planning.
- Delivers a fully integrated, formula-verified marketplace modeling engine that turns GMV assumptions into defensible, investor-ready financial projections.
MARKETPLACE EXCEL DESCRIPTION
Curated by McKinsey-trained Executives
🛒 Two-Sided Marketplace Financial Model – 10-Year Forecast
The Ultimate Excel Financial Model for Marketplace Founders, Platform Operators & Growth Investors
Stop guessing your GMV trajectory. Stop paying $25,000 for a consultant to build what you can own forever.
If you're launching, scaling, or financing a two-sided marketplace, your financial model is NOT a spreadsheet.
It's your #1 fundraising weapon. Your investor due diligence armor. Your Series A proof of concept.
And this model gives you – fully built and formula-verified – exactly what VCs, growth equity firms, and platform investors demand to see.
💼 What You Get
✅ 14 Fully Linked Excel Worksheets
✅ 1,468+ Active, Verified Excel Formulas
✅ 10-Year Annual Forecast (Year 1 – Year 10)
✅ Complete 3-Statement Model: Income Statement, Balance Sheet & Cash Flow
✅ Two-Sided Supply & Demand Engine Built from Operational Drivers
✅ Full Buyer Cohort Acquisition & Seller Onboarding Model
✅ CAC, LTV & LTV/CAC Ratio Built into Every Year
✅ GMV Waterfall: Buyers × Purchase Frequency × AOV → Platform Revenue
✅ Dynamic Take Rate Optimization with Annual Improvement Curve
✅ 6 Separate Revenue Streams: Transaction Fees, Seller SaaS, Advertising, Payment Markup, and More
✅ Sensitivity Analysis & 6-Scenario Comparison Table
✅ Executive Dashboard with KPI Cards & Full 10-Year Trend Table
✅ 70+ Blue-Coded Assumption Inputs – Change One Cell, Everything Updates
✅ Works in Microsoft Excel & Google Sheets
This is not a generic financial model template.
This is a complete, marketplace-specific financial modeling system – built for the exact unit economics that platform investors, growth equity firms, and marketplace operators live and die by.
🎯 Who This Is For
• Two-sided marketplace founders raising Seed, Series A, or Series B capital
• Private equity and growth equity investors underwriting marketplace platform acquisitions
• Gig economy, B2B marketplace, and consumer platform operators building board-ready annual plans
• SaaS-enabled marketplace founders modeling subscription + transaction revenue blends
• Marketplace investors evaluating supply-side liquidity, demand-side retention, and take rate expansion
• FP&A analysts and fractional CFOs serving venture-backed marketplace clients
• Venture capital analysts building bottoms-up GMV and revenue models for platform investments
• Investment bankers advising on marketplace M&A, recapitalizations, or IPO readiness
• MBA and CFA candidates learning marketplace-specific financial modeling and unit economics
• Boutique M&A advisors representing marketplace sell-side mandates
If you analyze, develop, finance, or operate a two-sided marketplace platform – this was built for you.
🔥 Why Most Marketplace Financial Models Fail
Generic templates focus on:
• Simple revenue = last year × growth percentage
• No concept of GMV, take rates, or supply-demand liquidity dynamics
• No buyer cohort modeling or repeat purchase behavior
• No seller onboarding, seller churn, or supply-side capacity modeling
• No CAC tracking by side – buyer acquisition vs. seller acquisition modeled separately
• No network effect assumptions or marketplace liquidity ramp curves
• No deferred revenue roll-forward for seller subscription tools
• No marketplace-specific working capital: payment float, AR, AP, and seller payables
• No take rate optimization modeling or revenue mix shift over time
• No six-revenue-stream architecture: transaction fees, SaaS, advertising, payment markup, refunds, and promotional credits
This model fixes all of that – from the ground up.
📚 What's Inside – Every Tab, Every Formula
Tab 1: Dashboard
• 16 auto-updating KPI cards: GMV, Total Revenue, Gross Profit, EBITDA, Net Income, Cash Balance, Gross Margin %, EBITDA Margin %, Net Margin %, CAC, LTV, LTV/CAC Ratio, Active Buyers, Active Sellers, Blended Take Rate, and Total Headcount
• Full 10-year KPI trend table spanning all critical P&L, cash flow, and marketplace metrics
• Fully formula-driven – no manual data entry required on the Dashboard
• Designed for investor presentations, board reporting, Series A data rooms, and lender packages
Tab 2: Assumptions
• 70+ blue-coded input cells – the single source of truth for all 1,468 formulas
• Section A – User Growth: starting monthly new buyers, buyer MoM growth rate, monthly buyer churn, purchase frequency, AOV, new seller onboarding rate, seller churn, listings per seller
• Section B – Monetization: take rate Y1, annual take rate improvement, take rate ceiling, seller SaaS subscription fee, advertising revenue rate, payment processing markup, refund rate, promotional credit rate
• Section C – Marketing & CAC: buyer CAC, annual CAC efficiency improvement, seller CAC, marketing as % of revenue, annual marketing efficiency improvement, minimum marketing floor, LTV multiple target
• Section D – Cost of Revenue: payment processing fee % of GMV, cloud hosting per active user, customer support cost per user, fraud loss %, seller onboarding cost per seller, chargeback rate, insurance and protection %
• Section E – Personnel & Headcount: salary by department (Engineering, Product, Marketing, Sales, Operations, G&A), annual salary raise, payroll tax rate, benefits rate, bonus pool %, stock-based compensation %
• Section F – CapEx & Amortization: capitalized software development %, infrastructure CapEx %, software amortization life, equipment depreciation life
• Section G – Working Capital & Financing: DSO, DPO, deferred revenue %, tax rate, Series A/B/C equity raise amounts and timing, venture debt amount, venture debt interest rate, venture debt term, WACC
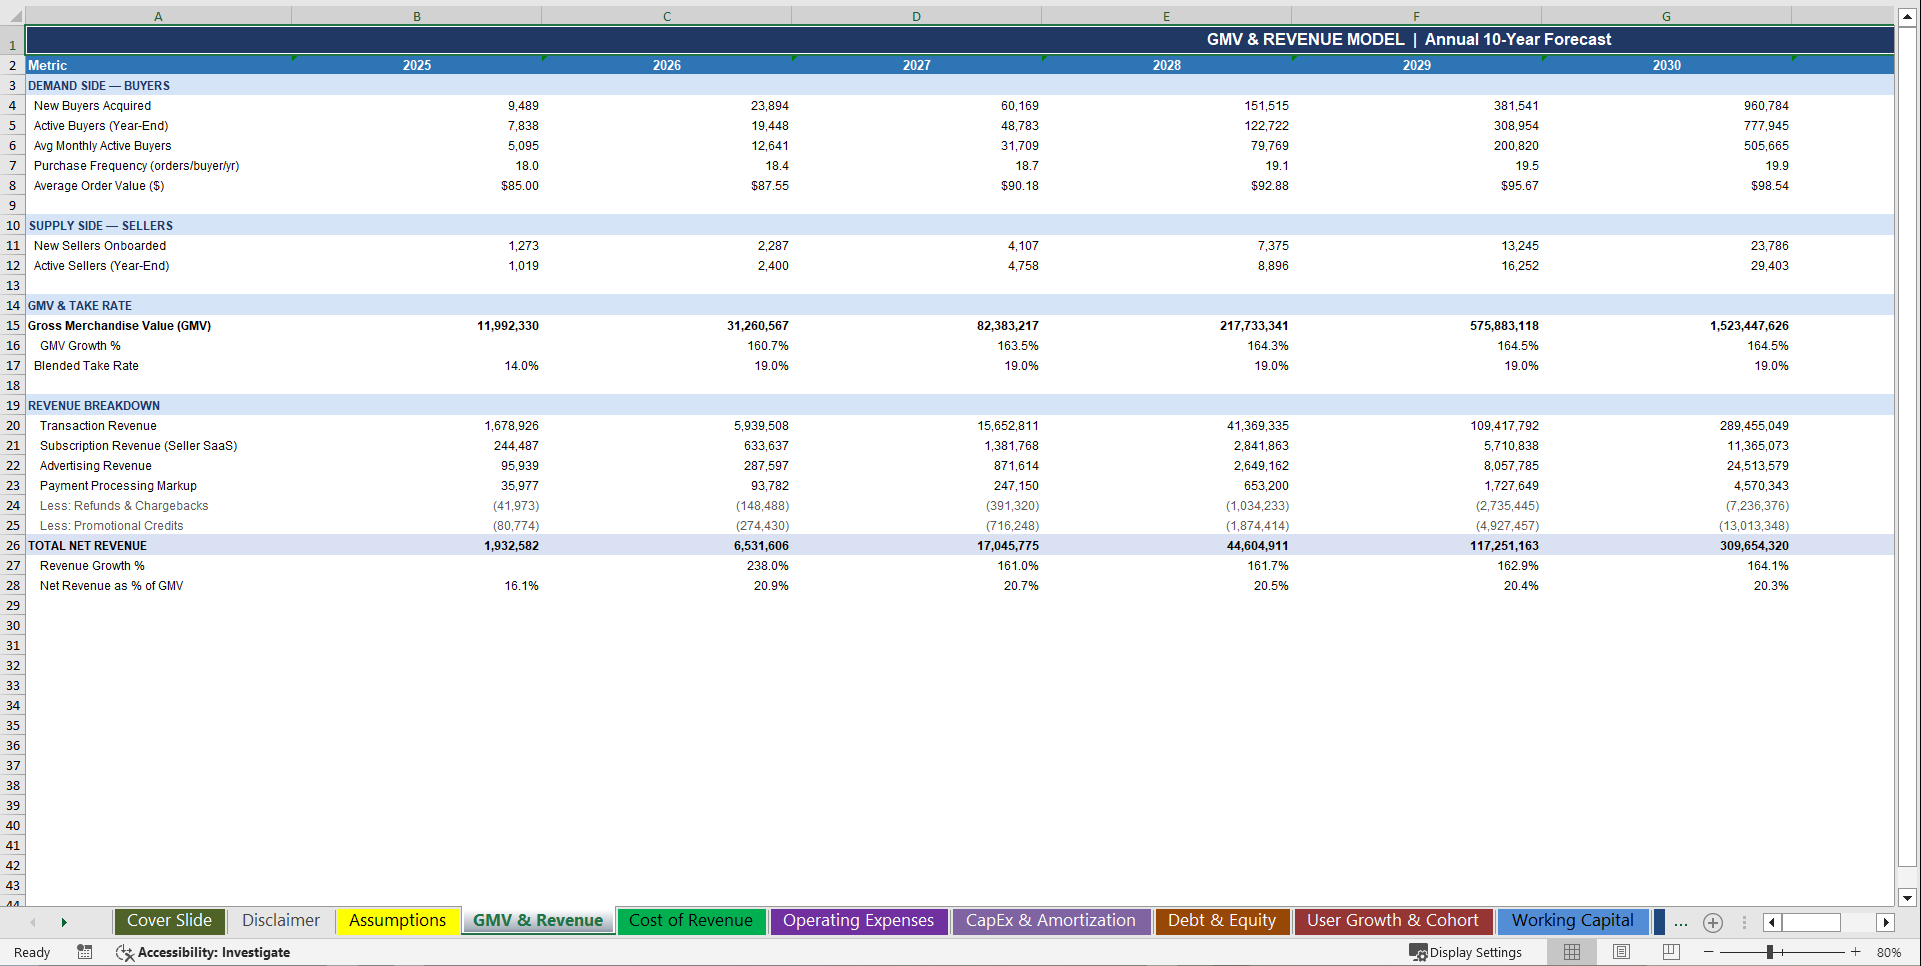
Tab 3: GMV & Revenue Model
• Annual GMV built from a pure operational engine: Active Buyers × Purchase Frequency × Average Order Value – not a percentage guess
• Demand-side model: new buyer acquisition with MoM compound growth, monthly churn, year-end active buyer base roll-forward, monthly active buyers, purchase frequency escalation, AOV with annual growth trajectory
• Supply-side model: new seller onboarding with MoM growth, seller churn, active seller base roll-forward, listings per seller
• Blended take rate with annual improvement curve capped at configurable maximum
• Six revenue streams waterfall: transaction revenue, seller SaaS subscriptions, advertising revenue, payment processing markup, less refunds and chargebacks, less promotional credits
• Net revenue as % of GMV benchmarked for every year
• Year-over-year GMV and revenue growth % auto-calculated
Tab 4: Cost of Revenue
• Seven COGS line items fully driven by operational metrics – not hardcoded guesses
• Payment processing fees as % of GMV – Stripe, Braintree, Adyen cost modeling
• Cloud hosting costs tied to active user base with annual growth escalation
• Customer support costs per active user with annual efficiency improvement
• Fraud detection and loss costs as % of GMV
• Seller onboarding cost per new seller onboarded
• Chargeback and bad debt rate as % of GMV
• Insurance and buyer protection program costs as % of GMV
• Gross profit and gross margin % output for every year
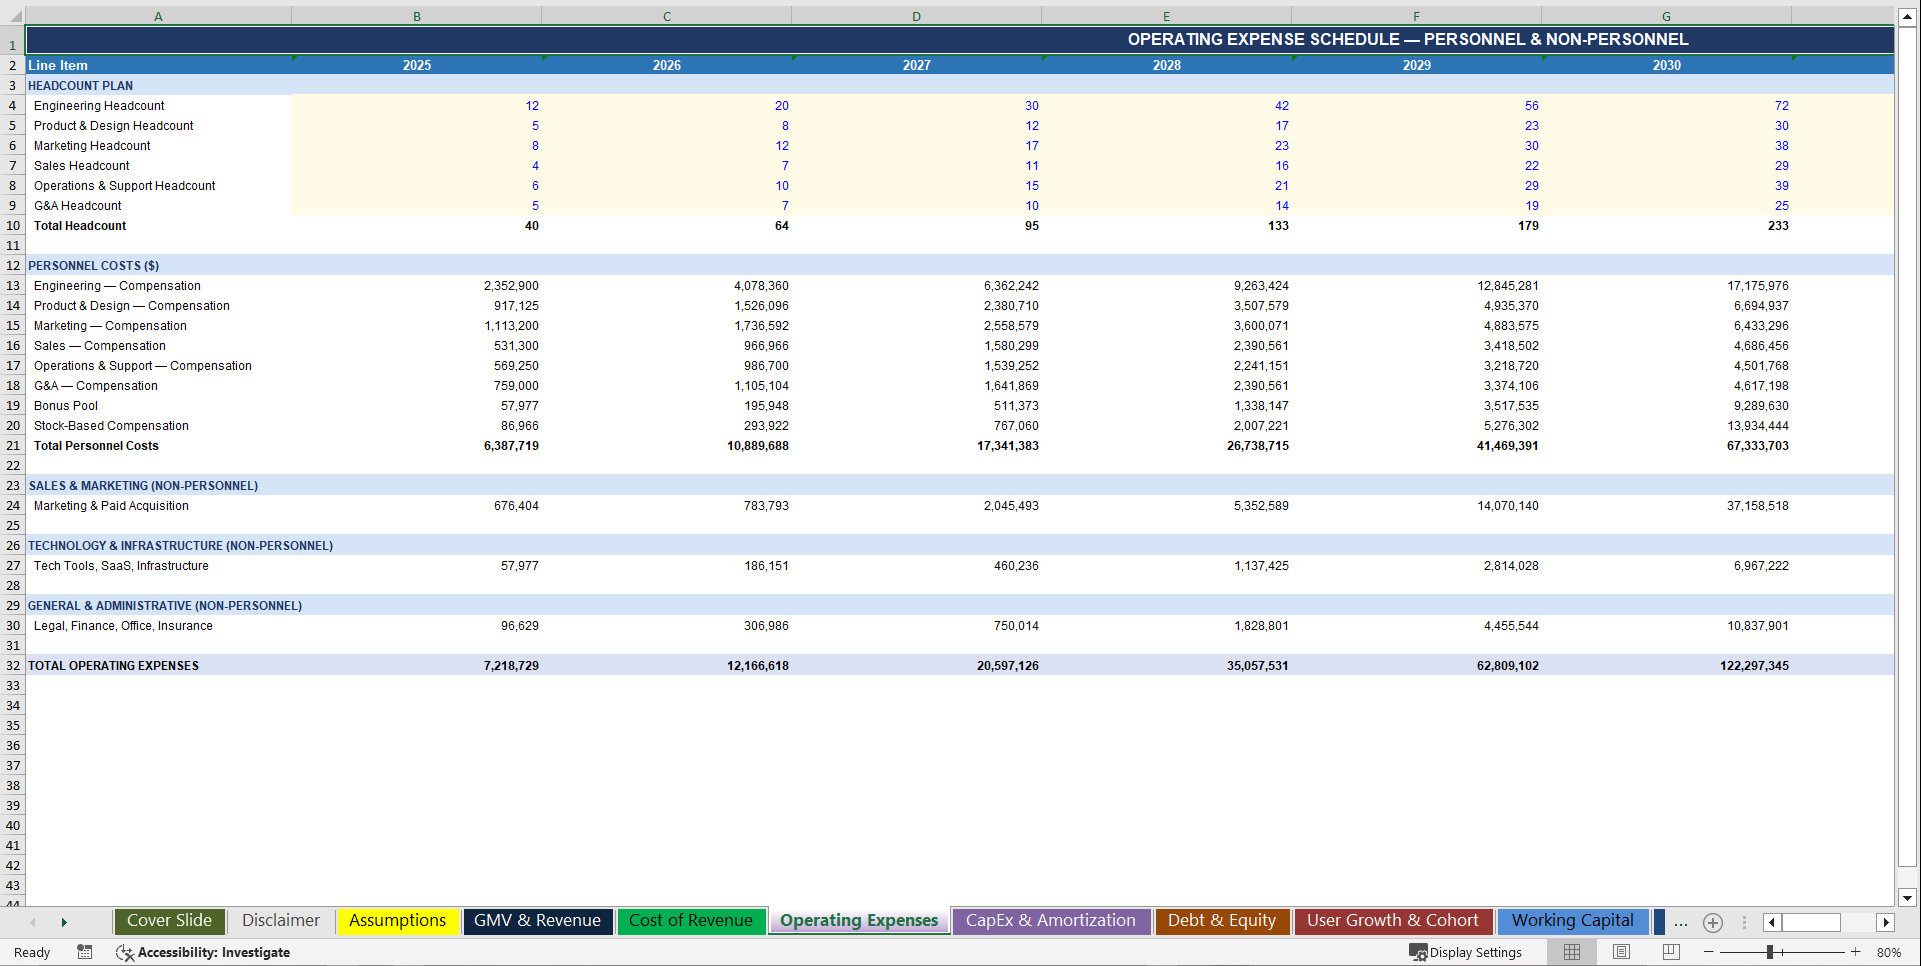
Tab 5: Operating Expenses
• Headcount plan by department: Engineering, Product, Marketing, Sales, Operations & Support, and G&A – with year-by-year hiring roadmap
• Fully loaded compensation formula: headcount × salary × (1 + annual raise)^(Year − 1) × (1 + payroll taxes + benefits)
• Bonus pool as % of revenue and stock-based compensation as % of revenue modeled separately
• Marketing & paid acquisition: spend as % of revenue with annual efficiency improvement and configurable floor – models scale leverage
• Technology tools and SaaS infrastructure as % of revenue with annual decline
• G&A costs as % of revenue with annual decline trajectory
• EBITDA and EBITDA margin % output for every year
Tab 6: CapEx & Amortization Schedule
• Capitalized software development as % of revenue with annual decline as platform matures
• Infrastructure and equipment CapEx as % of revenue
• Straight-line amortization of capitalized software over configurable life (default 3 years)
• Straight-line depreciation of equipment over configurable life (default 5 years)
• Net book value roll-forwards for software and equipment: Beginning + Additions − Amortization/Depreciation = Ending
• Total D&A feeds directly into Income Statement and Cash Flow Statement
Tab 7: Debt & Equity Schedule
• Series A, Series B, and Series C equity raise amounts and timing – each pulls from Assumptions
• Venture debt draw schedule, repayment schedule, and outstanding balance roll-forward
• Interest expense calculated on average outstanding balance
• Cumulative paid-in capital roll-forward linked to Balance Sheet equity section
Tab 8: User Growth & Cohort Model
• 10×10 buyer cohort retention matrix: each annual cohort tracked across 10 years of retention – heat-mapped green/yellow/red for instant visual analysis
• Retention rates improving across cohorts to model network effect maturity
• CAC trend: buyer CAC with annual efficiency improvement curve for 10 years
• LTV calculation: AOV × Purchase Frequency × Gross Margin % × Average Buyer Lifetime
• LTV/CAC ratio auto-calculated for every year – the unit economics metric every marketplace investor asks first
• Annual churn rate derived from monthly churn assumption
• Marketing efficiency ratio: revenue per $1 of marketing spend, every year
Tab 9: Working Capital Schedule
• AR roll-forward: DSO-driven accounts receivable for every year
• AP roll-forward: DPO-driven accounts payable for every year
• Deferred revenue: seller subscription revenue × configurable deferred % for every year
• Accrued liabilities as % of revenue for every year
• Net working capital and period-over-period change in net working capital – feeds directly into Cash Flow Statement
Tab 10: Income Statement
• Full GAAP-format P&L for Years 1–10
• Net Revenue from GMV & Revenue Model
• Total COGS from Cost of Revenue Schedule
• Gross Profit and Gross Margin %
• Total Operating Expenses: Sales & Marketing, R&D, Sales Personnel, Marketing Personnel, Operations, G&A, Bonus & SBC, and Technology
• EBITDA and EBITDA Margin %
• Depreciation and Amortization from CapEx Schedule
• EBIT and EBIT Margin %
• Interest expense from Debt & Equity Schedule
• Pre-Tax Income
• Income Tax at configurable rate with NOL carry-forward logic
• Net Income and Net Margin % for every year
Tab 11: Balance Sheet
• Current Assets: Cash (hard-linked from Cash Flow Statement ending balance), Accounts Receivable (DSO-driven), Prepaid and Other Current Assets
• Non-Current Assets: Net Book Value of Software (amortization roll-forward), Net Book Value of Equipment (depreciation roll-forward), Intangible Assets
• Current Liabilities: Accounts Payable (DPO-driven), Accrued Liabilities, Deferred Revenue, Current Portion of Long-Term Debt
• Non-Current Liabilities: Long-Term Debt (net of current portion)
• Equity: Paid-In Capital (cumulative equity raises), SBC Reserve (cumulative stock-based compensation), Retained Earnings (cumulative net income roll-forward)
• Balance check formula confirms Total Assets = Total Liabilities + Equity for all 10 years – zero reconciliation risk
Tab 12: Cash Flow Statement (Indirect Method)
• Operating Activities: Net Income + D&A + SBC + changes in AR, AP, Deferred Revenue, and Accrued Liabilities
• Investing Activities: Capitalized software development outflows, infrastructure and equipment CapEx outflows
• Financing Activities: Equity raises, venture debt drawn, debt repaid
• Net change in cash per year
• Beginning cash balance roll-forward linked from prior year ending balance
• Ending cash balance hard-linked to Balance Sheet cash – the integration test every lender and investor runs first
Tab 13: Sensitivity & Scenario Analysis
• Table 1 – Take Rate × Buyer Churn EBITDA Sensitivity: 25-cell matrix showing EBITDA margin across 5 take rate scenarios (12%–20%) and 5 churn scenarios (2%–7%) – instantly reveals your breakeven take rate and maximum tolerable churn
• Table 2 – GMV × AOV Revenue Sensitivity: 25-cell matrix showing Year 5 Net Revenue across 5 GMV multiplier scenarios and 5 AOV change scenarios – quantifies the revenue impact of pricing power and demand growth
• Table 3 – Six-Scenario Summary: Base Case, High Growth, Viral Network Effect, Recession, Competitive Pressure, and International Expansion – each showing Year 5 EBITDA, Year 10 EBITDA, Year 5 Net Income, and Year 10 Net Income
Tab 14: Supporting Schedules
• Complete tab index with sheet descriptions
• Full color-coding guide: blue inputs, black formulas, green cross-sheet links
• Model architecture reference for analysts, investors, and board members
💎 PLUS: Sensitivity & Scenario Analysis Built In
This is NOT a static model with one set of outputs.
It includes:
1️⃣ Take Rate × Buyer Churn EBITDA Sensitivity Matrix
25-cell matrix showing EBITDA margin across every combination of take rate and buyer churn. Instantly reveals your breakeven take rate and the exact churn threshold where unit economics break – the two levers every marketplace investor stress-tests first.
2️⃣ GMV × AOV Revenue Sensitivity Matrix
25-cell matrix showing Year 5 Net Revenue across every combination of GMV growth trajectory and average order value. Quantifies the revenue upside from pricing power, AOV expansion, and demand acceleration – and the downside from competitive pressure on order size.
3️⃣ Six Full Business Scenarios
• Base Case – conservative scaling with realistic buyer and seller acquisition costs
• High Growth – aggressive supply and demand acquisition with strong network effects
• Viral Network Effect – exponential liquidity flywheel with accelerating retention
• Recession – demand softness, CAC spike, and AOV compression downside scenario
• Competitive Pressure – take rate compression and elevated churn stress test
• International Expansion – revenue upside from geographic and category expansion
💰 Why This Model Is Different
This model delivers:
✔ GMV built from active buyers, purchase frequency, and AOV – not a growth percentage multiplied against last year
✔ Two-sided platform economics fully modeled: buyer CAC, seller CAC, buyer LTV, LTV/CAC, cohort retention matrix, and cumulative active user bases
✔ Marketplace-specific cost structure: payment processing on GMV, usage-based hosting, per-user support costs, fraud losses, seller onboarding costs, and chargeback reserves
✔ Six-stream revenue architecture: transaction take rate, seller SaaS subscriptions, advertising, payment markup, refund offsets, and promotional credits
✔ Dynamic take rate optimization with configurable improvement curve and ceiling
✔ Institutional-grade 3-statement integration – every number ties, every balance sheet balances, cash flow feeds the balance sheet
✔ Fully transparent assumption architecture – one tab controls 1,468 formulas
✔ Sensitivity analysis built for investor Q&A, lender stress testing, and board scenario planning
It's built for venture-backed marketplace founders, platform-focused private equity, consumer and B2B marketplace investors, and acquisition entrepreneurs – not generic business plan templates.
🧠 Built for Real Capital Decisions
This model helps you:
• Underwrite marketplace platform acquisitions with institutional rigor
• Build a lender-ready financial package for growth debt and venture debt
• Present to Series A and Series B investors with a clean, fully linked 3-statement model built on marketplace unit economics
• Stress-test your take rate, buyer churn, and CAC assumptions before committing capital
• Understand your platform unit economics: LTV/CAC, GMV per seller, revenue per active buyer, EBITDA per transaction
• Model your network effect flywheel: how supply growth drives demand, and how demand growth drives supply
• Compress months of financial modeling work into hours – and walk into your next investor meeting with complete confidence
🚨 The Cost of NOT Having This
Every fundraise you run without a proper marketplace model risks:
• Losing a Series A because your revenue model is a straight-line GMV growth guess with no supply-demand engine underneath it
• Failing lender due diligence because your cash flow statement doesn't tie to your balance sheet
• Overpaying for a marketplace acquisition because you didn't model seller churn, take rate compression, or working capital float
• Spending $20,000–$30,000 on a consultant to build what you can own and reuse forever across every deal, board meeting, and fundraise
One funding round modeled correctly could return this investment thousands of times over.
⚡ Stop Building From Scratch. Start Closing Rounds.
If you're serious about:
• Fundraising from marketplace-focused VCs and growth equity firms with a credible, bottoms-up GMV model
• Underwriting platform acquisitions with proper two-sided unit economics
• Building a board-ready financial plan your CFO, investors, and lenders would be proud of
• Saving weeks of financial modeling time on your next deal or fundraise
This model is your shortcut.
👉 Get the Marketplace Financial Model the Right Way
No hardcoded GMV projections.
No broken formula links.
No single-sided revenue model that ignores your supply base.
No wasted weekends rebuilding from scratch.
Just a complete, verified, marketplace-specific 3-statement financial model – ready to use on your next raise, acquisition, or operating plan.
Download the Two-Sided Marketplace Financial Model today – and underwrite your next platform deal with institutional confidence.
Key Words:
Strategy & Transformation, Growth Strategy, Strategic Planning, Strategy Frameworks, Innovation Management, Pricing Strategy, Core Competencies, Strategy Development, Business Transformation, Marketing Plan Development, Product Strategy, Breakout Strategy, Competitive Advantage, Mission, Vision, Values, Strategy Deployment & Execution, Innovation, Vision Statement, Core Competencies Analysis, Corporate Strategy, Product Launch Strategy, BMI, Blue Ocean Strategy, Breakthrough Strategy, Business Model Innovation, Business Strategy Example, Corporate Transformation, Critical Success Factors, Customer Segmentation, Customer Value Proposition, Distinctive Capabilities, Enterprise Performance Management, KPI, Key Performance Indicators, Market Analysis, Market Entry Example, Market Entry Plan, Market Intelligence, Market Research, Market Segmentation, Market Sizing, Marketing, Michael Porter's Value Chain, Organizational Transformation, Performance Management, Performance Measurement, Platform Strategy, Product Go-to-Market Strategy, Reorganization, Restructuring, SWOT, SWOT Analysis, Service 4.0, Service Strategy, Service Transformation, Strategic Analysis, Strategic Plan Example, Strategy Deployment, Strategy Execution, Strategy Frameworks Compilation, Strategy Methodologies, Strategy Report Example, Value Chain, Value Chain Analysis, Value Innovation, Value Proposition, Vision Statement, Corporate Strategy, Business Development, Business plan pdf, business plan, PDF, Business Plan DOC, Business Plan Template, PPT, Market strategy playbook, strategic market planning, competitive analysis tools, market segmentation frameworks, growth strategy templates, product positioning strategy, market execution toolkit, strategic alignment playbook, KPI and OKR frameworks, business growth strategy guide, cross-functional strategy templates, market risk management, market strategy PowerPoint doc, guide, ebook, e-book ,McKinsey Change Playbook, Organizational change management toolkit, Change management frameworks 2025, Influence model for change, Change leadership strategies, Behavioral change in organizations, Change management PowerPoint templates, Transformational leadership in change, supply chain KPIs, supply chain KPI toolkit, supply chain PowerPoint template, logistics KPIs, procurement KPIs, inventory management KPIs, supply chain performance metrics, manufacturing KPIs, supply chain dashboard, supply chain strategy KPIs, reverse logistics KPIs, sustainability KPIs in supply chain, financial supply chain KPIs, warehouse KPIs, digital supply chain KPIs, 1200 KPIs, supply chain scorecard, KPI examples, supply chain templates, Corporate Finance SOPs, Finance SOP Excel Template, CFO Toolkit, Finance Department Procedures, Financial Planning SOPs, Treasury SOPs, Accounts Payable SOPs, Accounts Receivable SOPs, General Ledger SOPs, Accounting Policies Template, Internal Controls SOPs, Finance Process Standardization, Finance Operating Procedures, Finance Department Excel Template, FP&A Process Documentation, Corporate Finance Template, Finance SOP Toolkit, CFO Process Templates, Accounting SOP Package, Tax Compliance SOPs, Financial Risk Management Procedures.
NOTE: Our digital products are sold on an "as is" basis, making returns and refunds unavailable post-download. Please preview and inquire before purchasing. Please contact us before purchasing if you have any questions! This policy aligns with the standard Flevy Terms of Usage.
Got a question about the product? Email us at support@flevy.com or ask the author directly by using the "Ask the Author a Question" form. If you cannot view the preview above this document description, go here to view the large preview instead.
Source: Best Practices in Marketplace, Integrated Financial Model Excel: Marketplace (Two-sided Platform) 3 Statement Financial Model Excel (XLSX) Spreadsheet, SB Consulting
ABOUT THE AUTHOR
SB Consulting is dedicated to empowering businesses to communicate their ideas with impact. This consulting firm specializes in teaching organizations how to create effective corporate and management presentations. With training from top-tier global consulting firms, including McKinsey, BCG, and Porsche Consulting, extensive expertise in presentation design and ... [read more]
Ask the Author a Question
You must be logged in to contact the author.
