
 Click main image to view in full screen.
Market Sizing Model: TAM, SAM, SOM with Top-Down and Bottom- – Excel XLSX
Excel (XLSX)


BENEFITS OF THIS DOWNLOADABLE EXCEL DOCUMENT
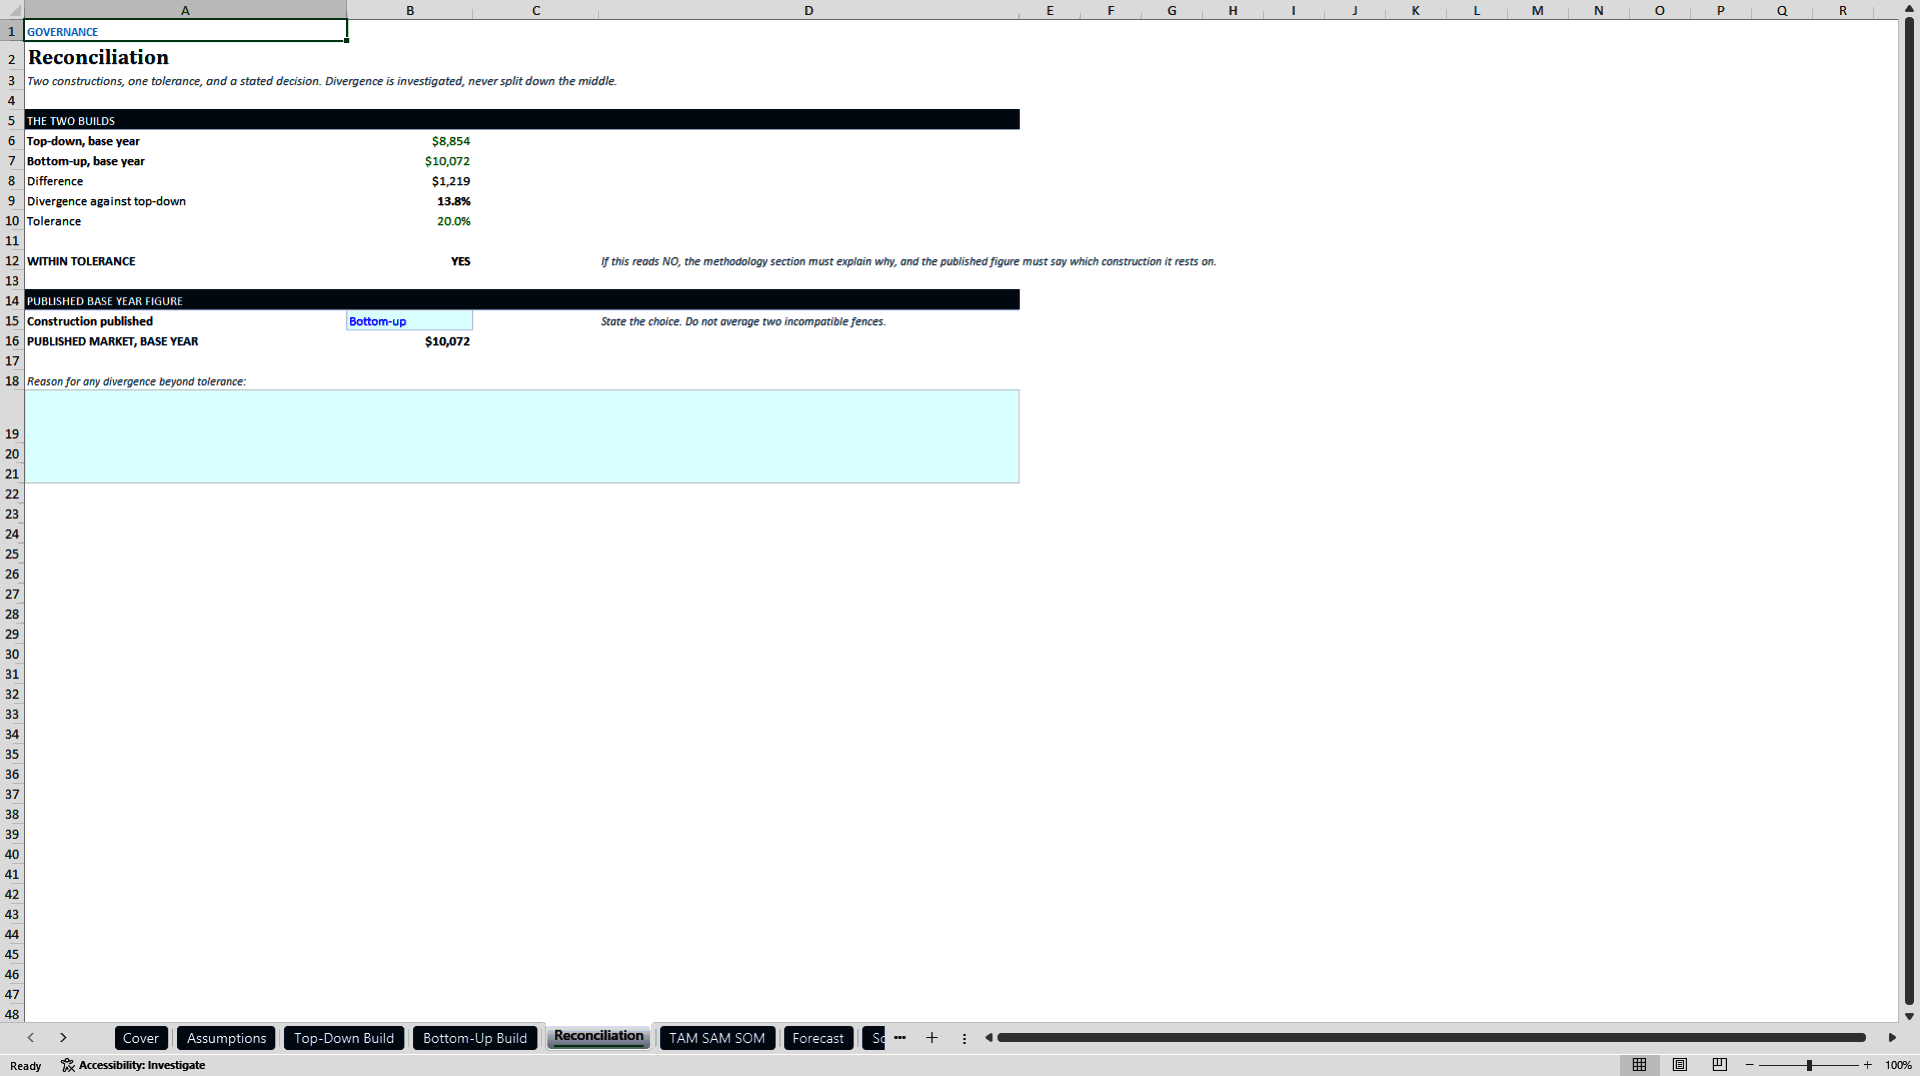
- Builds the market top-down and bottom-up and reconciles the two against a stated tolerance, so the published figure is checked rather than asserted.
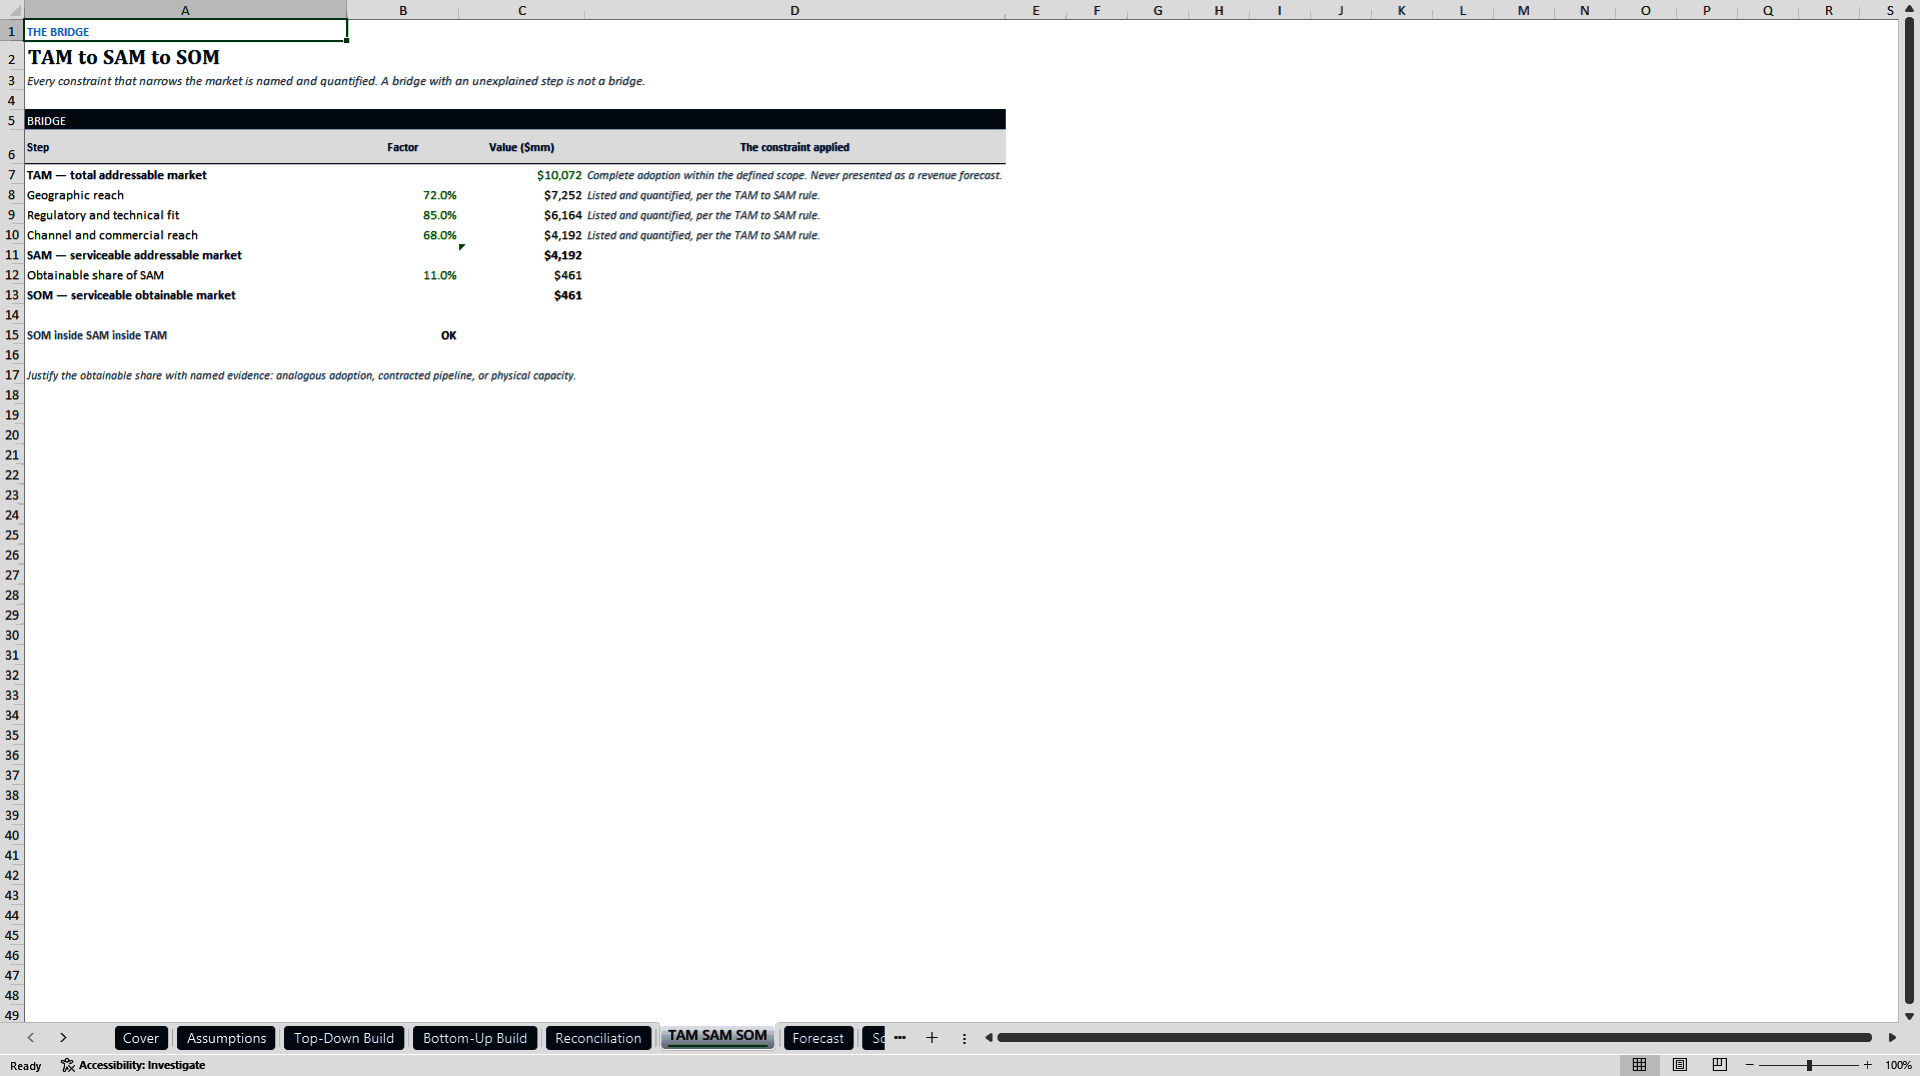
- Quantifies every step of the TAM to SAM to SOM bridge -- geography, regulatory and technical fit, channel reach, obtainable share -- so no narrowing constraint goes unexplained in a review.
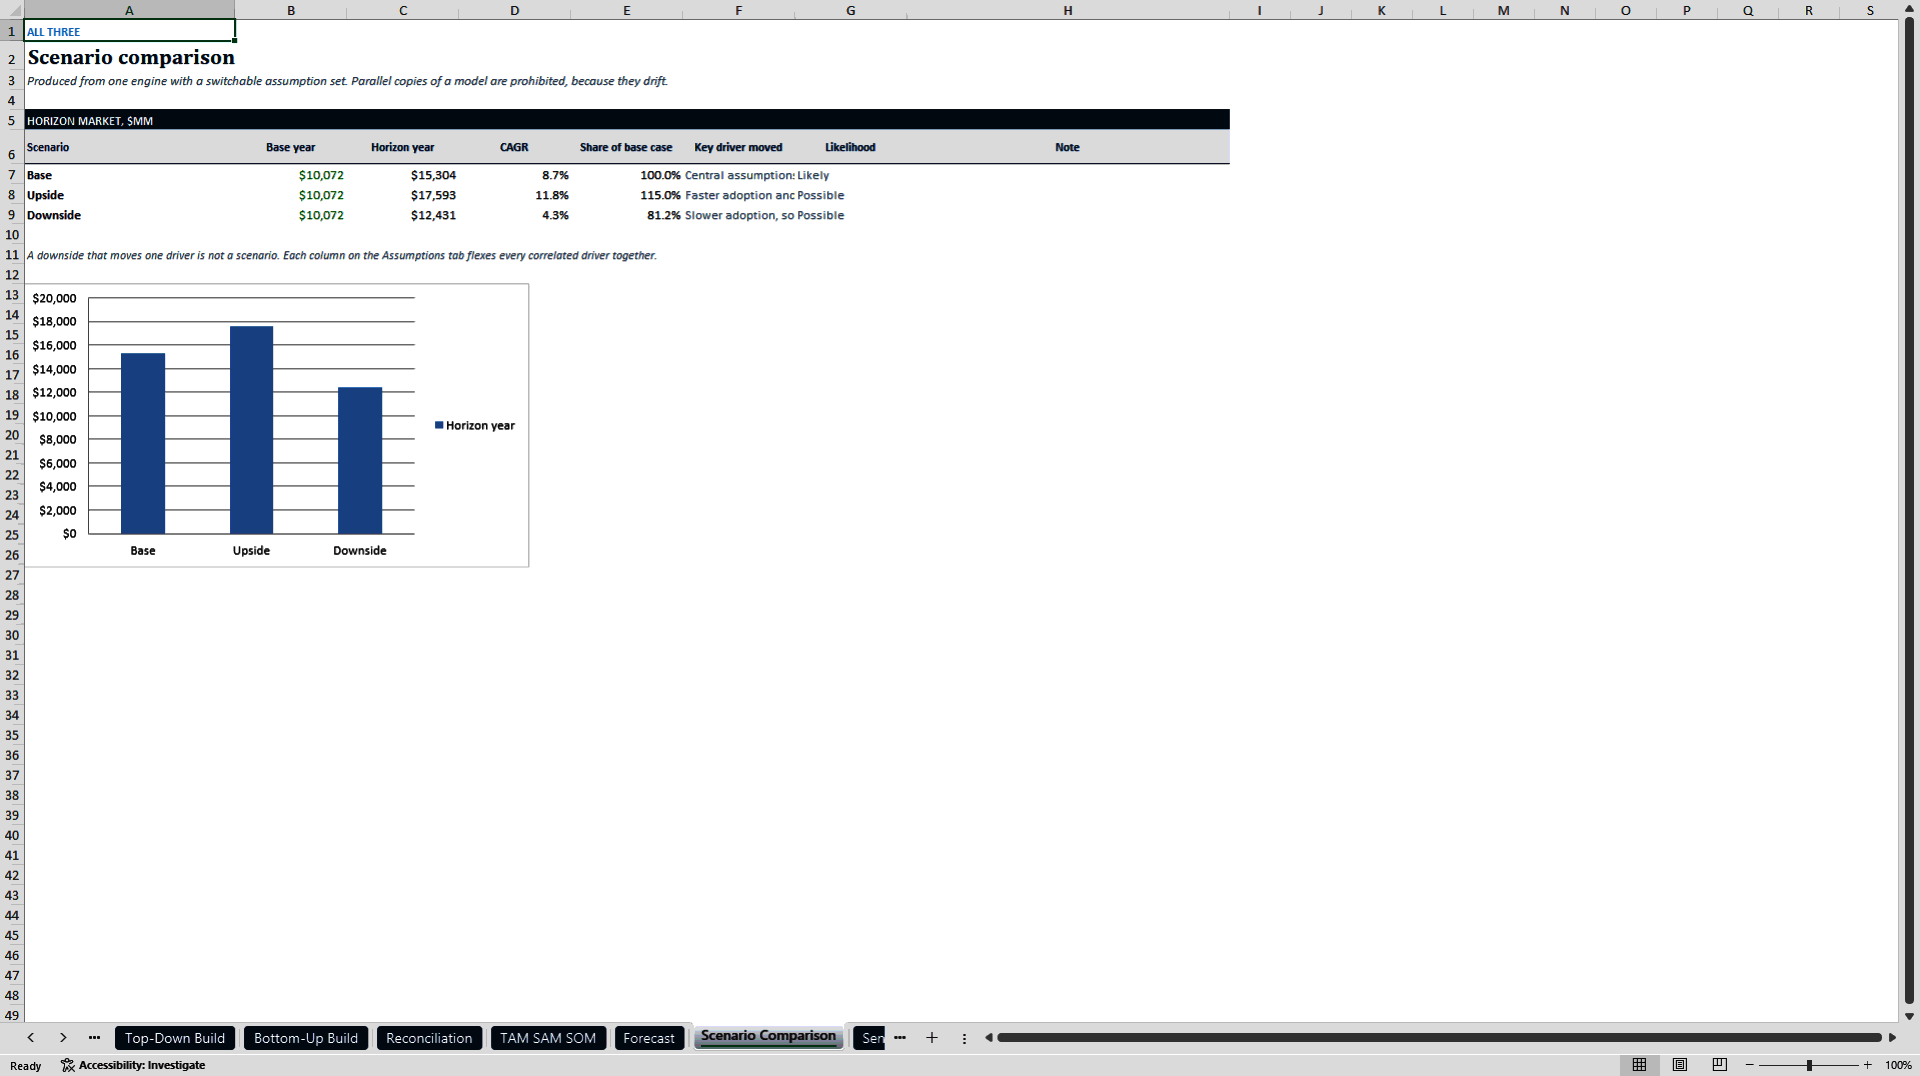
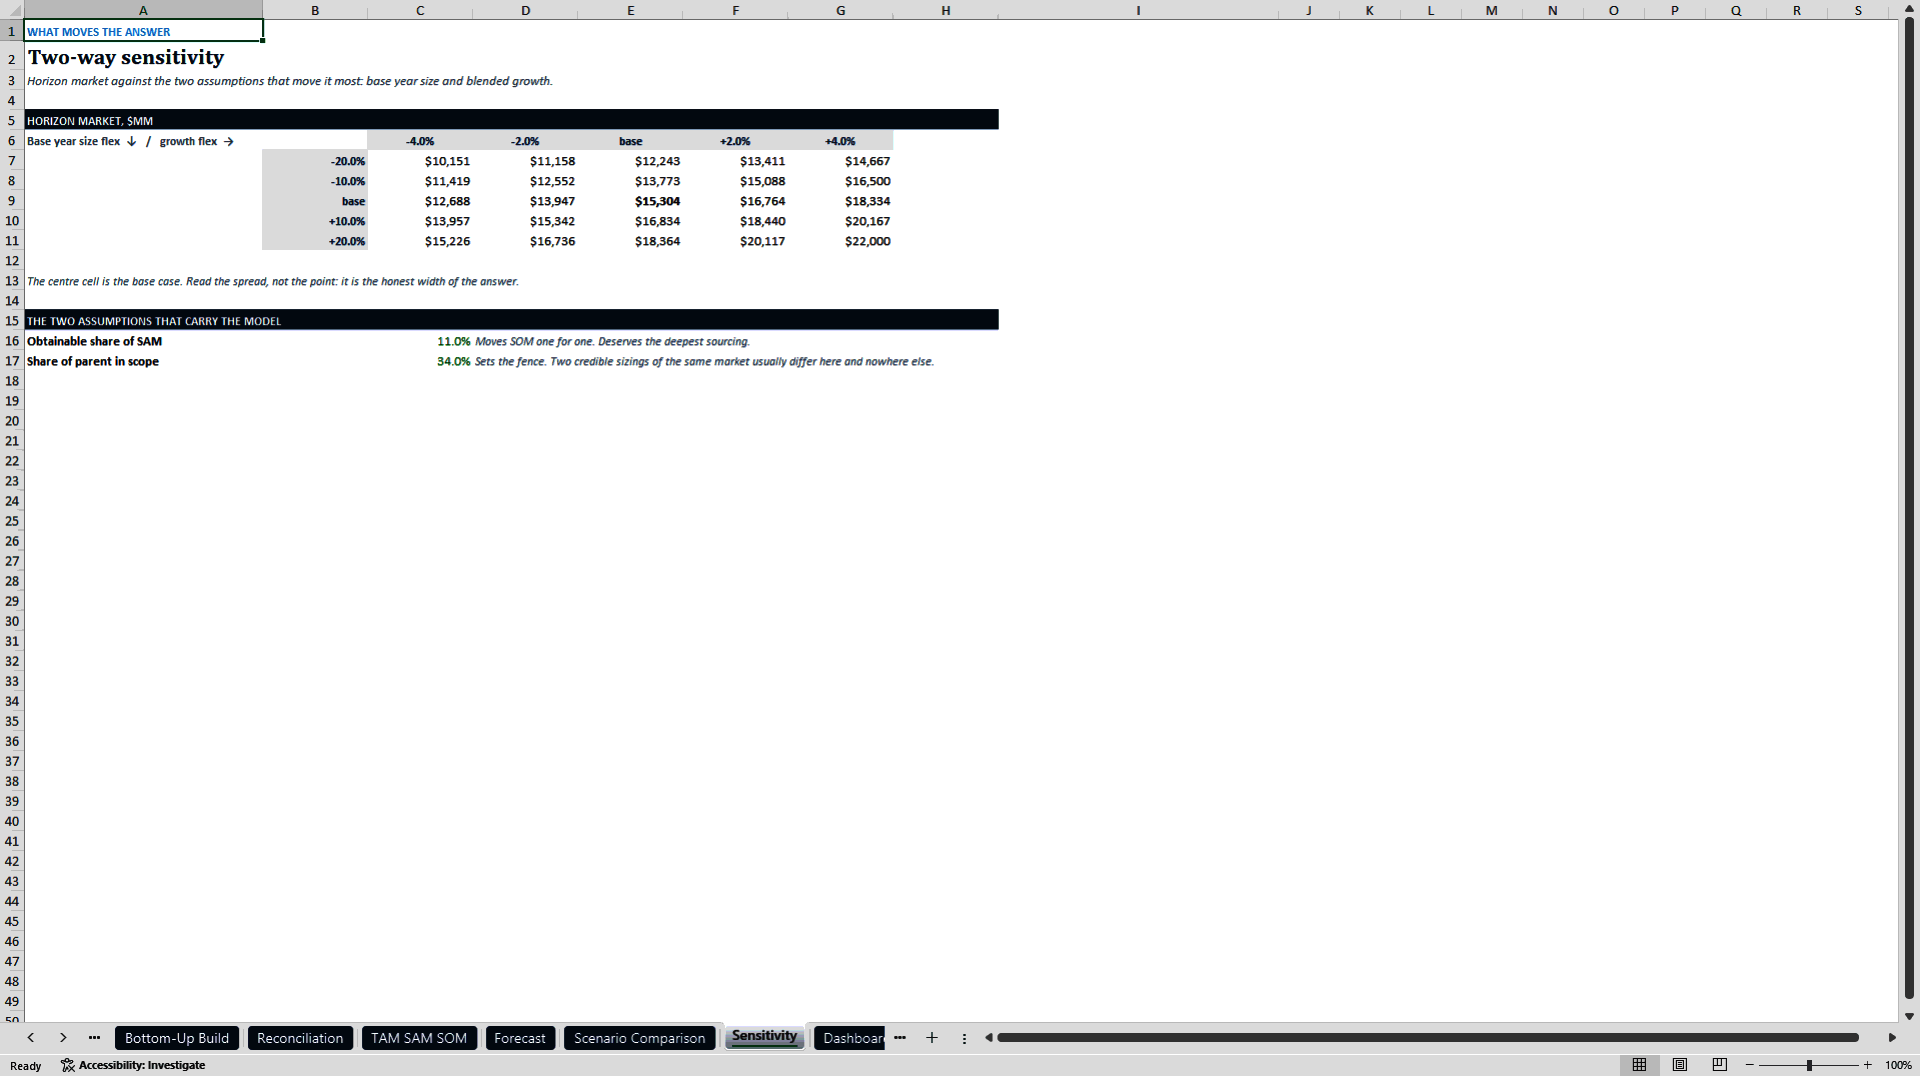
- Forecasts five years by segment on three governed scenarios with a two-way sensitivity grid, all from one engine, so the answer travels as a range with a stated width.
MARKET SIZING EXCEL DESCRIPTION
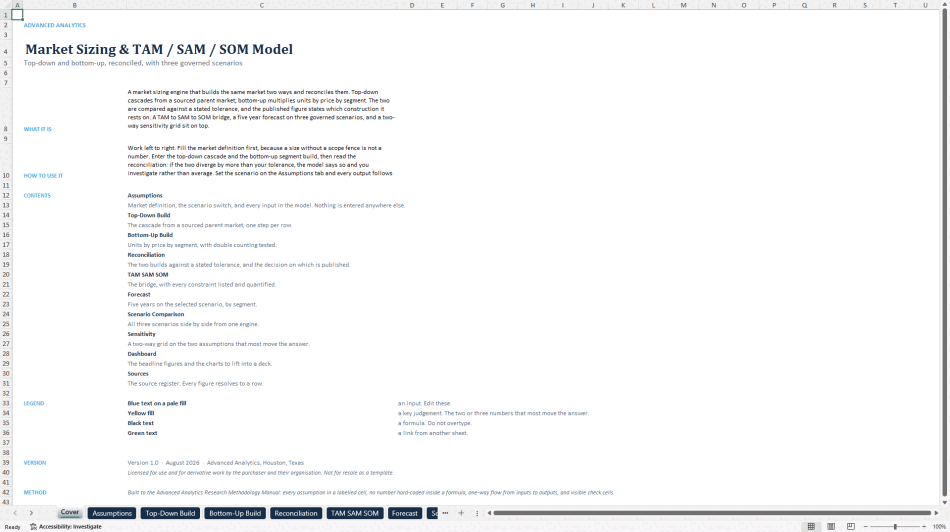
Most market sizing models pick one construction and hope. This eleven-tab workbook builds the market twice and makes you resolve the difference.
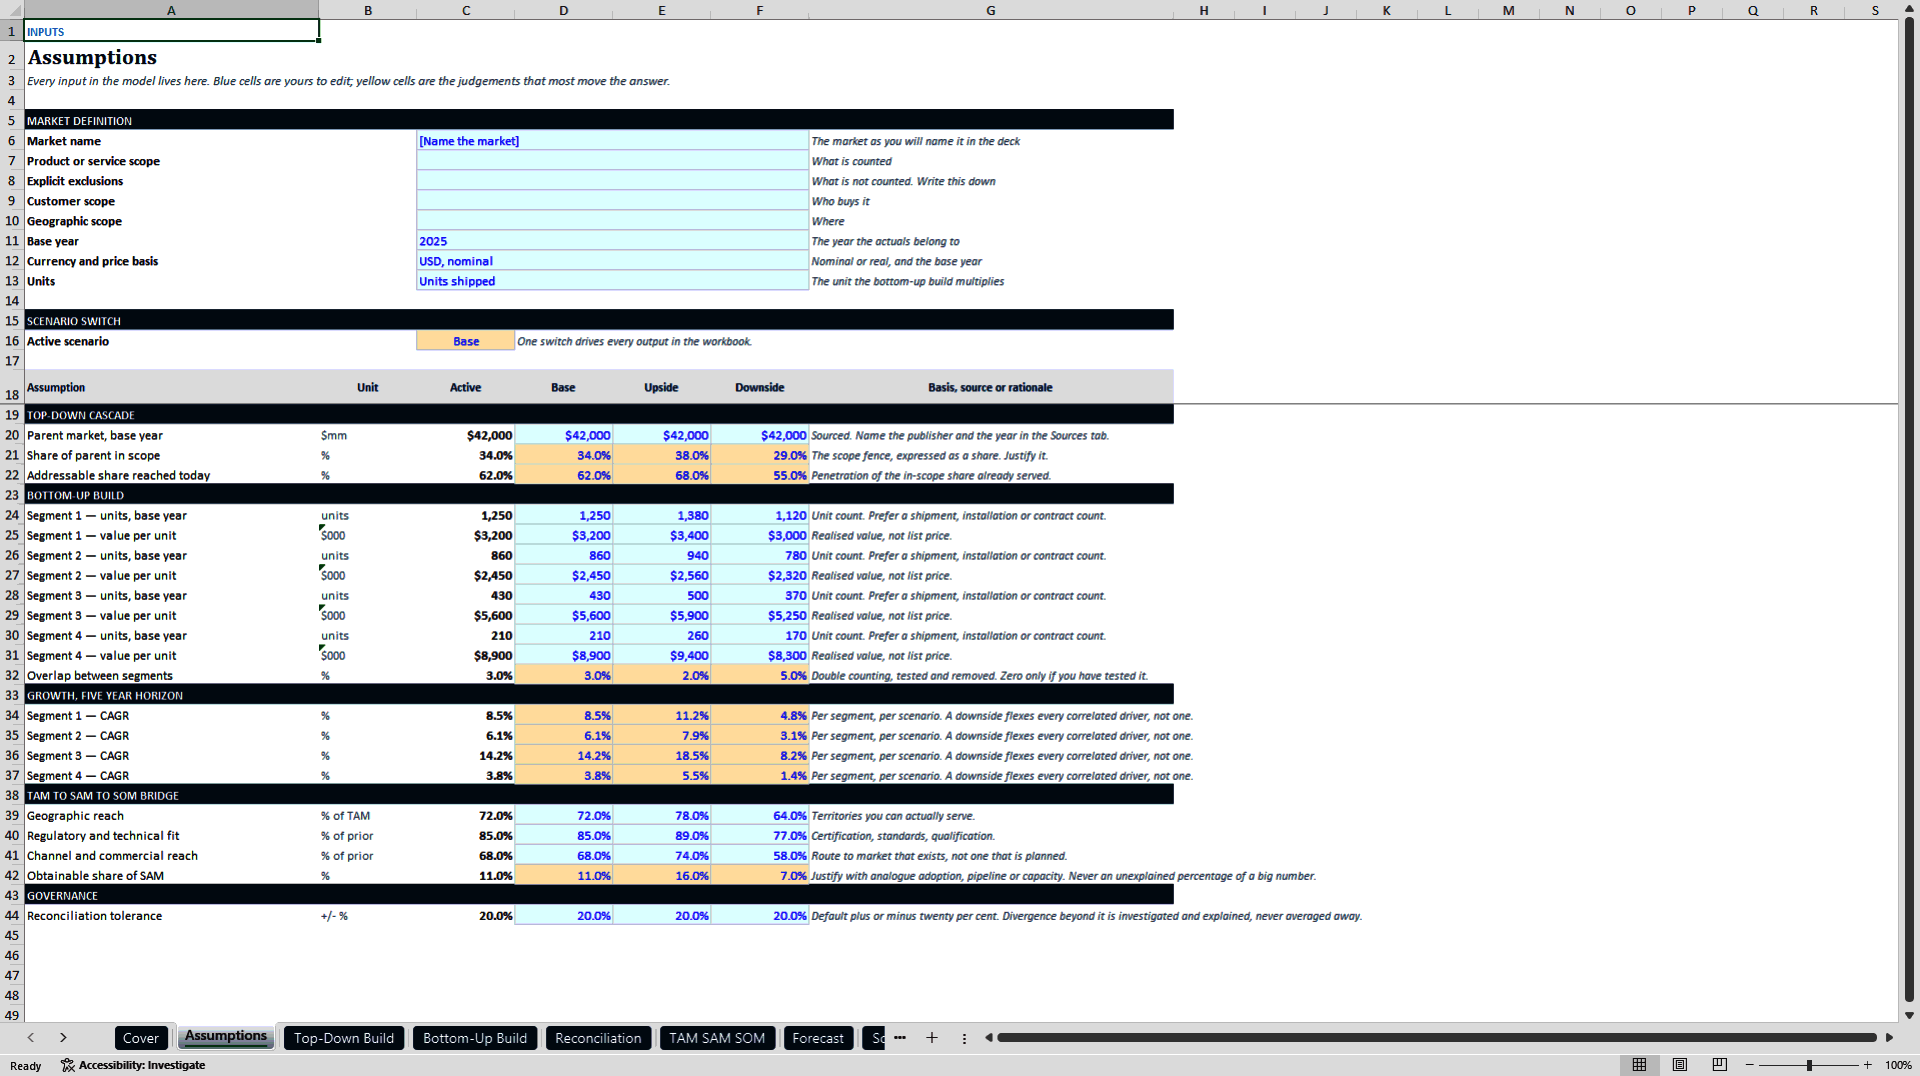
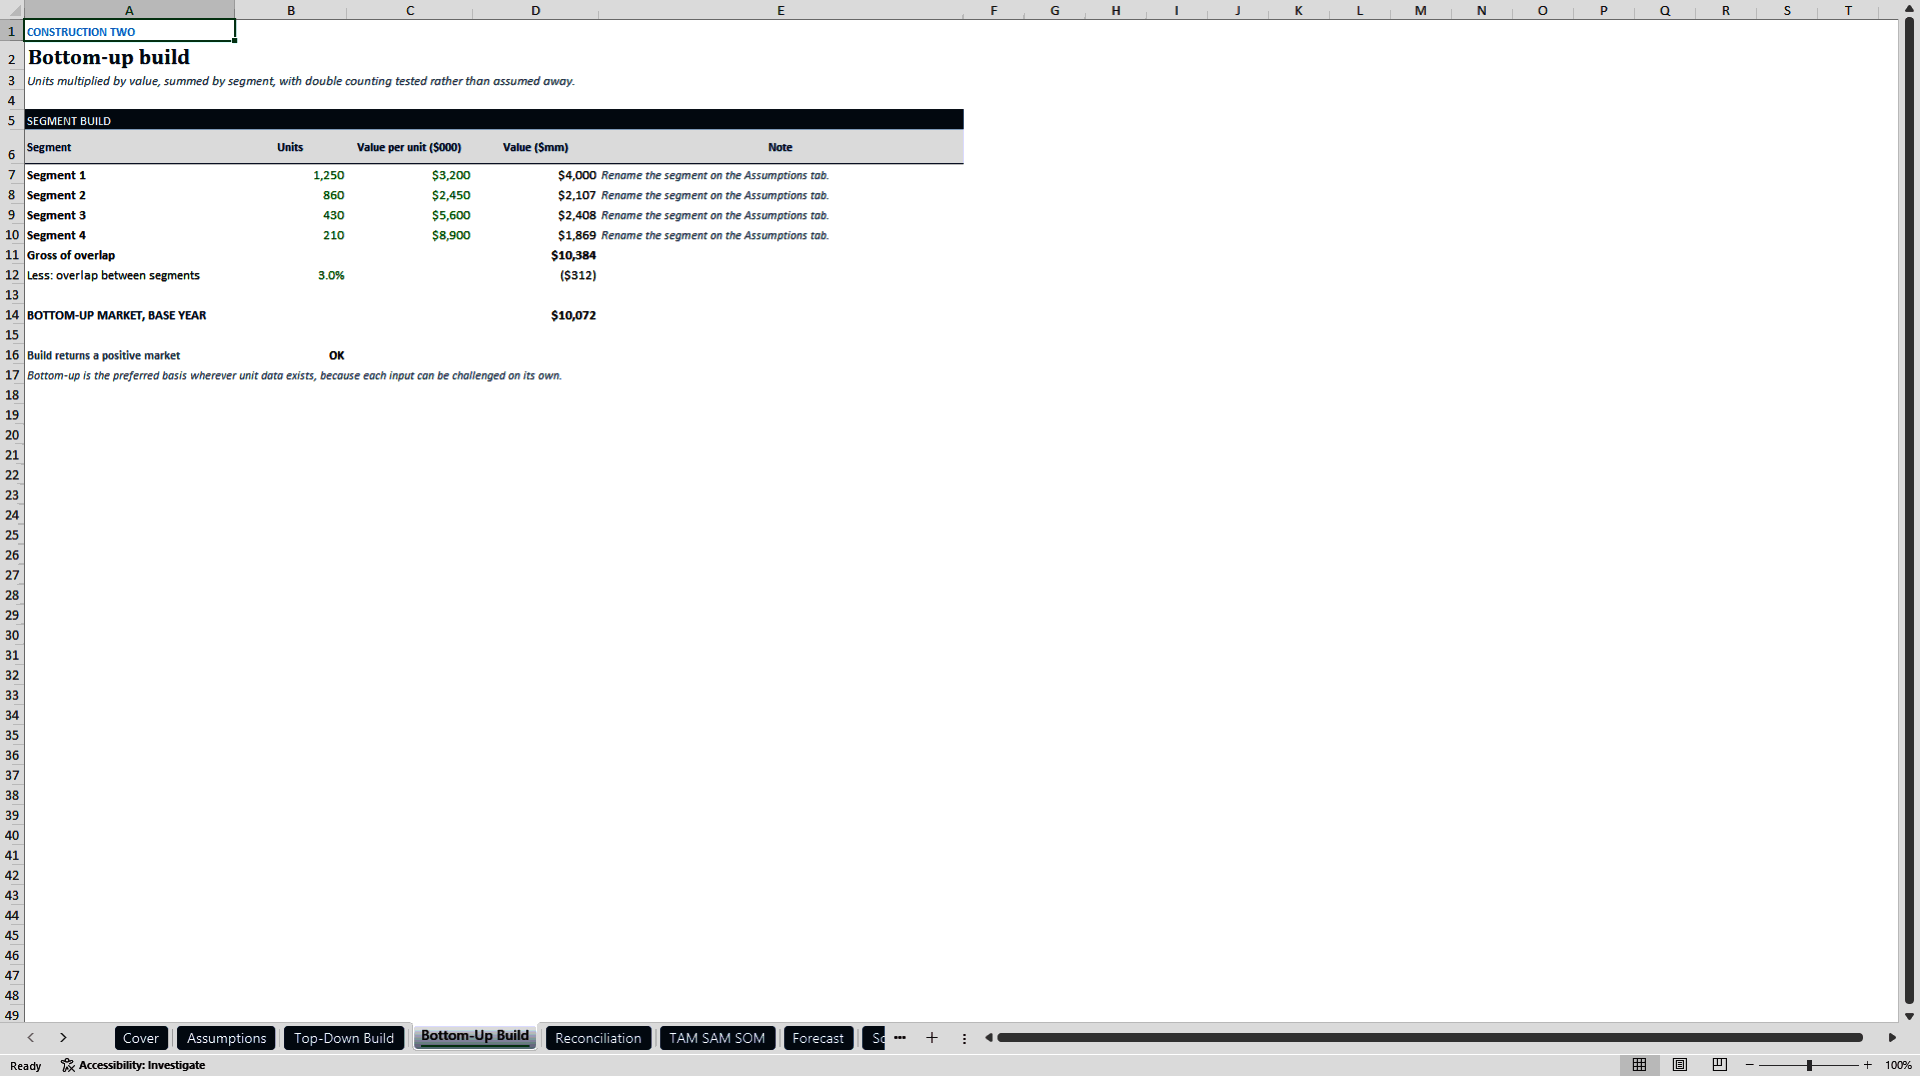
The top-down cascade runs from a sourced parent market through a scope fence to current penetration, one step per row. The bottom-up build multiplies units by realised value across four segments and tests for double counting rather than assuming it away. The two are compared against a stated tolerance, and the model records which construction the published figure rests on. Divergence is investigated, never averaged away.
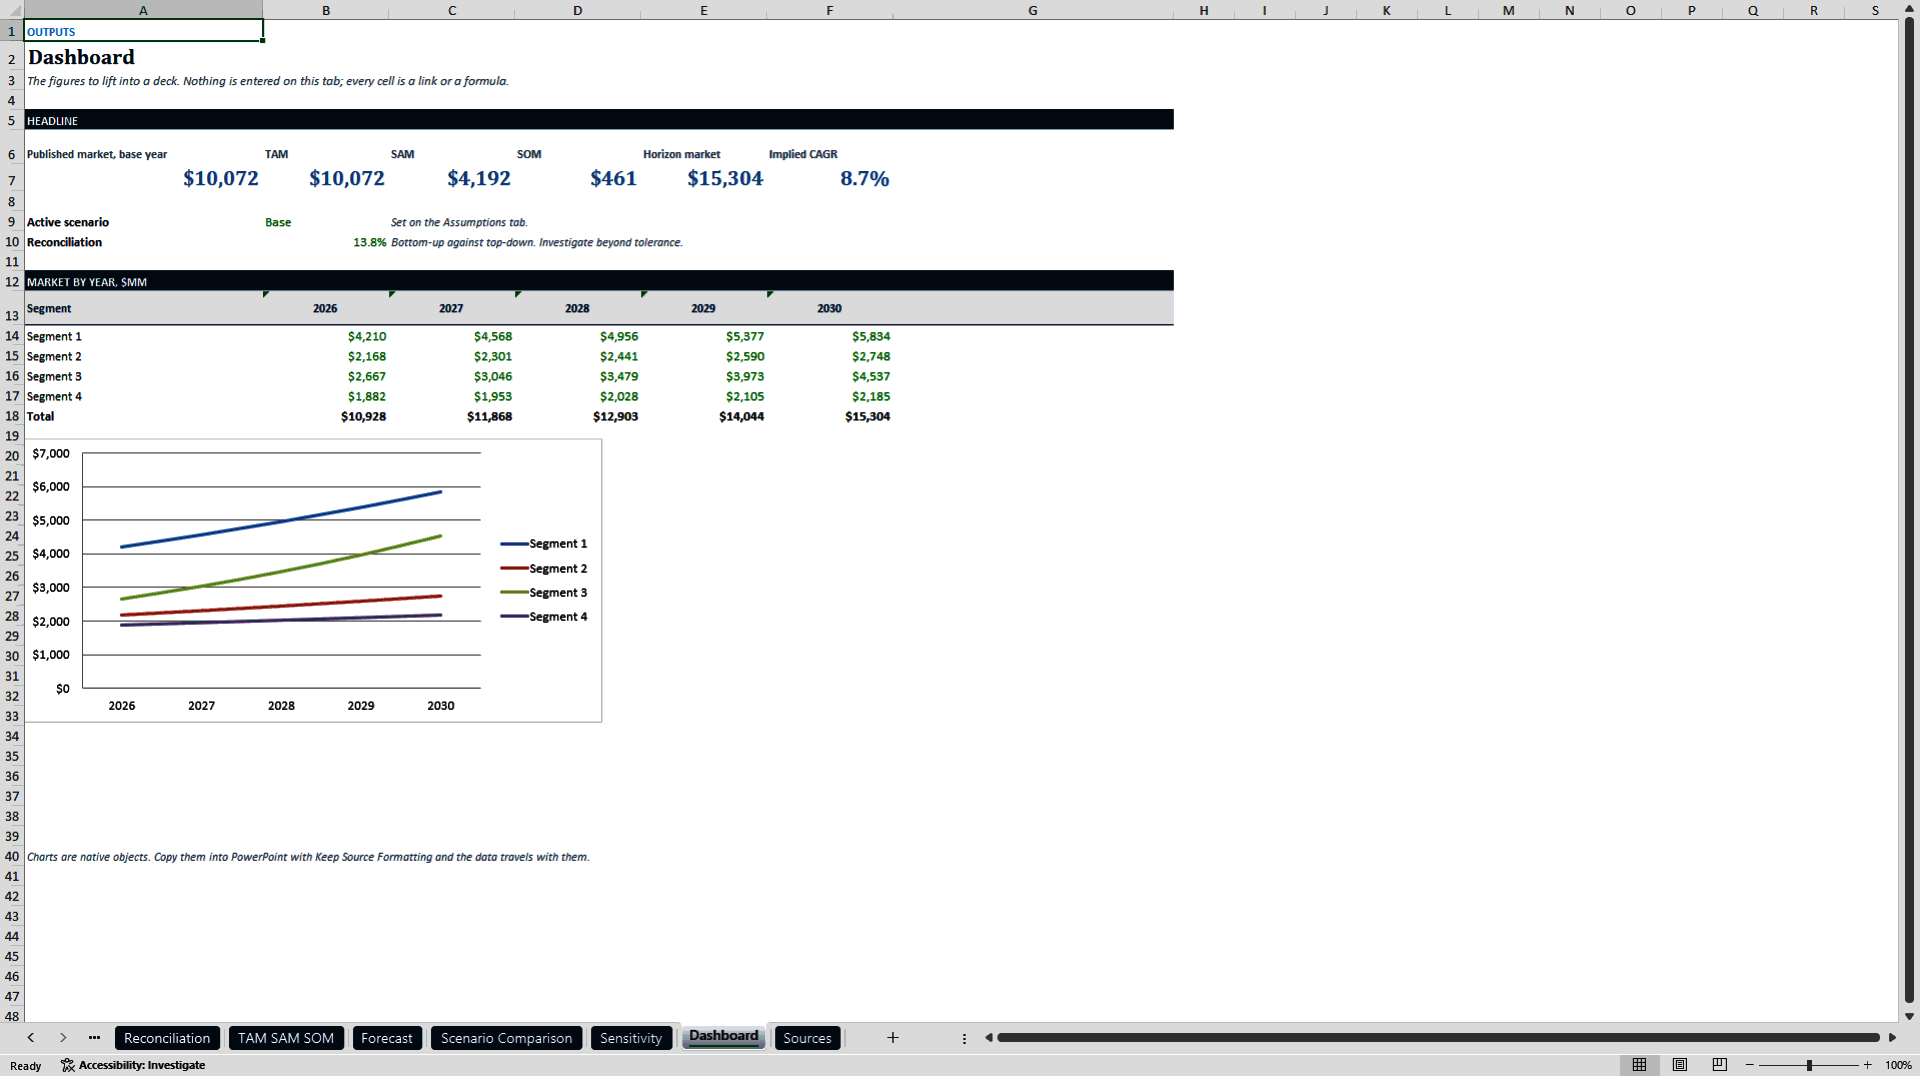
On top sit a TAM to SAM to SOM bridge with every narrowing constraint named and quantified, a five-year segment forecast, a three-scenario comparison from one engine, a two-way sensitivity grid, and a dashboard of figures and native charts to lift into a deck.
It starts where a defensible sizing has to start: scope, exclusions, customer, geography, base year, currency basis and unit are all required, because a size without a scope fence is not a number. The source register keeps a sourced fact, a third-party estimate and your own judgement in separate tiers.
A modelling framework – figures shipped are illustrative.
Got a question about the product? Email us at support@flevy.com or ask the author directly by using the "Ask the Author a Question" form. If you cannot view the preview above this document description, go here to view the large preview instead.
Source: Best Practices in Market Sizing Excel: Market Sizing Model: TAM, SAM, SOM with Top-Down and Bottom- Excel (XLSX) Spreadsheet, Advanced Analytics
ABOUT THE AUTHOR

Advanced Analytics is an independent institutional research and forecasting firm in Houston, Texas, founded in 2016. We build market forecasts and decision models for the industries powering the AI buildout -- grid equipment, data centre infrastructure, nuclear, semiconductors and industrial capital goods -- for institutional investors, private equity, manufacturers and utilities. The documents ... [read more]
Ask the Author a Question
You must be logged in to contact the author.




























