5-Year Market Forecast Model: Top-Down and Bottom-Up Build   Excel template (XLSX)
$69.00

5-Year Market Forecast Model: Top-Down and Bottom-Up Build (Excel template (XLSX)) Preview Image
Log in to unlock full preview.
5-Year Market Forecast Model: Top-Down and Bottom-Up Build (Excel template (XLSX)) Preview Image
Arrow   Click main image to view in full screen. Unlock all 9 preview images:   Login Register

5-Year Market Forecast Model: Top-Down and Bottom-Up Build – Excel XLSX

Excel (XLSX)

$69.00
Built by Advanced Analytics, an independent institutional research and forecasting firm in Houston, Texas
Add to Cart


Immediate download
Fully editable Excel
Free lifetime updates

BENEFITS OF THIS DOWNLOADABLE EXCEL DOCUMENT

  1. Build a forecast you can defend under questioning. Top down and bottom up, reconciled against a stated tolerance, with the divergence surfaced rather than smoothed. Extrapolating one growth rate is what everyone else hands the board.
  2. Run base, upside and downside from a single switch. One calculation engine drives all three, so demand, segments, regions and capacity utilisation move together and stay consistent. No parallel copies to fall out of sync.
  3. Hand a reviewer something auditable in one pass. Every assumption in one place, color coded for evidence against judgement, eleven live check cells that fail loudly, and a gate sign off sheet that records who checked what.

MARKET SIZING EXCEL DESCRIPTION

5-Year Market Forecast Model: Top-Down and Bottom-Up Build is an Excel template (XLSX) available for immediate download upon purchase.

A working five year forecast engine, not a formatted blank. Enter a market and it builds the forecast two ways, then makes you reconcile them.

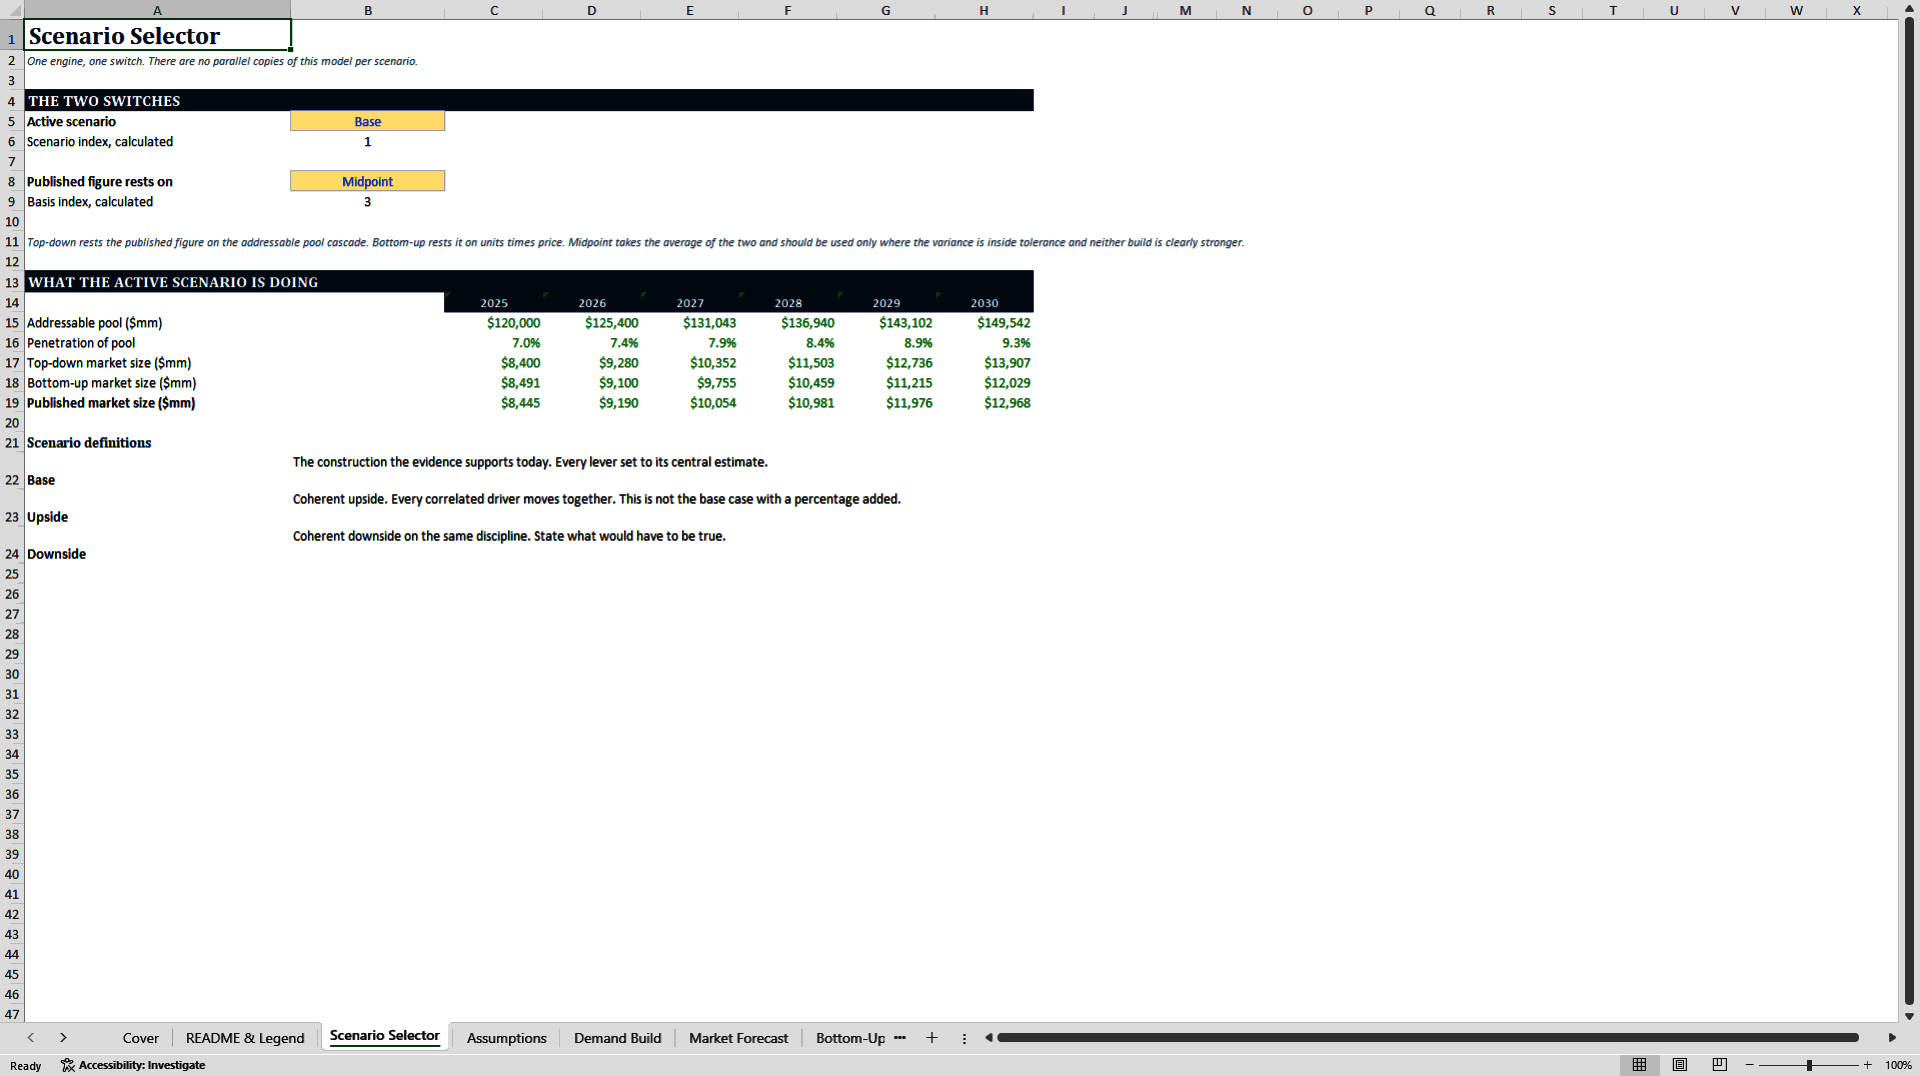
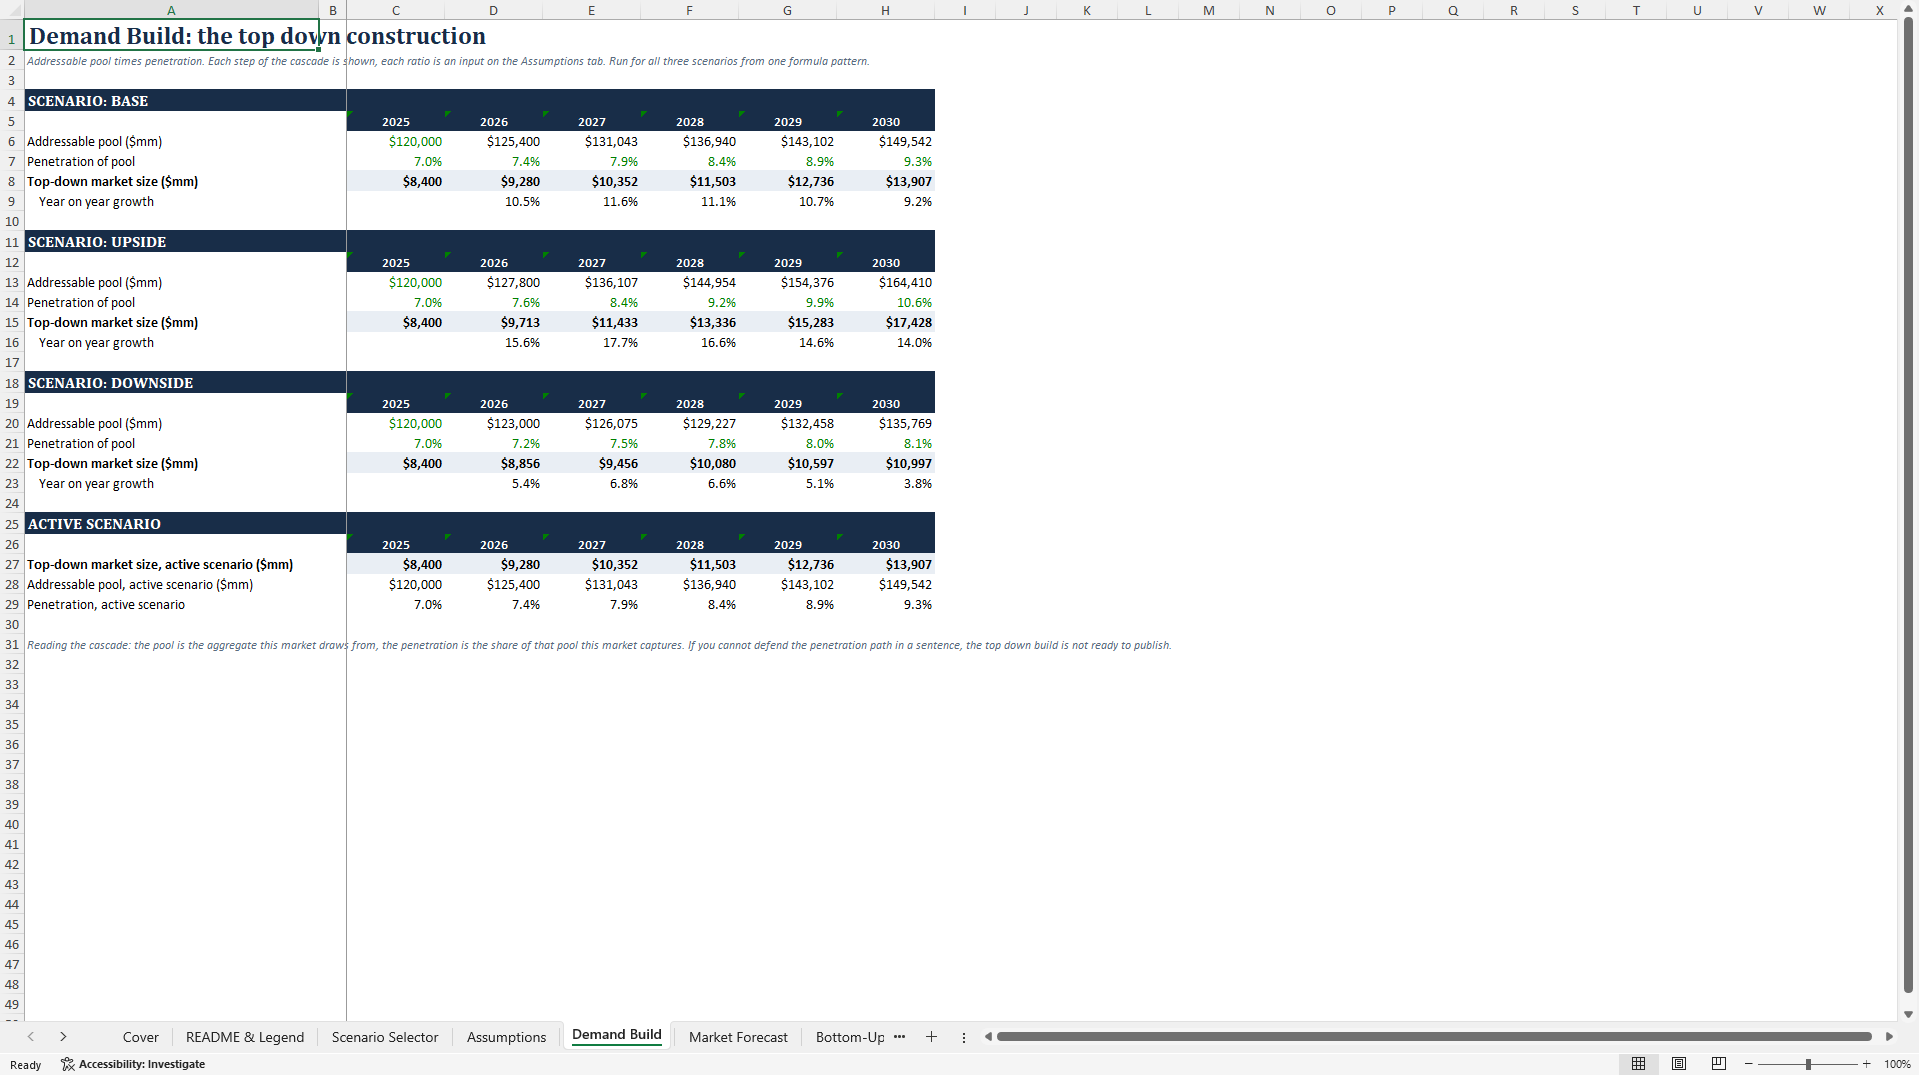
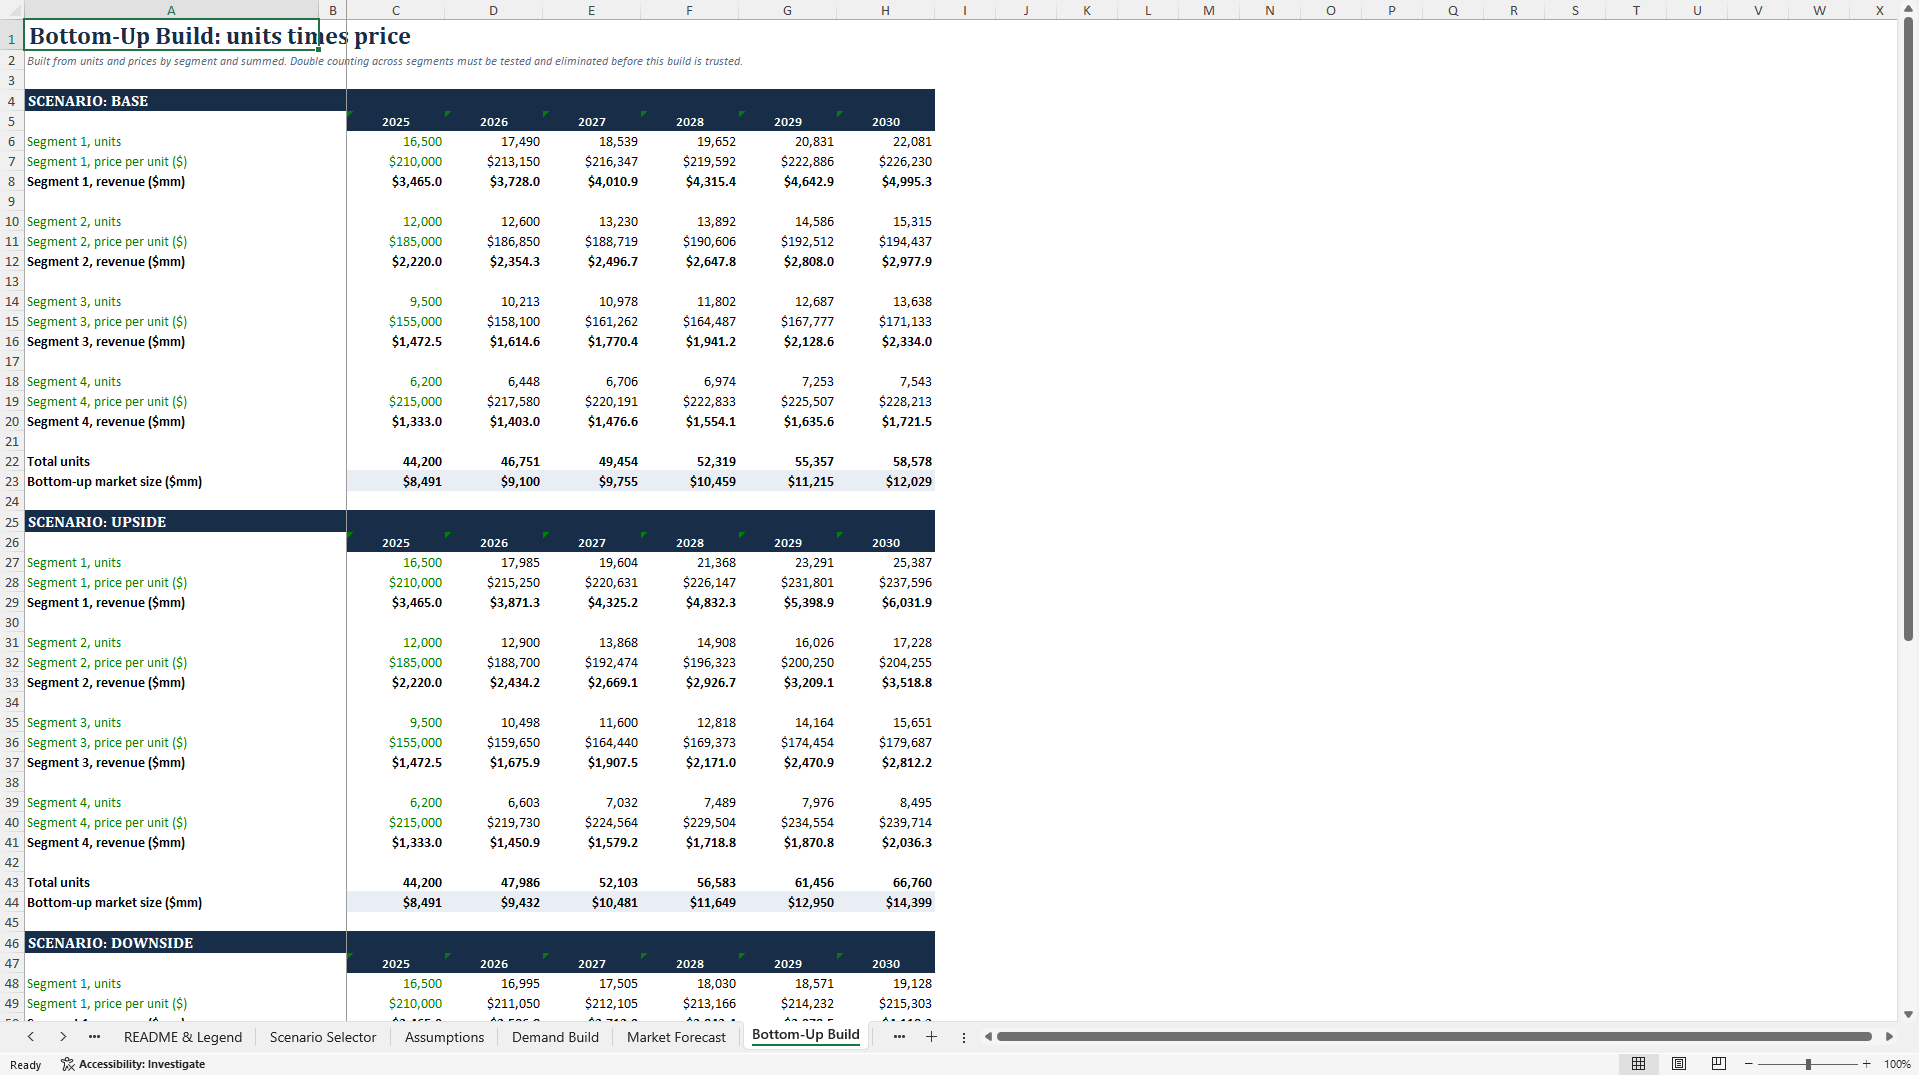
Most forecast templates hand you a growth rate and a row of years. This one builds the market top down from an addressable pool and a penetration path you shape year by year, builds it again bottom up from units and prices by segment, sets the two side by side, and tests the variance against a tolerance you set. Where the two builds disagree by more than you allow, the model reads INVESTIGATE rather than quietly averaging the problem away. You choose which construction the published figure rests on, and the choice is recorded on the face of the model.

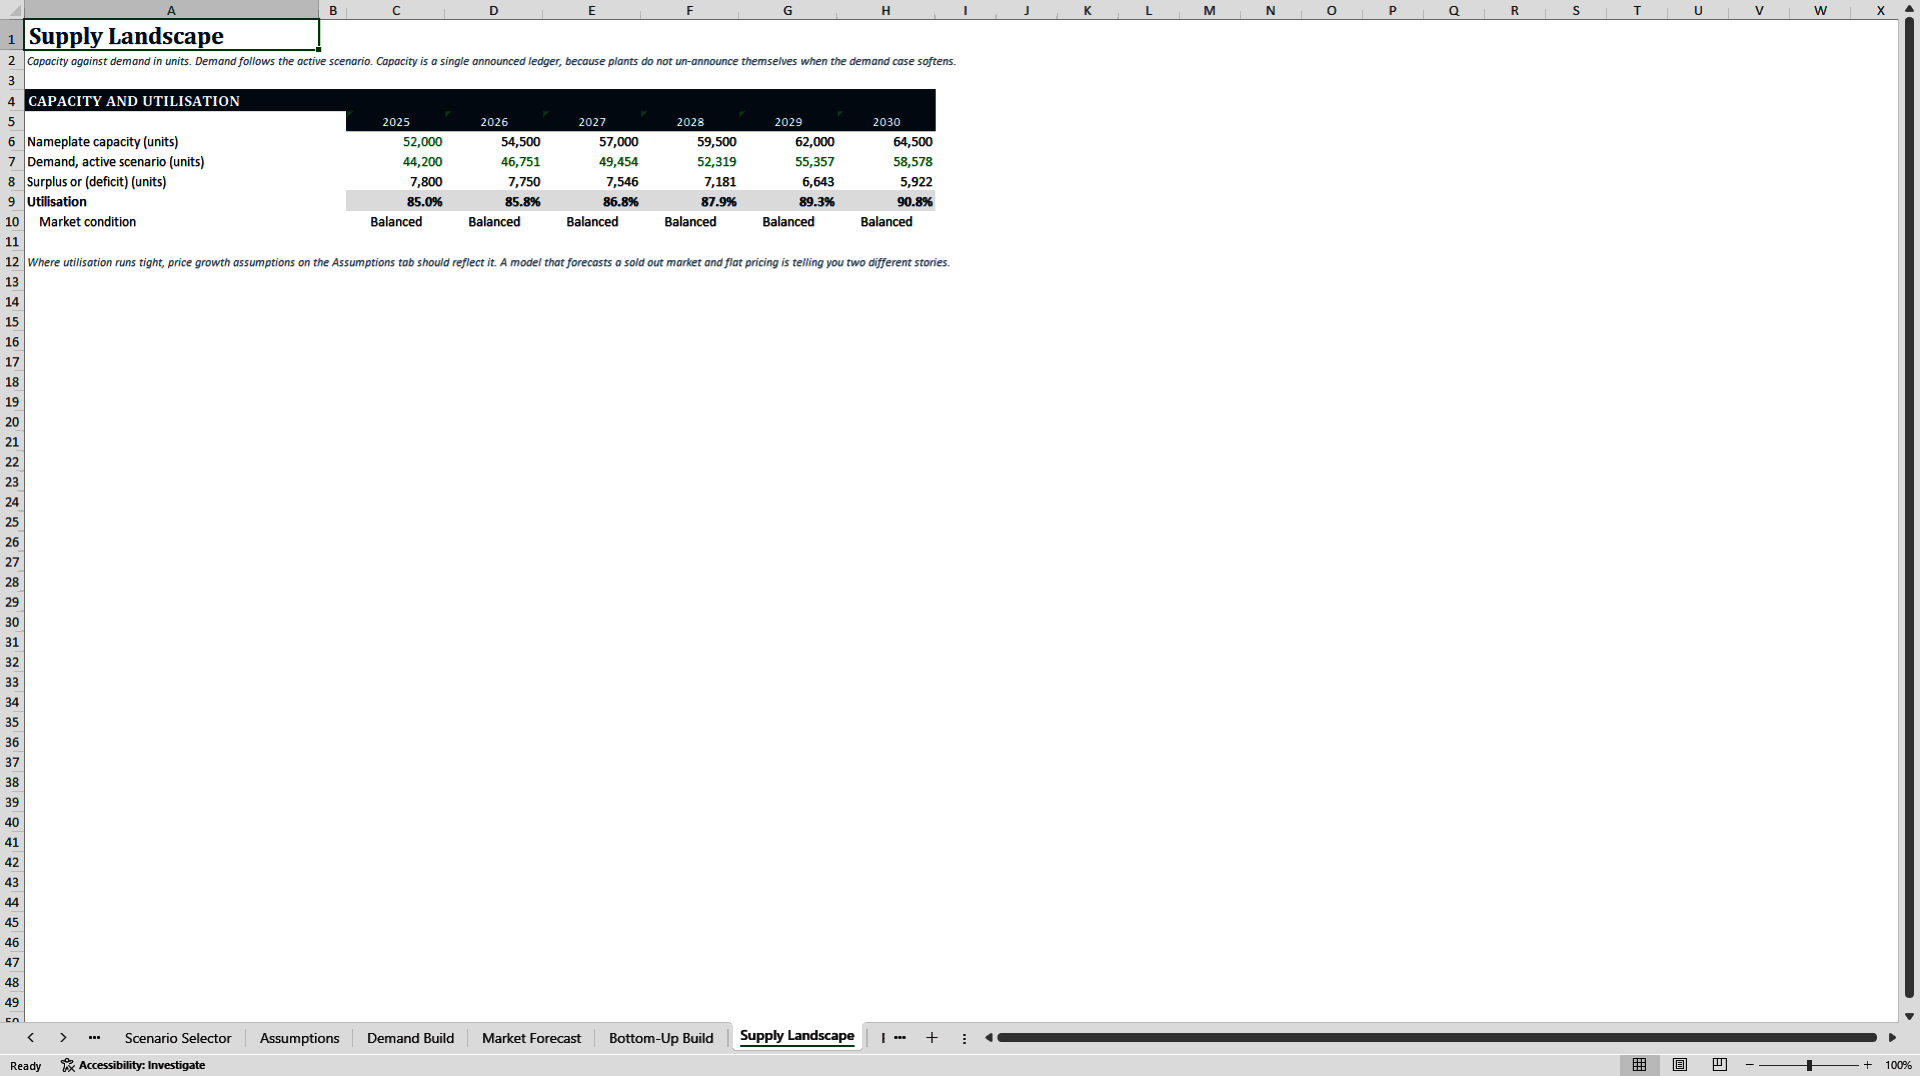
Three scenarios run off one calculation engine and one switch. Change the switch and the demand build, the bottom up build, the segment split, the regional allocation and the supply utilisation all move together. There are no parallel copies of the model to keep in sync, which is where scenario workbooks usually break.

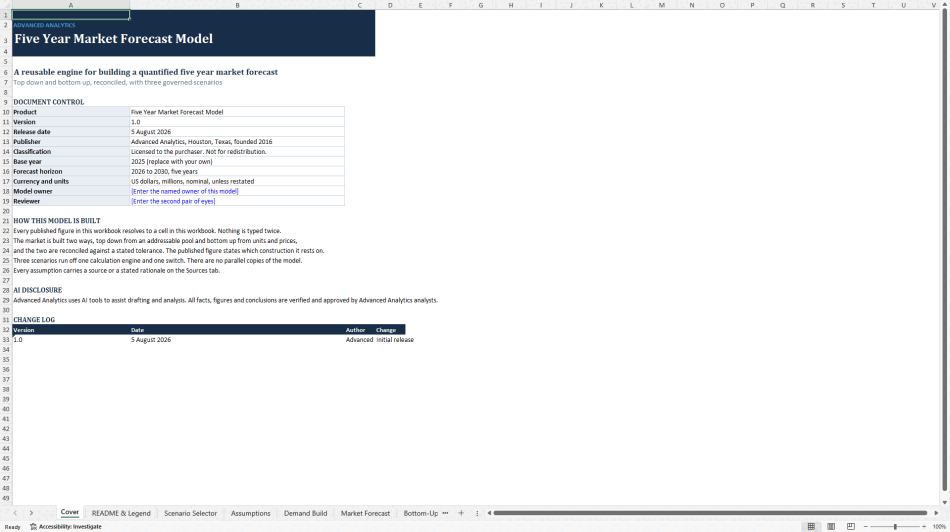
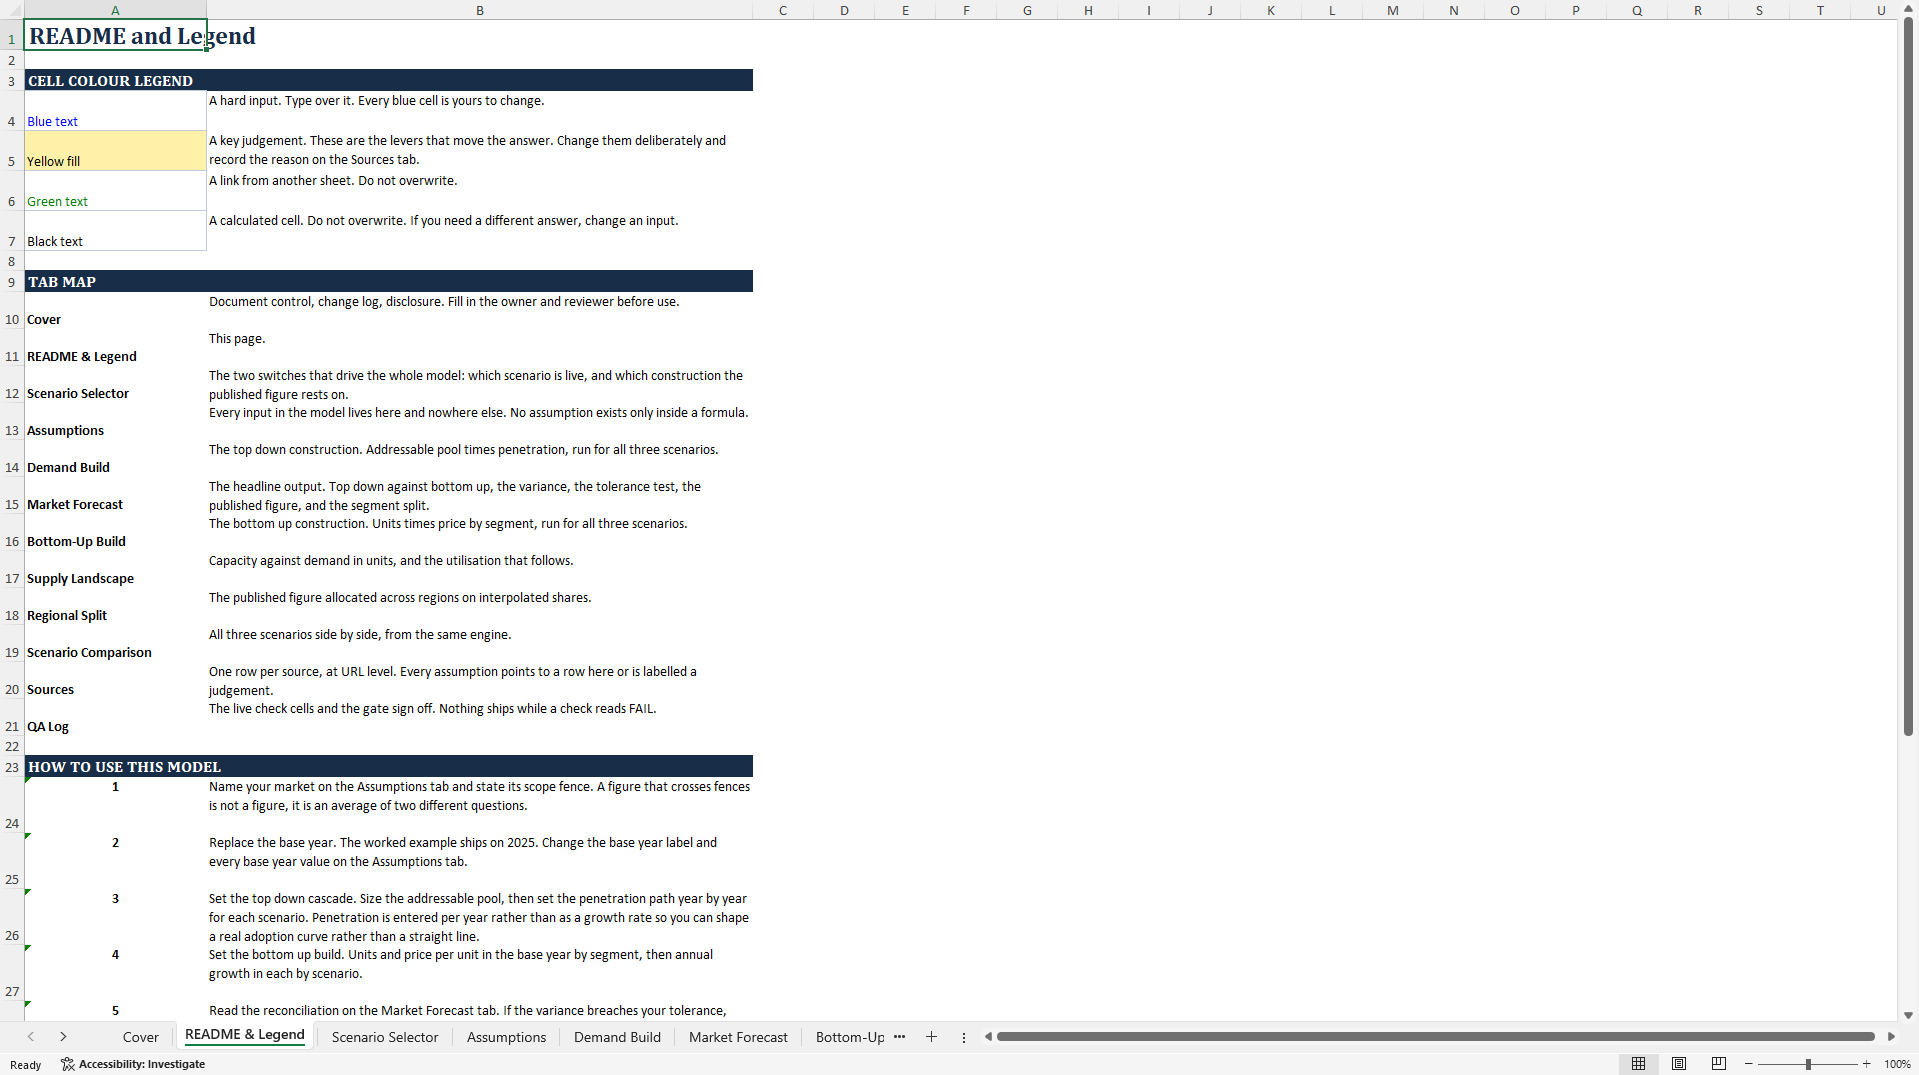
Twelve tabs: Cover, README and Legend, Scenario Selector, Assumptions, Demand Build, Market Forecast, Bottom-Up Build, Supply Landscape, Regional Split, Scenario Comparison, Sources, QA Log.

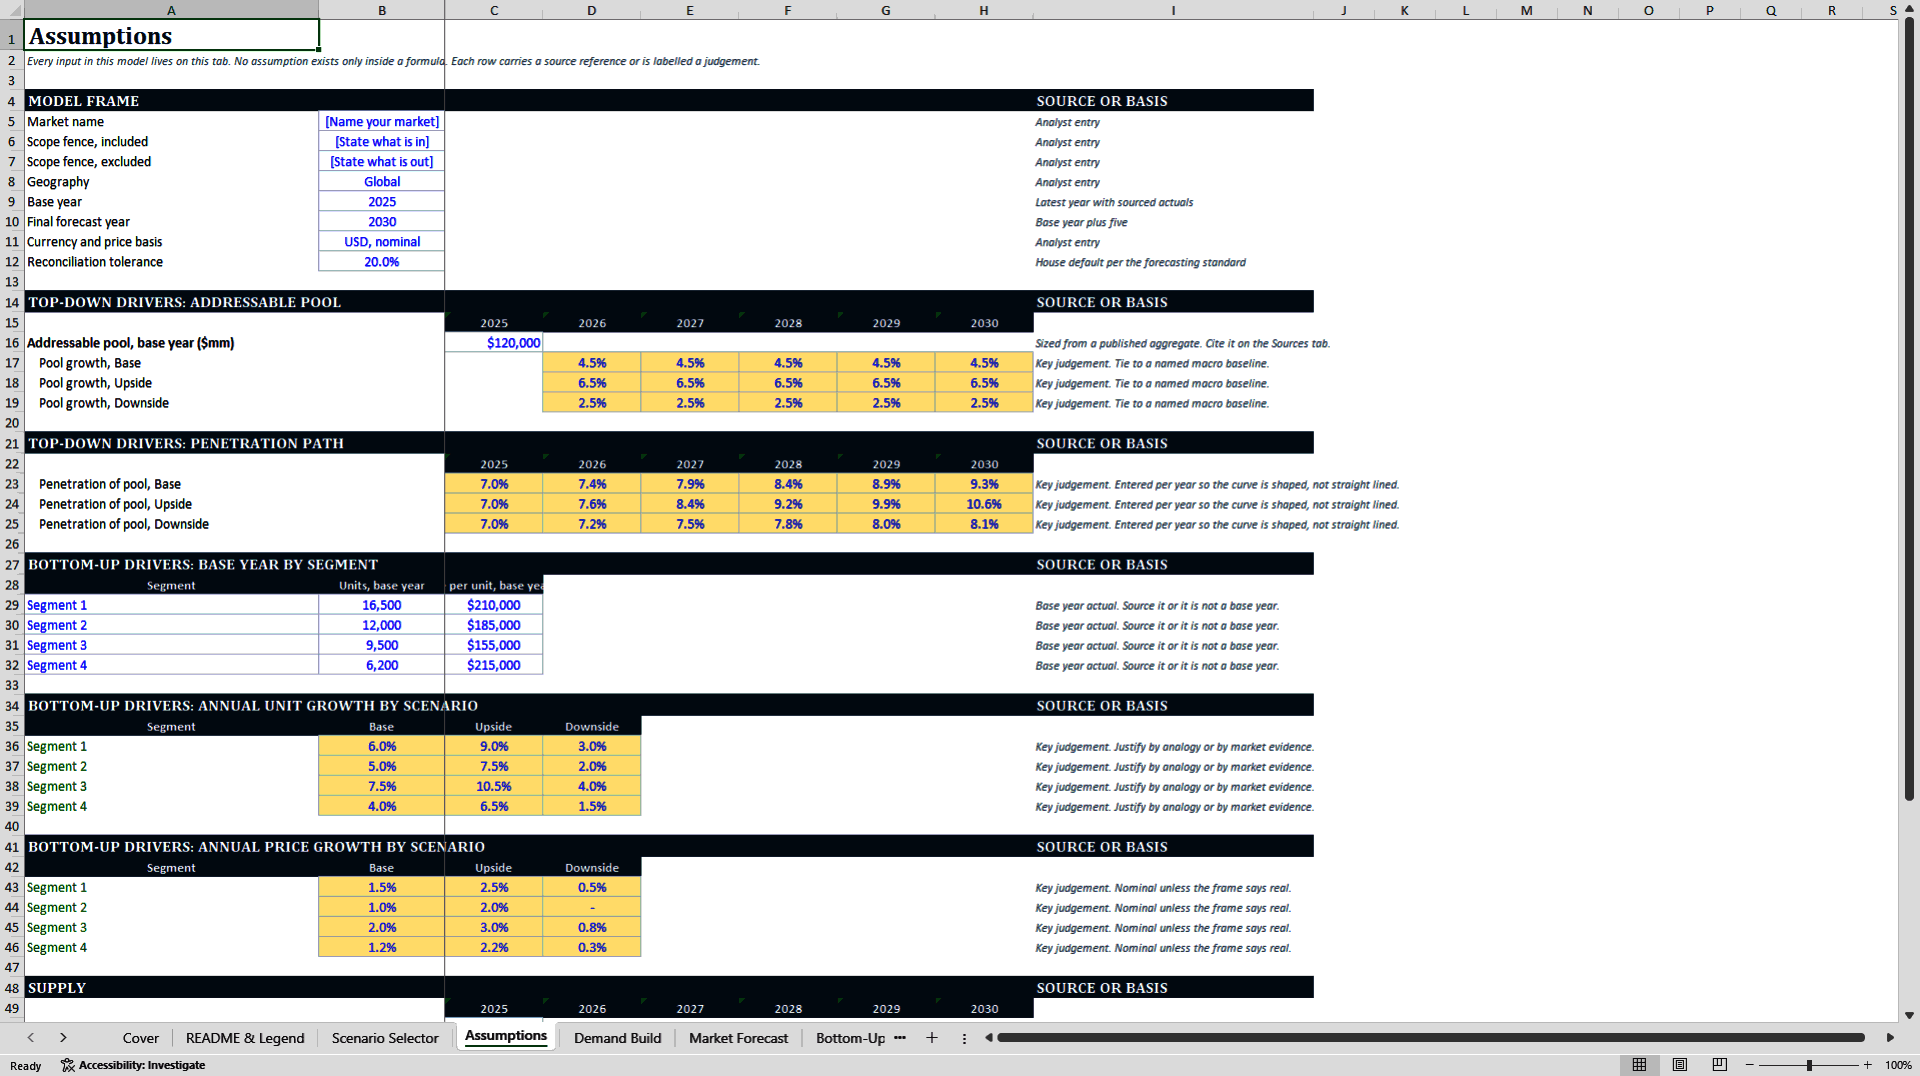
Every input lives on the Assumptions tab and nowhere else. No assumption is buried inside a formula. Inputs are blue, key judgements are yellow, calculated cells are black, cross sheet links are green, so a reviewer can see in a single pass what is evidence and what is your judgement.

The QA Log carries eleven live check cells that recalculate with the model: shares summing to 100 per cent in every year, segment and regional revenue tying to the headline figure, scenarios ordered coherently, capacity covering demand, penetration paths inside bounds. Beneath them sits a nine gate sign off sheet covering sourcing, numerical, reconciliation, scenario, sensitivity, mechanics, confidence, disclosure and register.
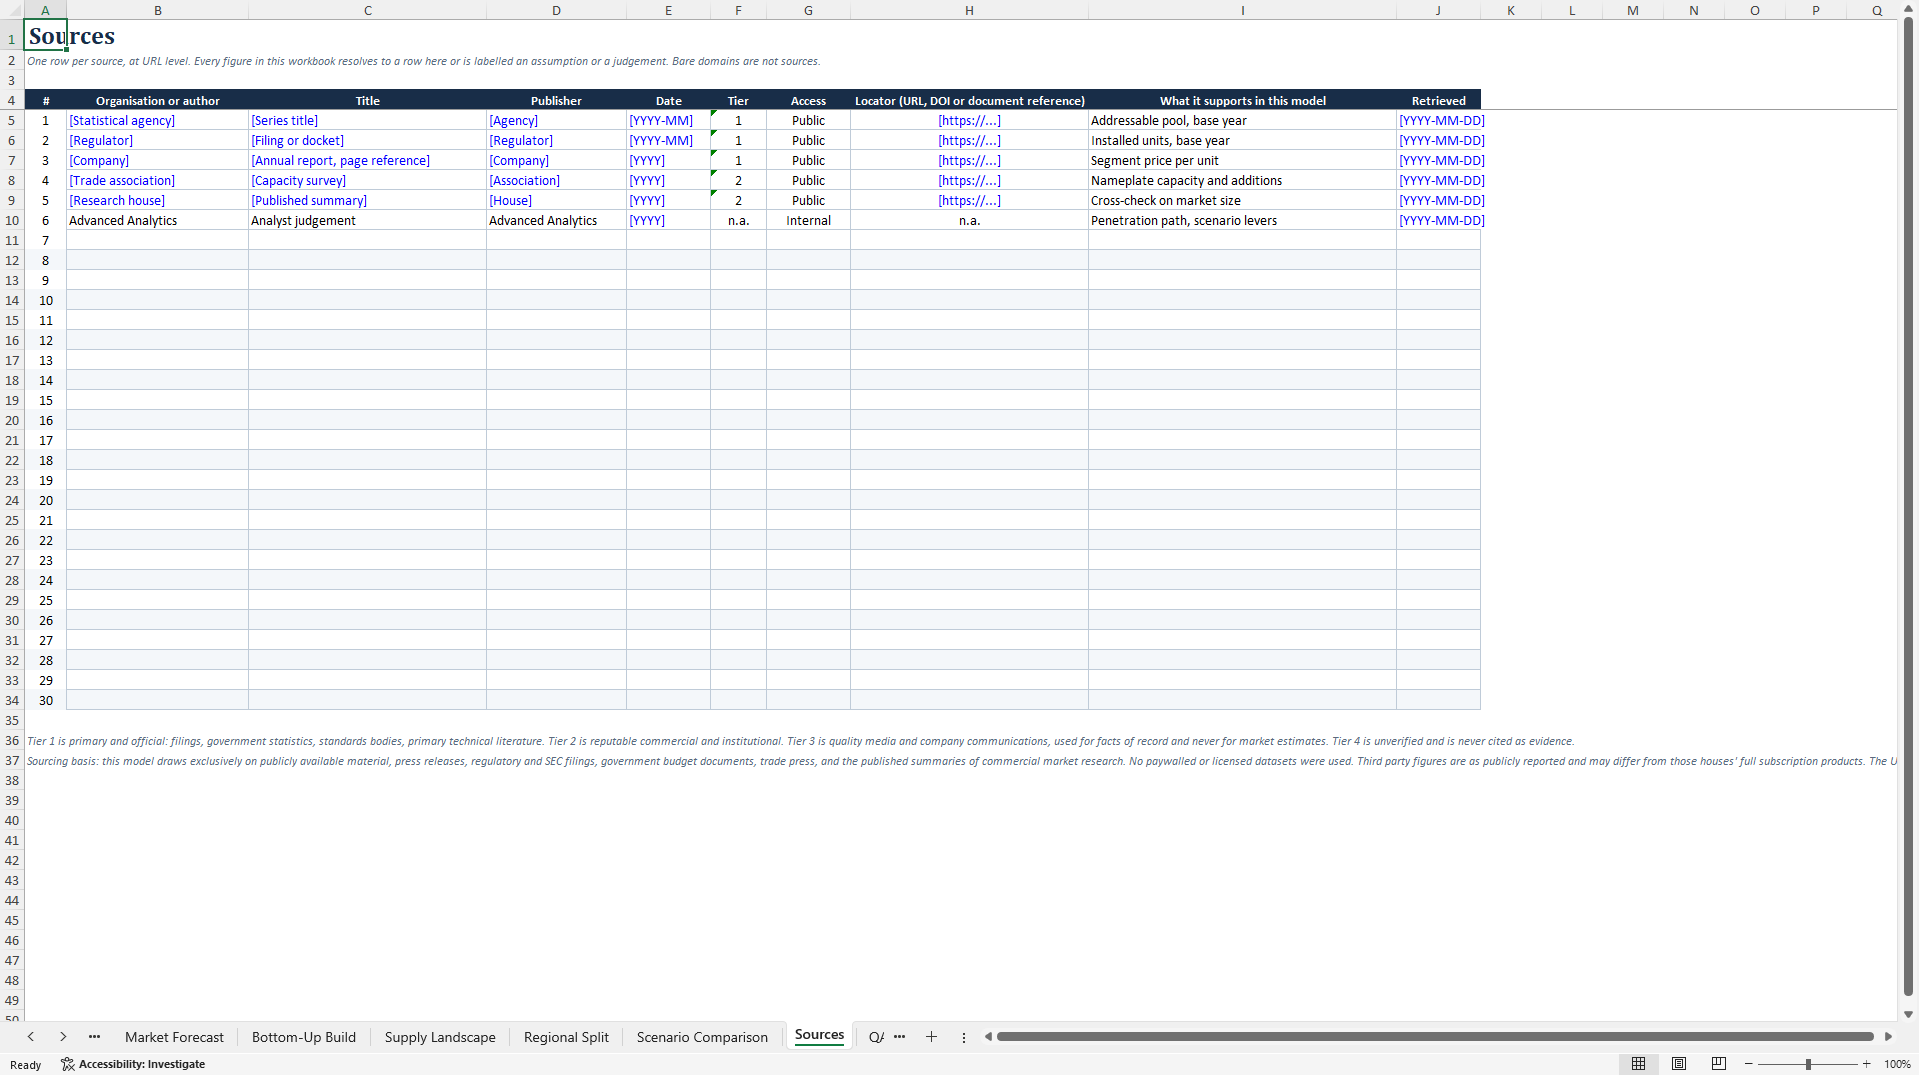
Industry agnostic. It ships on a worked example so you can see every formula pulling before you touch it, and the README tells you exactly which cells to replace. The Sources tab holds a URL level register so every assumption you enter points at something a skeptical reader can retrieve.

Built by an independent institutional research firm that ships this discipline on paid forecast work, and holds itself to it.

Got a question about the product? Email us at support@flevy.com or ask the author directly by using the "Ask the Author a Question" form. If you cannot view the preview above this document description, go here to view the large preview instead.

Source: Best Practices in Market Sizing Excel: 5-Year Market Forecast Model: Top-Down and Bottom-Up Build Excel (XLSX) Spreadsheet, Advanced Analytics


$69.00
Built by Advanced Analytics, an independent institutional research and forecasting firm in Houston, Texas
Add to Cart
  

ABOUT THE AUTHOR

Author image
Additional documents from author: 8

Advanced Analytics is an independent institutional research and forecasting firm in Houston, Texas, founded in 2016. We build market forecasts and decision models for the industries powering the AI buildout -- grid equipment, data centre infrastructure, nuclear, semiconductors and industrial capital goods -- for institutional investors, private equity, manufacturers and utilities. The documents ... [read more]

Ask the Author a Question

You must be logged in to contact the author.

Click here to log in Click here register

Did you know?
The average daily rate of a McKinsey consultant is $6,625 (not including expenses). The average price of a Flevy document is $65.



Trusted by over 10,000+ Client Organizations
Since 2012, we have provided business templates to over 10,000 businesses and organizations of all sizes, from startups and small businesses to the Fortune 100, in over 130 countries.
AT&T GE Cisco Intel IBM Coke Dell Toyota HP Nike Samsung Microsoft Astrazeneca JP Morgan KPMG Walgreens Walmart 3M Kaiser Oracle SAP Google E&Y Volvo Bosch Merck Fedex Shell Amgen Eli Lilly Roche AIG Abbott Amazon PwC T-Mobile Broadcom Bayer Pearson Titleist ConEd Pfizer NTT Data Schwab


Read Customer Testimonials

 
"The wide selection of frameworks is very useful to me as an independent consultant. In fact, it rivals what I had at my disposal at Big 4 Consulting firms in terms of efficacy and organization."

– Julia T., Consulting Firm Owner (Former Manager at Deloitte and Capgemini)
 
"As an Independent Management Consultant, I find Flevy to add great value as a source of best practices, templates and information on new trends. Flevy has matured and the quality and quantity of the library is excellent. Lastly the price charged is reasonable, creating a win-win value for "

– Jim Schoen, Principal at FRC Group
 
"[Flevy] produces some great work that has been/continues to be of immense help not only to myself, but as I seek to provide professional services to my clients, it gives me a large "tool box" of resources that are critical to provide them with the quality of service and outcomes they are expecting."

– Royston Knowles, Executive with 50+ Years of Board Level Experience
 
"My FlevyPro subscription provides me with the most popular frameworks and decks in demand in today’s market. They not only augment my existing consulting and coaching offerings and delivery, but also keep me abreast of the latest trends, inspire new products and service offerings for my practice, and educate me "

– Bill Branson, Founder at Strategic Business Architects
 
"I have found Flevy to be an amazing resource and library of useful presentations for lean sigma, change management and so many other topics. This has reduced the time I need to spend on preparing for my performance consultation. The library is easily accessible and updates are regularly provided. A wealth of great information."

– Cynthia Howard RN, PhD, Executive Coach at Ei Leadership
 
"I like your product. I'm frequently designing PowerPoint presentations for my company and your product has given me so many great ideas on the use of charts, layouts, tools, and frameworks. I really think the templates are a valuable asset to the job."

– Roberto Fuentes Martinez, Senior Executive Director at Technology Transformation Advisory
 
"Last Sunday morning, I was diligently working on an important presentation for a client and found myself in need of additional content and suitable templates for various types of graphics. Flevy.com proved to be a treasure trove for both content and design at a reasonable price, considering the time I "

– M. E., Chief Commercial Officer, International Logistics Service Provider
 
"As a consultant requiring up to date and professional material that will be of value and use to my clients, I find Flevy a very reliable resource.

The variety and quality of material available through Flevy offers a very useful and commanding source for information. Using Flevy saves me time, enhances my expertise and ends up being a good decision."

– Dennis Gershowitz, Principal at DG Associates


Customers Also Like These Documents

Explore Templates on Related Management Topics


Your Recently Viewed Documents