 Click main image to view in full screen. Unlock all 10 preview images:
Investment Holding Company Financial Model – Excel XLSX
Excel (XLSX) + supplemental PDF


BENEFITS OF THIS DOWNLOADABLE EXCEL DOCUMENT
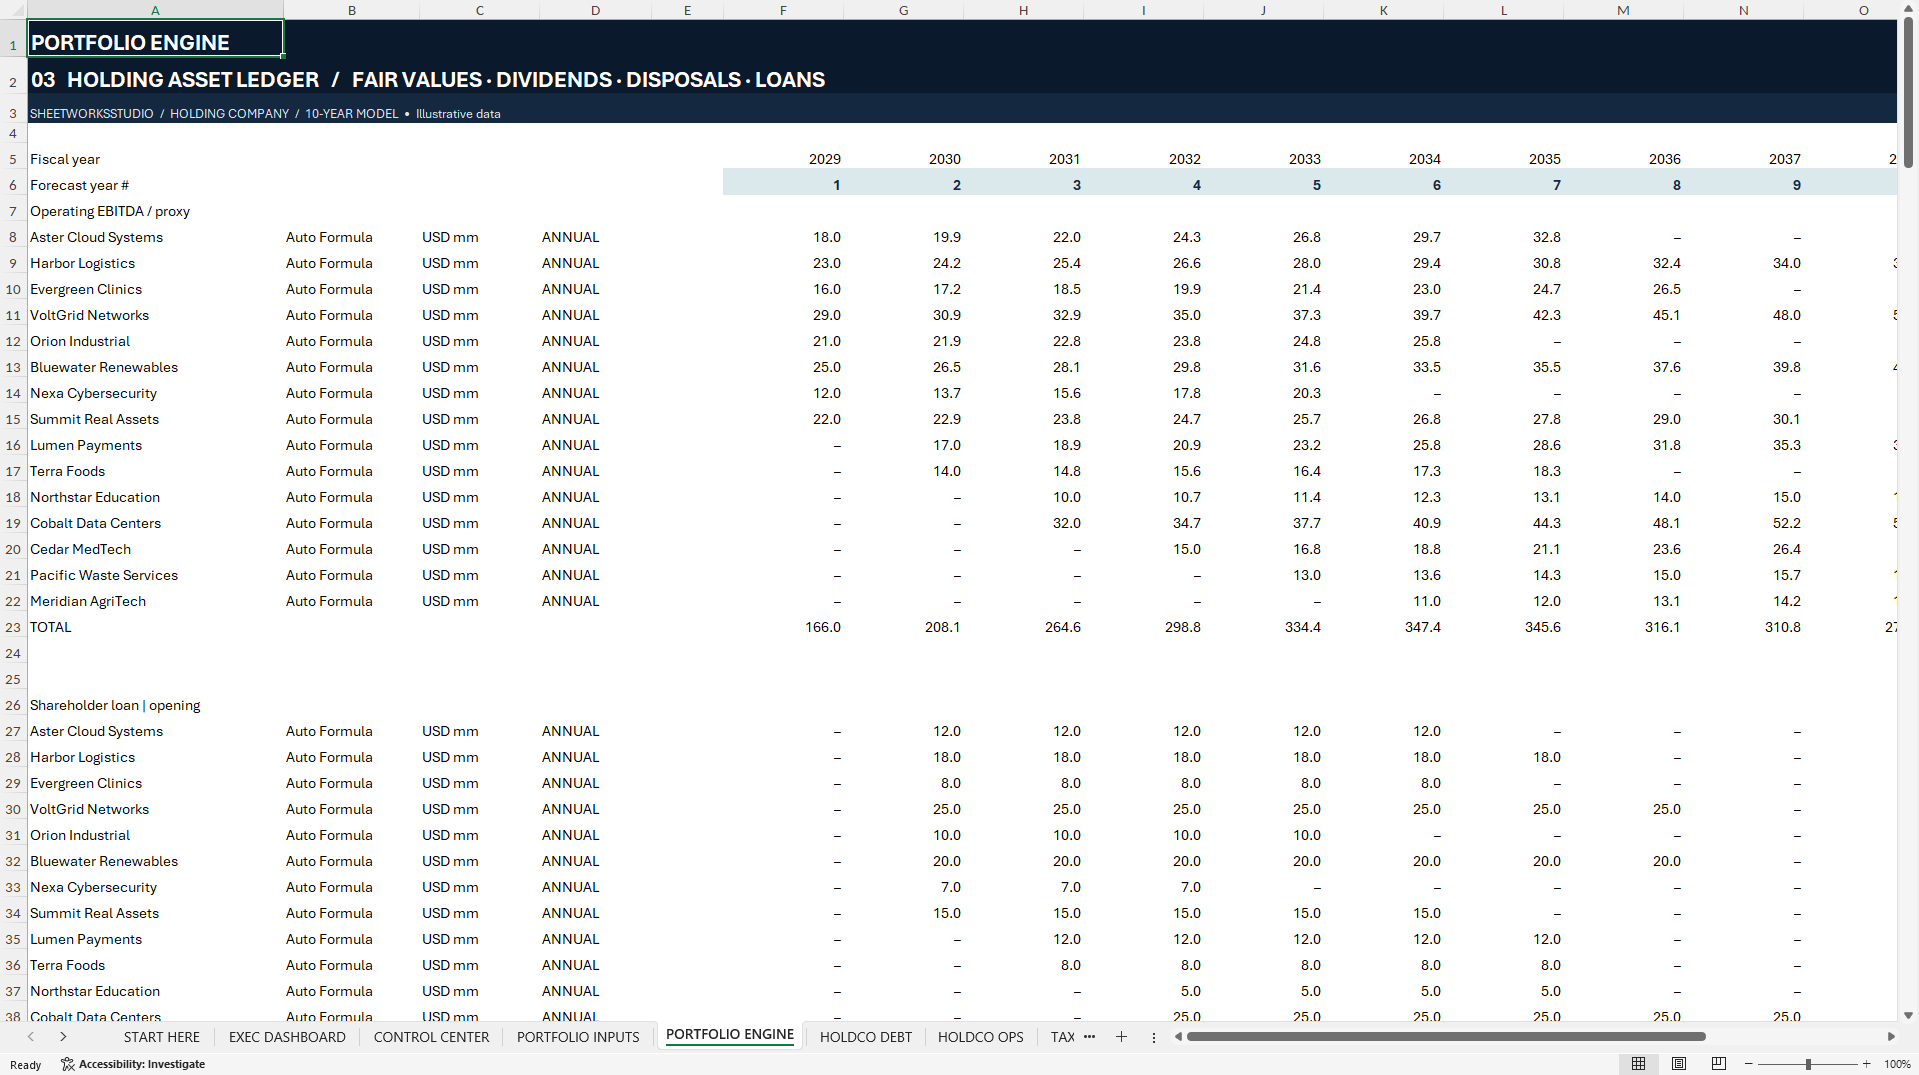
- ◈ Model 15 portfolio investments over 10 years and see how ownership, acquisitions, dividends, valuation multiples and exit timing affect holding-company NAV.
- 💰 Separate estimated portfolio value from available cash by tracing intercompany loans, two external debt facilities and shareholder distributions through three linked statements.
- 📊 Test four scenarios, review results by year across eight linked dashboard charts and distinguish liquidity warnings from financial reconciliation errors.
HOLDING COMPANY EXCEL DESCRIPTION
📊 INVESTMENT HOLDING COMPANY FINANCIAL MODEL
See how acquisitions, exits and financing decisions change what your holding company owns, what it owes and how much cash it has available.
This editable 10-year Excel model connects 15 portfolio investments to standalone holding-company financial statements, an explicit net asset value (NAV) bridge and modeled shareholder returns. It is designed for holding-company owners, family-office analysts, corporate finance teams and advisors who need to see how decisions at the investment level affect the holding company's financial position.
◈ PORTFOLIO VALUATION, ACQUISITIONS & EXITS
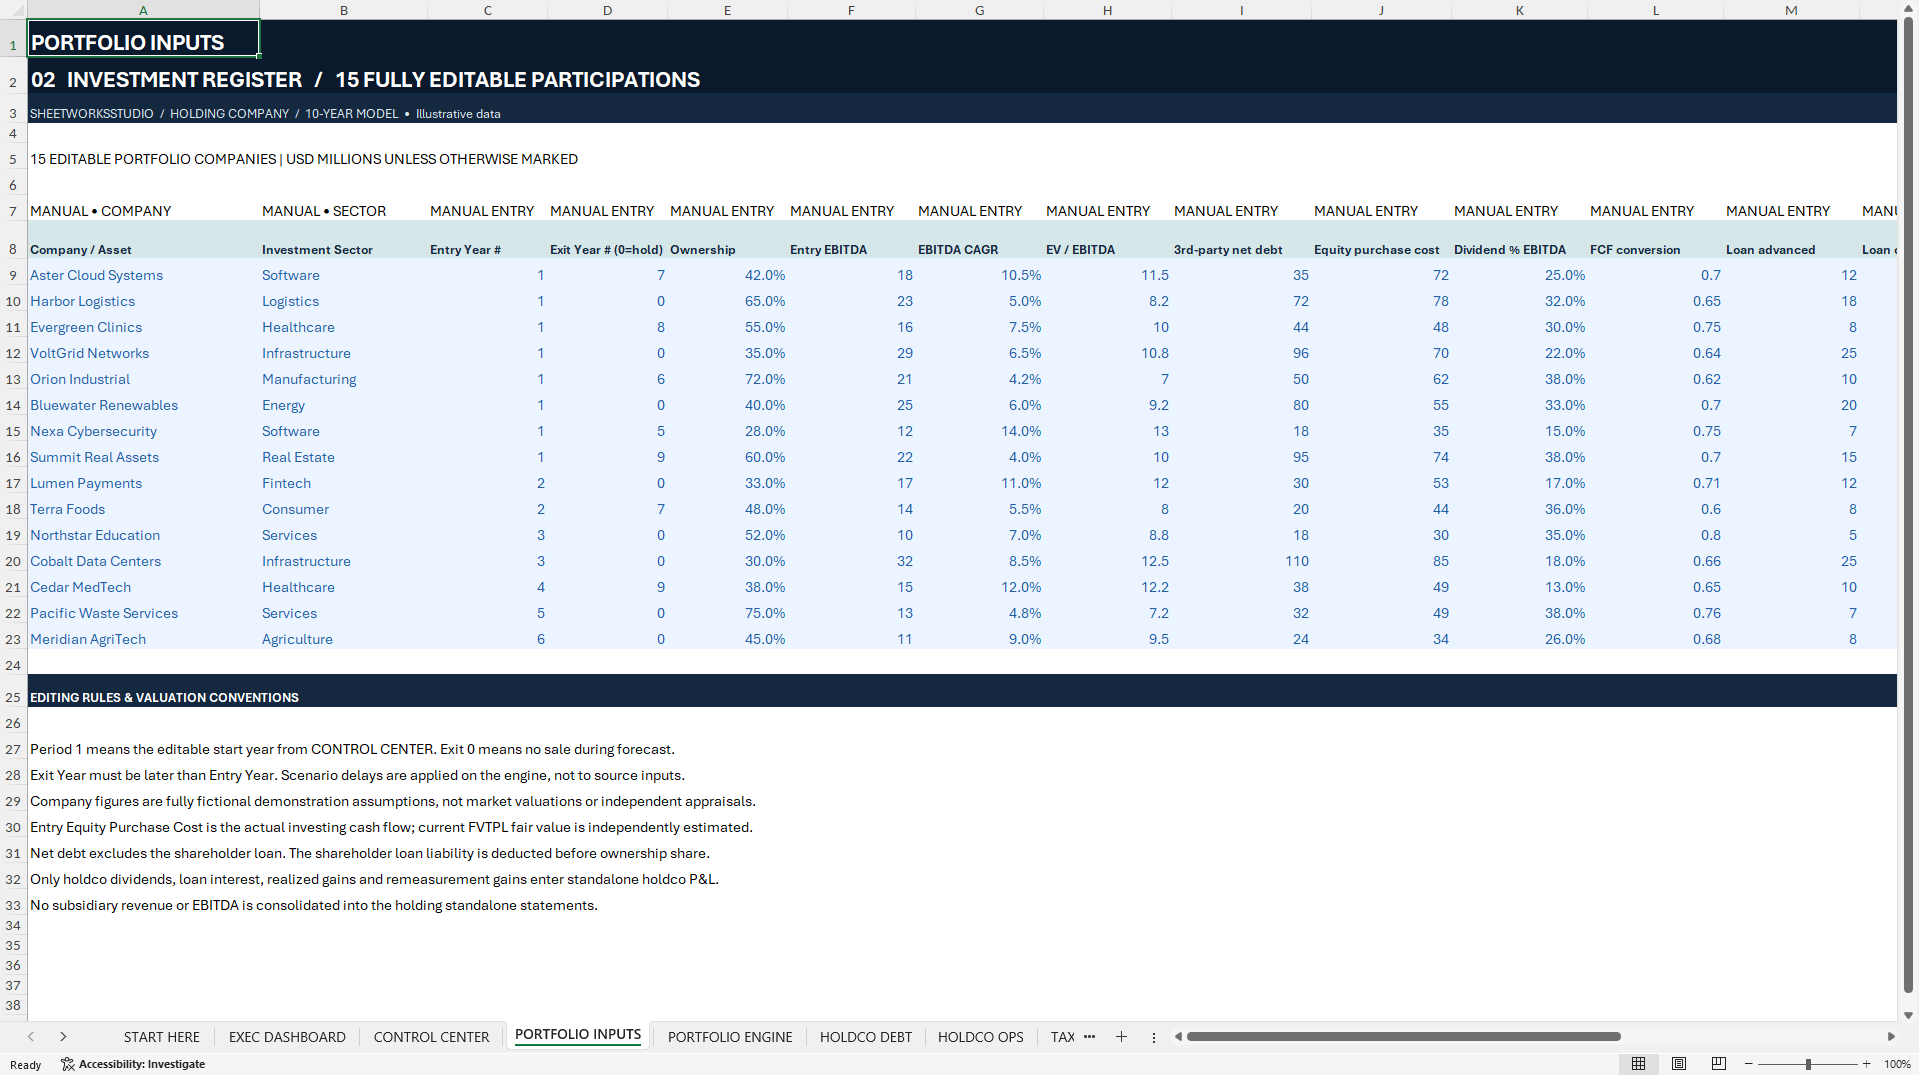
Replace the 15 fictional company records with your own investments. Set ownership percentages, acquisition costs, entry and exit years, EBITDA and growth, EV/EBITDA multiples, investee external net debt, dividend payout assumptions and disposal costs.
Follow estimated equity fair values, acquisition outlays, dividend receipts and net disposal proceeds across the forecast. Scenario-linked exit delays can push a planned sale beyond Year 10, so projected proceeds are not automatically included within the forecast horizon.
The valuation uses a simplified EBITDA-multiple approach. It is not a company-by-company discounted cash flow model or an independent appraisal.
💰 NAV, LIQUIDITY & SHAREHOLDER RETURNS
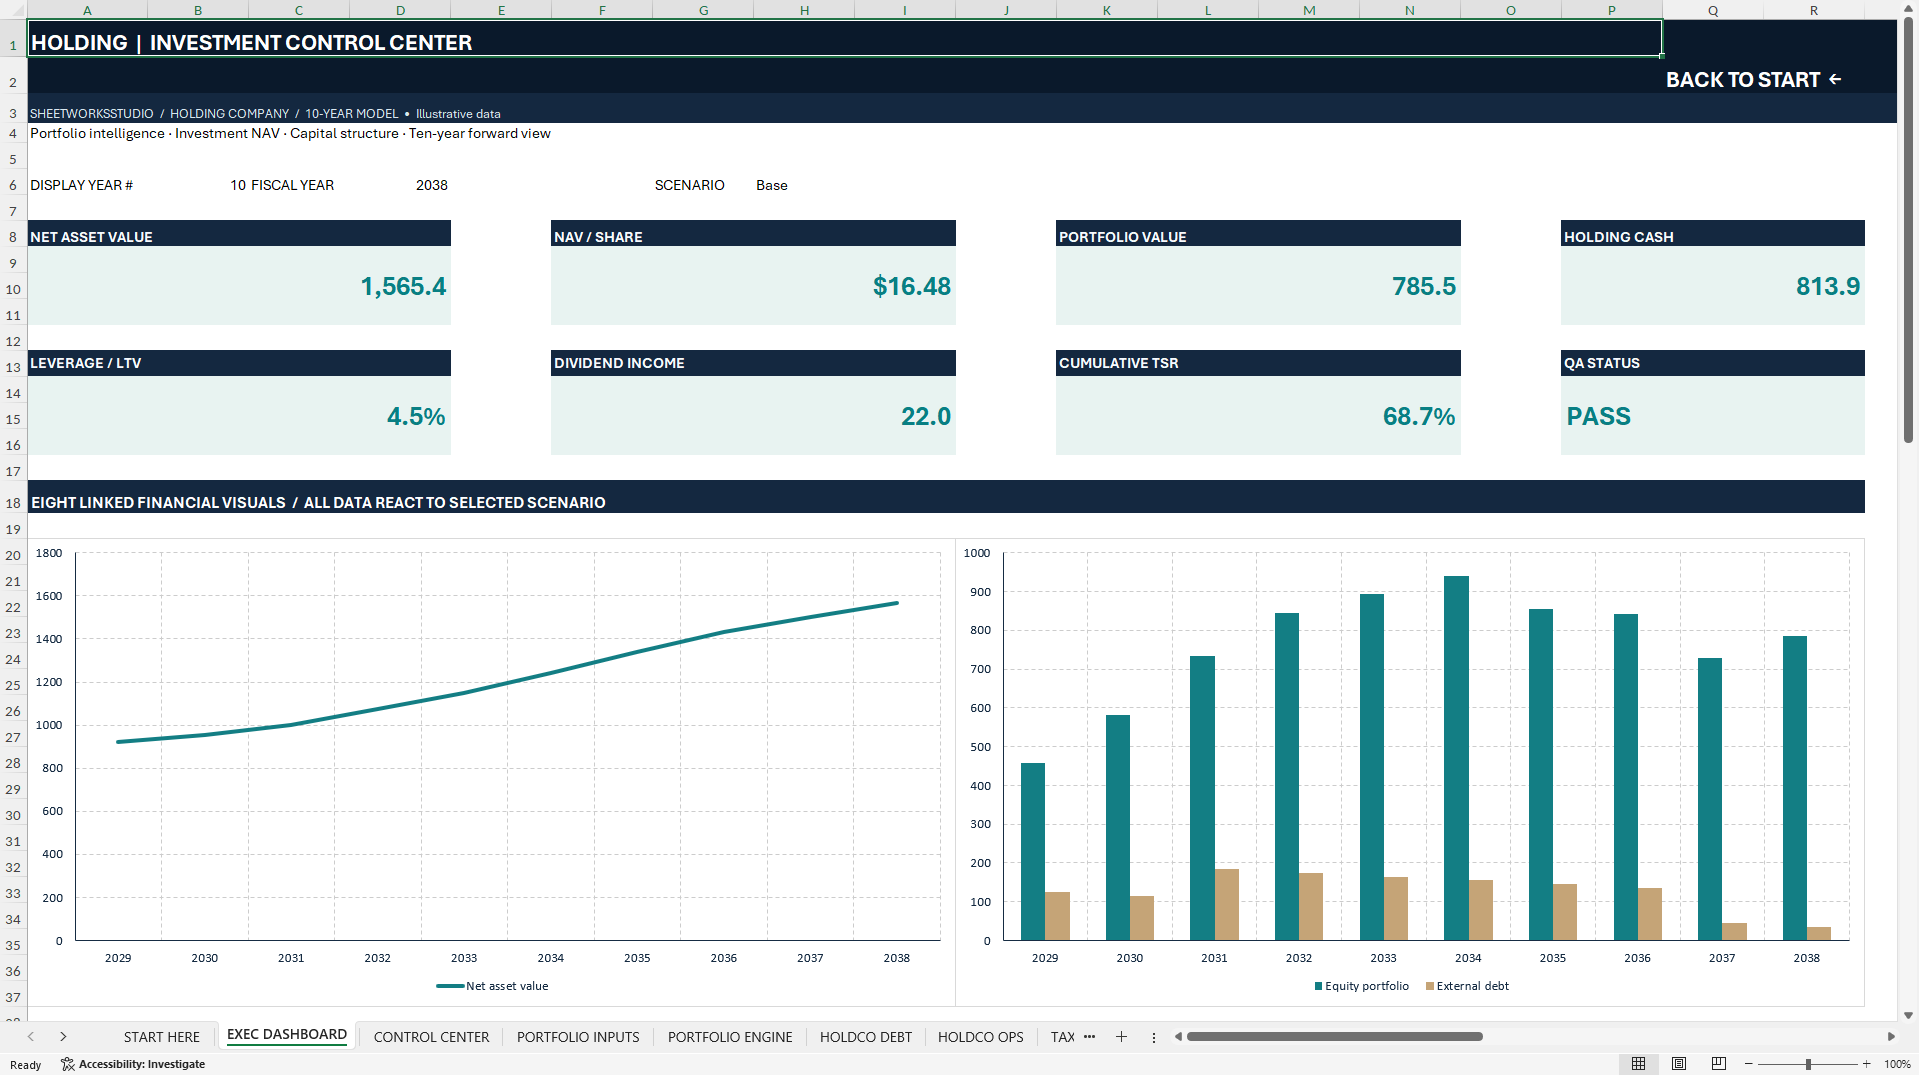
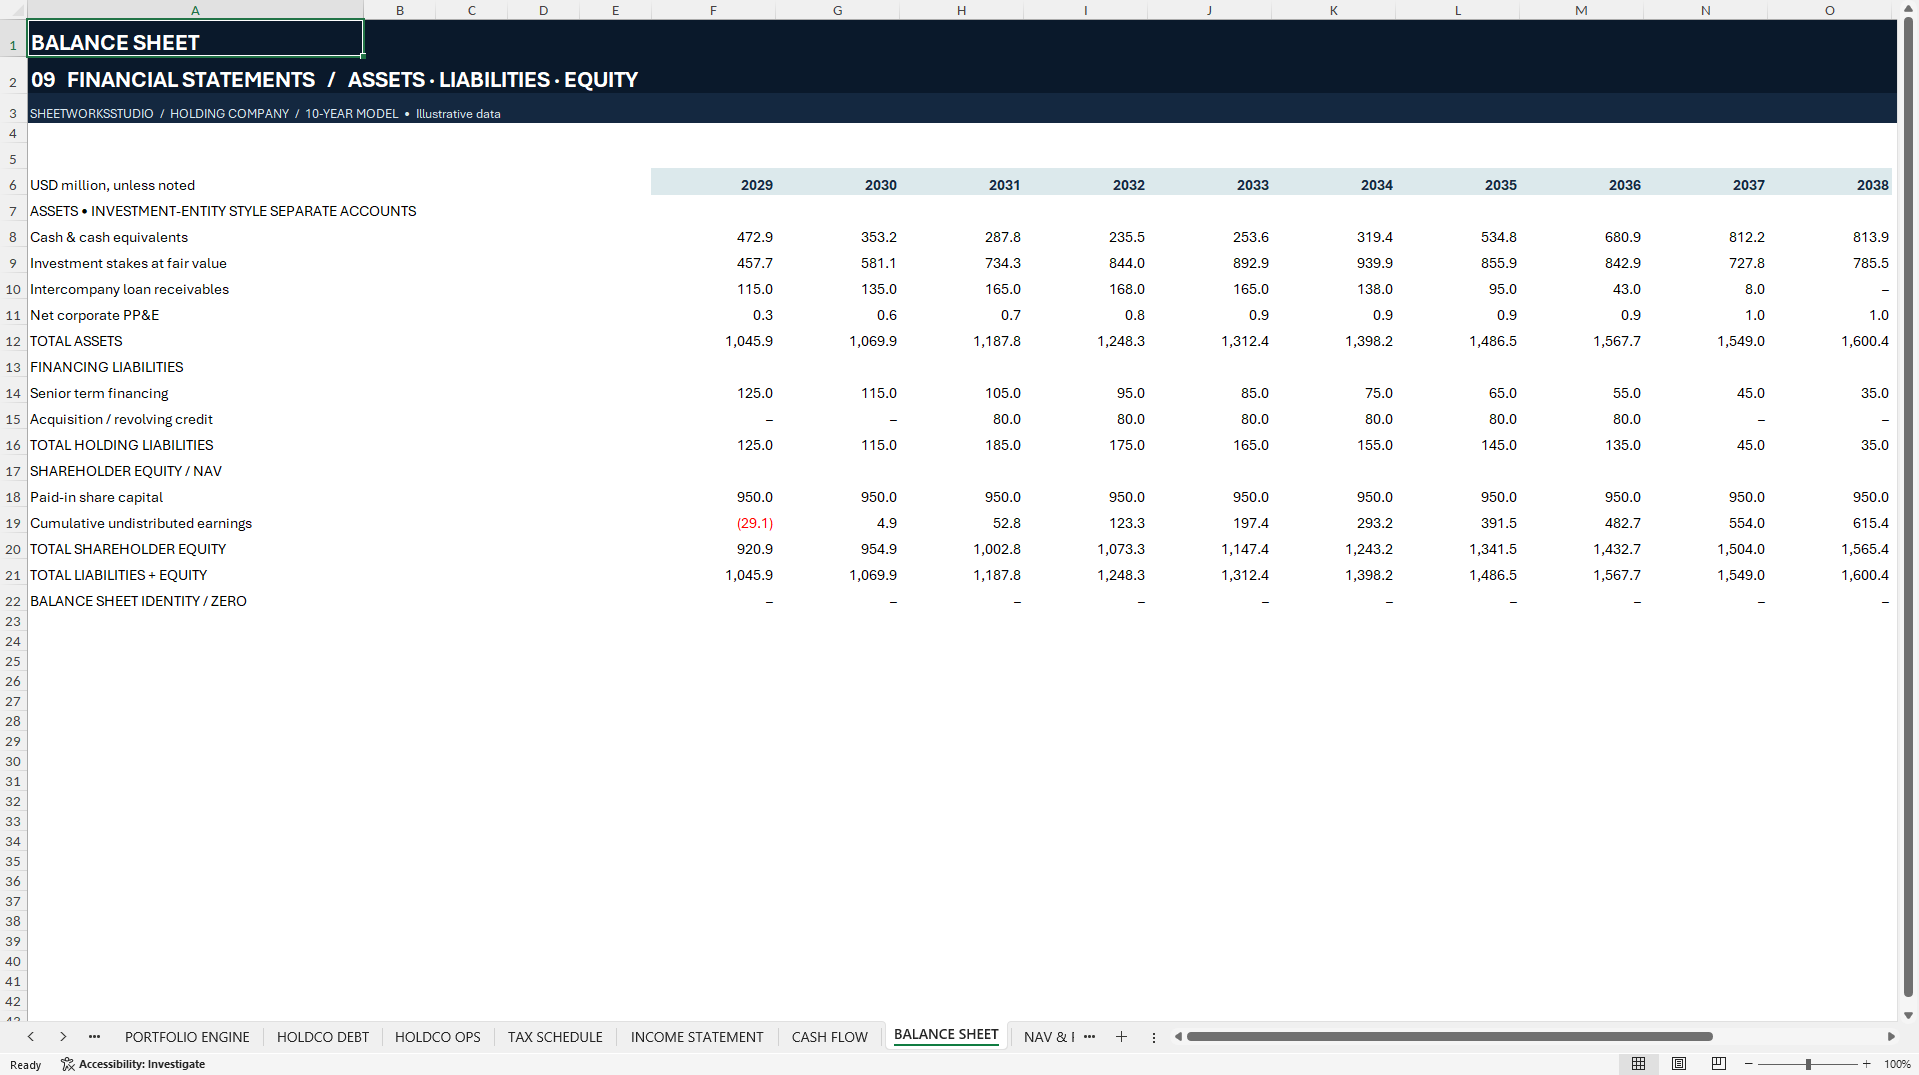
Trace NAV from portfolio equity value, intercompany loan receivables, holding cash and corporate fixed assets, less external holding debt. Review NAV per share, dividend yield, cumulative shareholder dividends, loan-to-value and modeled total shareholder return (TSR).
Holding cash is shown separately from portfolio fair value. An increase in estimated NAV is not a cash inflow. Modeled TSR is based on NAV per share and shareholder distributions, not on a traded share price.
🏦 INTERCOMPANY LENDING & EXTERNAL FINANCING
Track shareholder-loan advances, cash coupons and principal recovery separately from equity investments. At the holding level, model a term facility with scheduled annual repayments and a revolving acquisition facility with selected draw and repayment periods.
The financing schedules show interest expense, borrowing proceeds, repayments and outstanding balances. The model uses simplified annual debt conventions. It does not include a full covenant package, credit impairment engine or automatic refinancing of cash deficits.
📑 THREE LINKED HOLDING-COMPANY FINANCIAL STATEMENTS
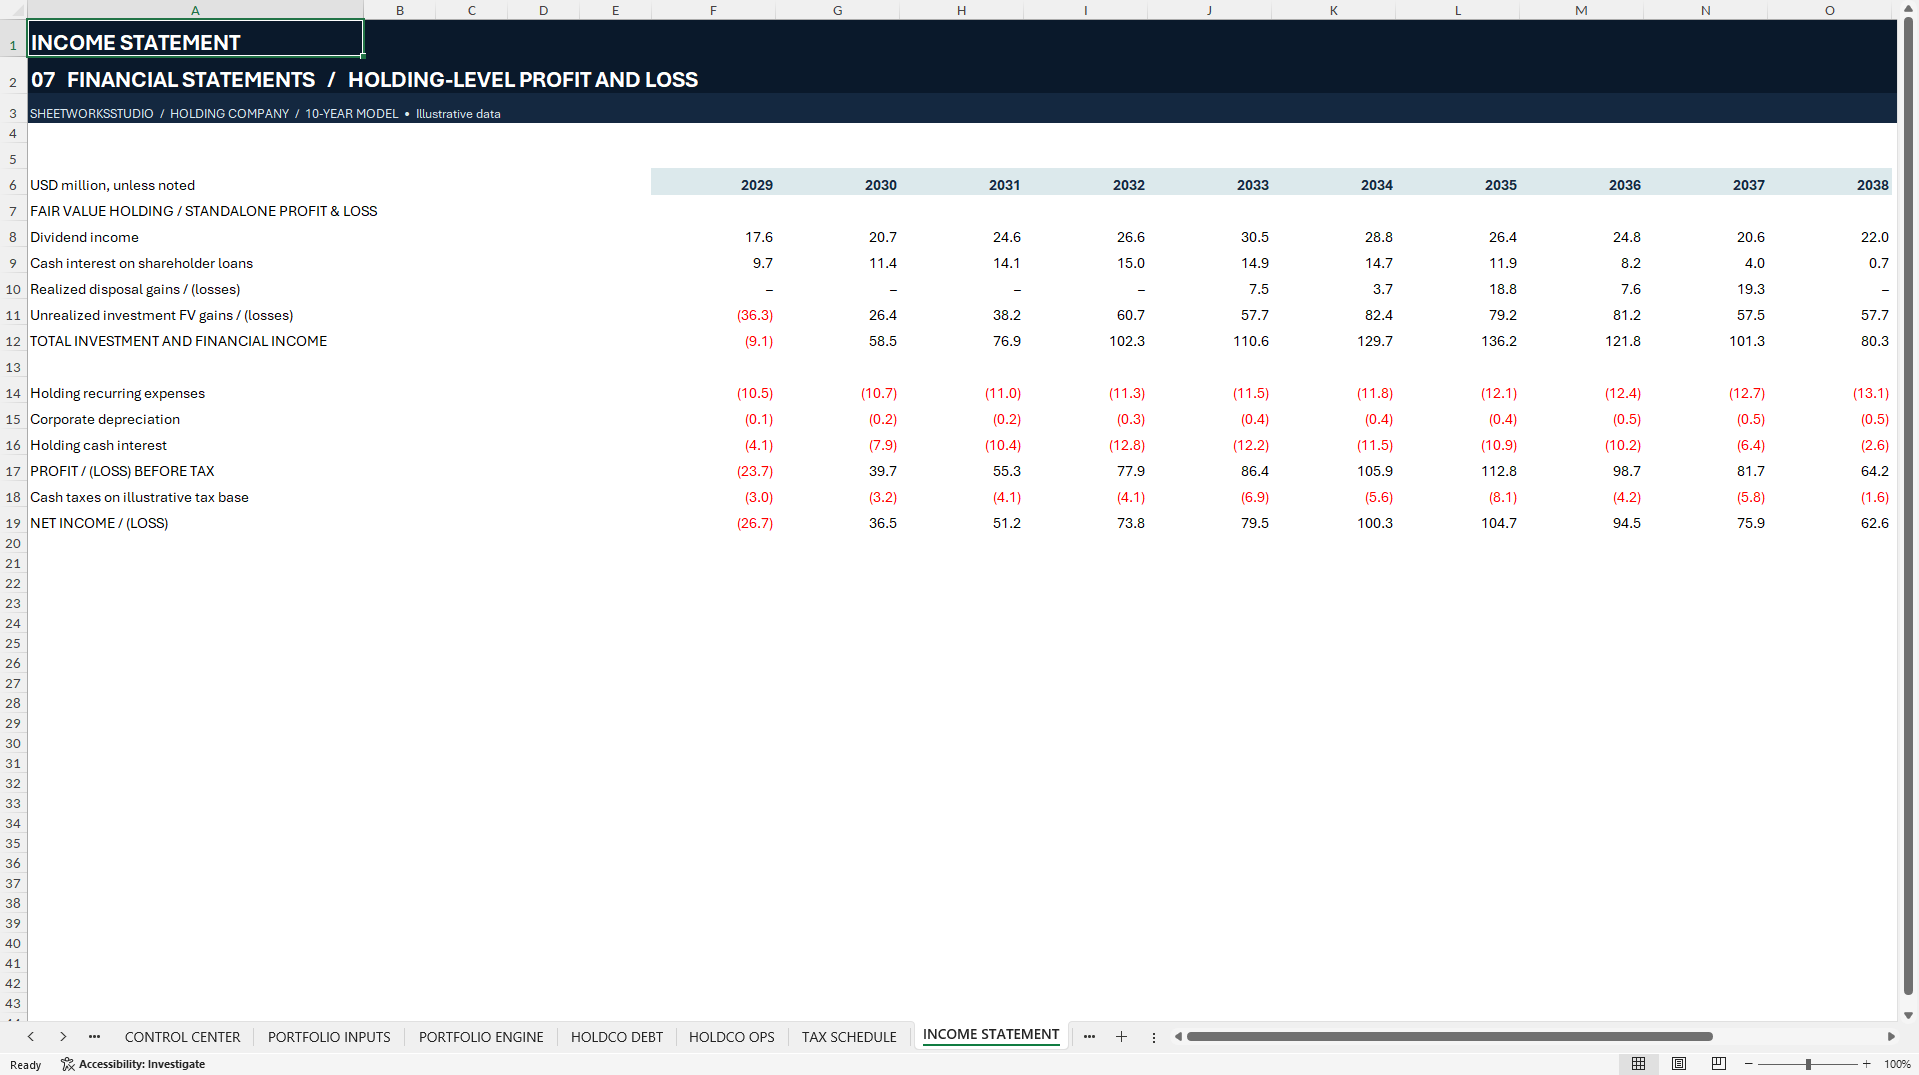
Review a linked Income Statement, indirect Cash Flow Statement and Balance Sheet. Follow investment dividends, shareholder-loan interest, realized disposal gains and losses, unrealized fair-value movements, overhead, depreciation, financing costs and simplified taxes.
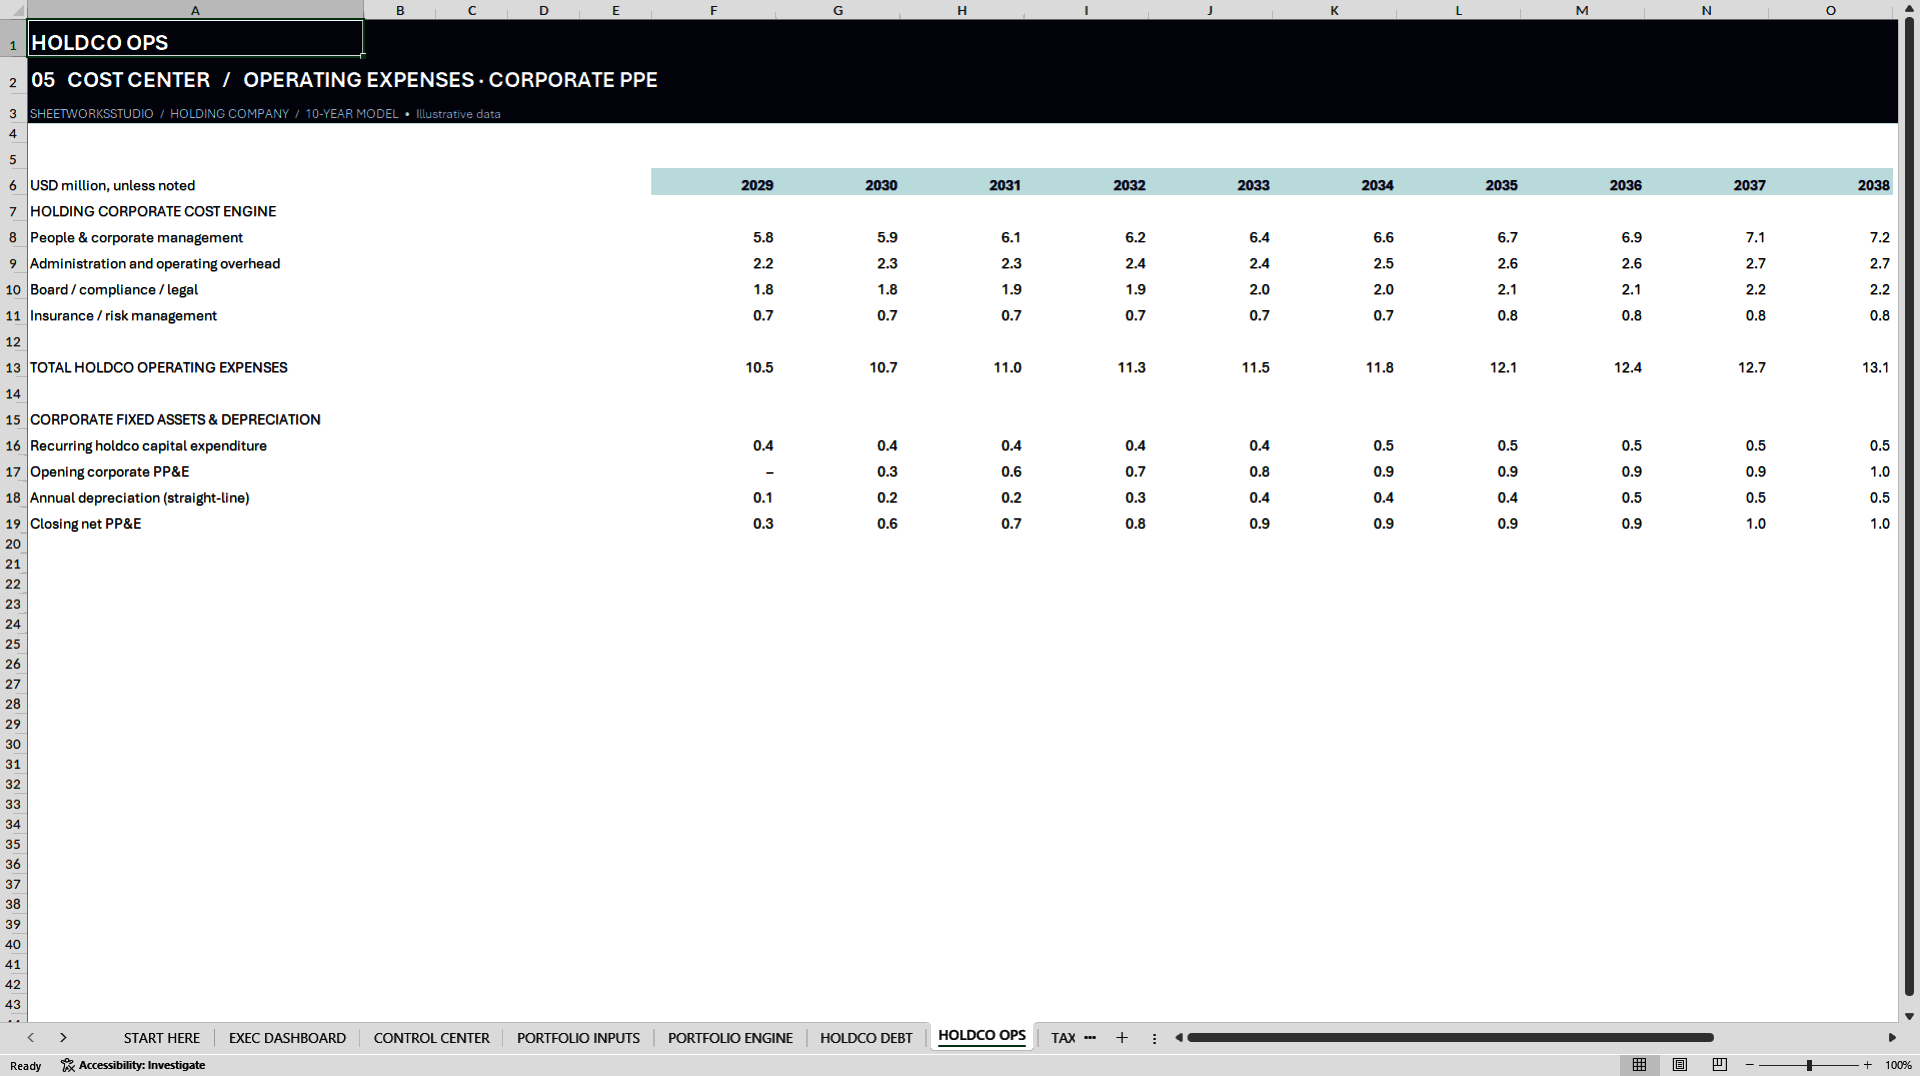
The cash flow statement distinguishes cash movements from accounting gains. Supporting schedules cover holding expenses, corporate CAPEX, depreciation and a simplified tax loss carryforward. The workbook models the standalone holding company. It does not consolidate portfolio companies line by line.
🔀 FOUR EDITABLE SCENARIOS
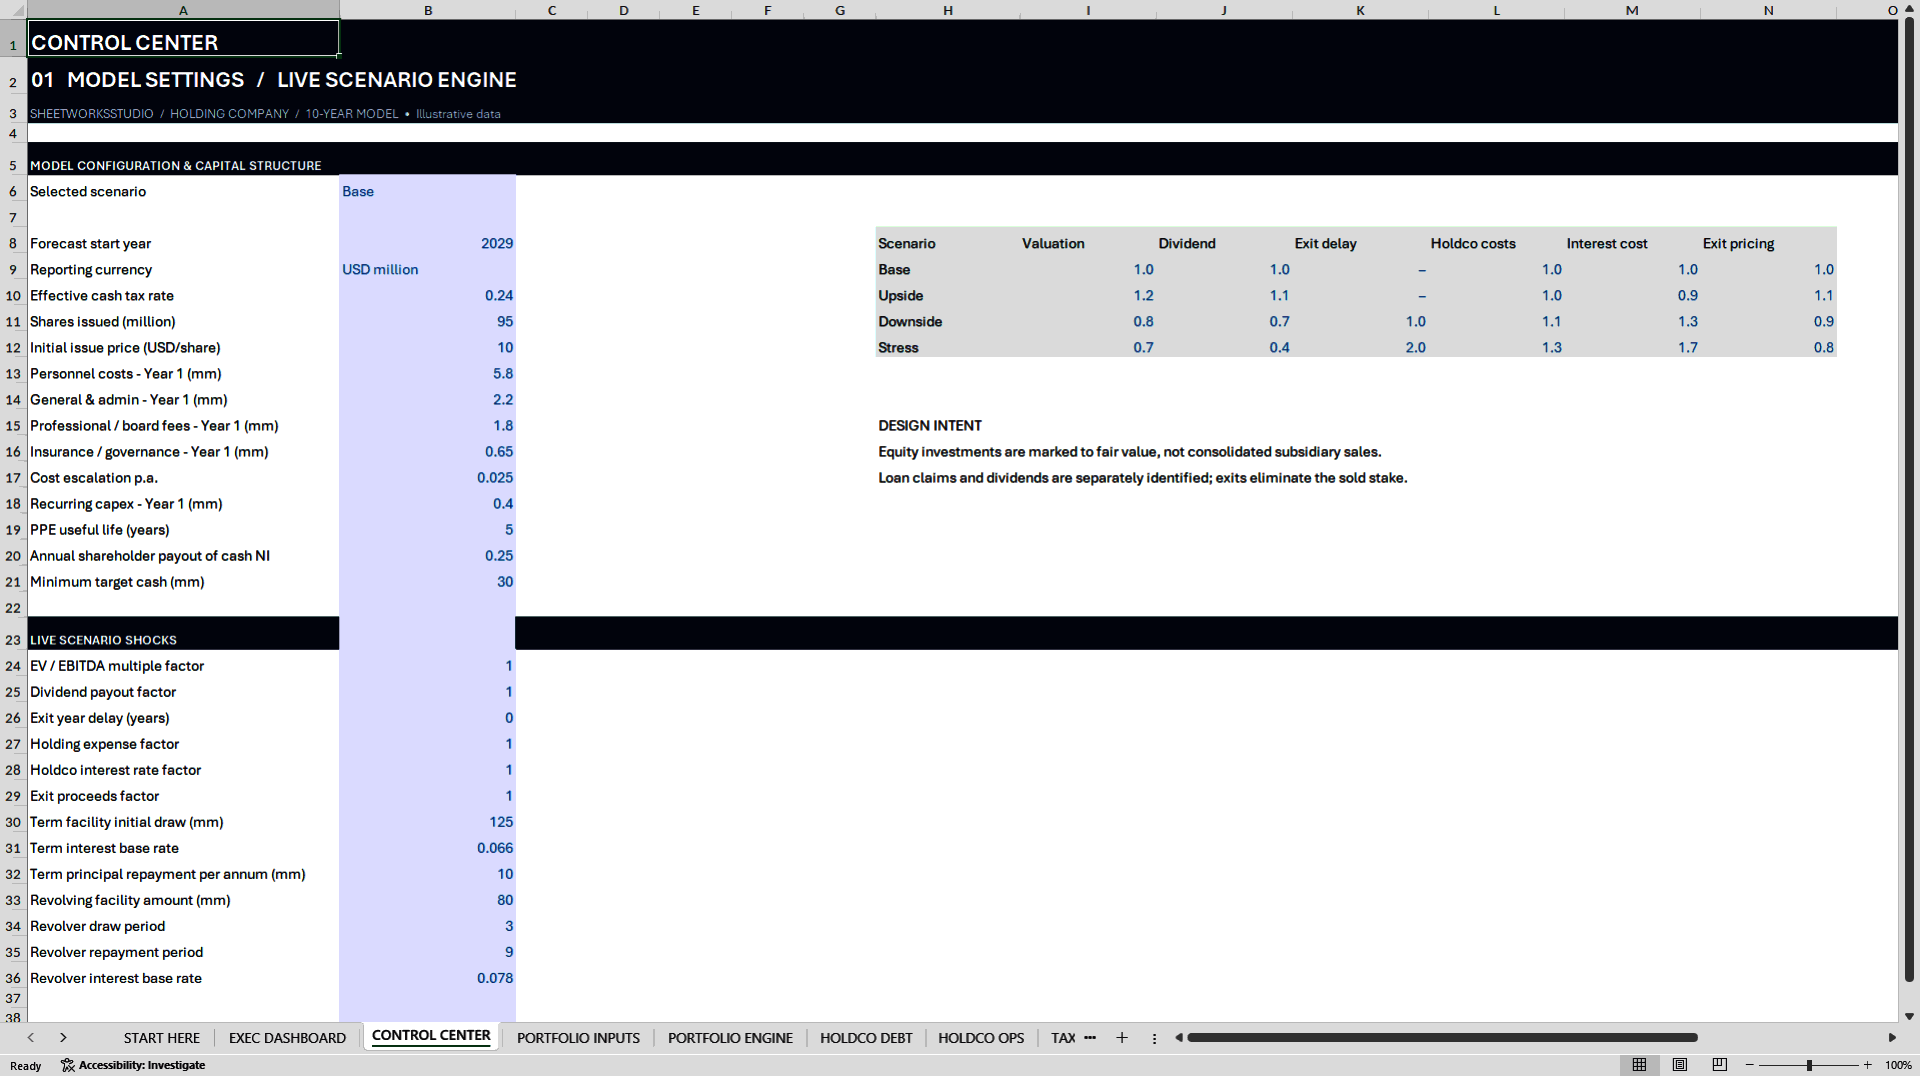
Switch between Base, Upside, Downside and Stress. Adjust valuation multiples, portfolio dividend payouts, disposal timing, holding expenses, borrowing costs and disposal pricing. The selected case flows through the portfolio schedules, financial statements, NAV and dashboard.
One scenario is active at a time. The workbook does not calculate four parallel forecasts or a probability-weighted outcome.
📈 EXECUTIVE DASHBOARD & MODEL CHECKS
Eight linked Excel charts cover NAV, portfolio equity versus external debt, cash and intercompany loans, dividends versus holding costs, portfolio income, shareholder returns, sector allocation and investment-level contribution.
Use the display-year selector to inspect eight headline indicators for any of the ten years. The MODEL CHECKS worksheet tests balance sheet equality, cash flow reconciliation, debt and portfolio movements, intercompany loans and the NAV-to-equity tie-out. Liquidity and leverage warnings are reported separately from financial identity failures. A PASS does not establish solvency or validate investment assumptions.
📦 WHAT YOU RECEIVE
• One editable, macro-free Excel workbook with 16 worksheets, 10 annual forecast periods, 15 illustrative investment positions, 4 scenarios and 8 native dashboard charts.
• One 29-page English PDF guide covering setup, portfolio inputs, financing, scenarios, valuation, shareholder returns, model checks and troubleshooting.
🧭 GETTING STARTED
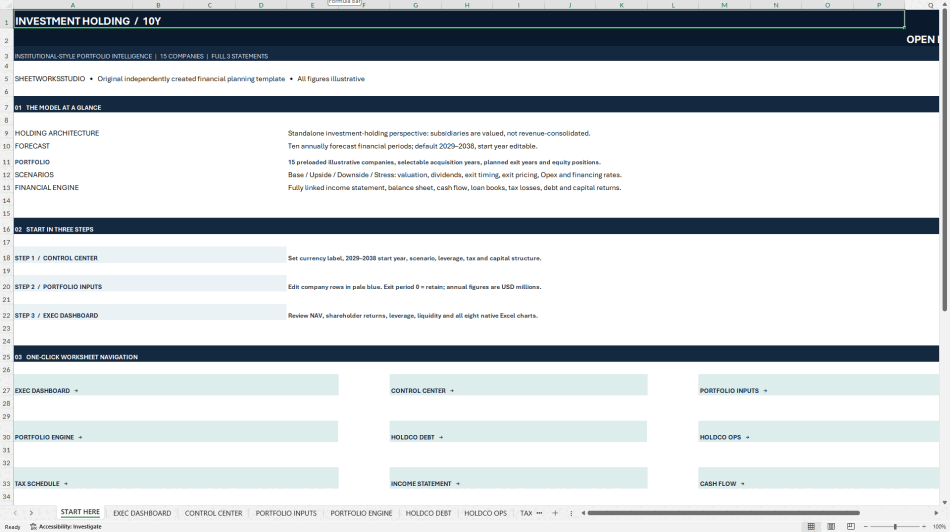
Save a working copy and begin in START HERE. Set the scenario and global assumptions in CONTROL CENTER, then replace the sample data in PORTFOLIO INPUTS. The default forecast runs from 2029 to 2038 and the start year is editable. After changing inputs, review holding cash flow, NAV & RETURNS and MODEL CHECKS together.
⚙️ COMPATIBILITY & MODEL SCOPE
Microsoft Excel Desktop is the intended application. No VBA, add-ins or live external data connections are required. Google Sheets import and chart fidelity have not been independently verified. The reporting currency field is a label, not an FX conversion tool. Most monetary values are entered in millions, while NAV per share is a per-share value.
🛡️ INDEPENDENT TEMPLATE
Developed by SheetworksStudio as an independent, unofficial financial planning template. All sample companies, assumptions and outputs are fictional. This is not an audited valuation, a lender-approved model or a substitute for consolidated statutory accounts. It does not provide legal, accounting, tax or investment advice or guarantee financial outcomes.
Got a question about the product? Email us at support@flevy.com or ask the author directly by using the "Ask the Author a Question" form. If you cannot view the preview above this document description, go here to view the large preview instead.
Source: Best Practices in Holding Company, Integrated Financial Model Excel: Investment Holding Company Financial Model Excel (XLSX) Spreadsheet, SheetworksStudio
ABOUT THE AUTHOR

SheetworksStudio creates premium Excel-based business templates, dashboards, trackers, financial models, and management systems for professionals, consultants, entrepreneurs, and organizations.
Our portfolio covers finance, project management, operations, risk management, compliance, AI governance, HR, supply chain, performance management, and business planning. Each product is designed to
... [read more]
Ask the Author a Question
You must be logged in to contact the author.