
 Click main image to view in full screen. Unlock all 13 preview images:
Hair & Beauty Salon Financial Model – Excel XLSX
Excel (XLSX) + supplemental PDF


BENEFITS OF THIS DOWNLOADABLE EXCEL DOCUMENT
- Converts salon-specific service, pricing, utilization, seasonality, staffing, cost, capex, and funding assumptions into an integrated 10-year financial forecast.
- Tests Base, Bull, and Bear cases and quantifies their effect on profitability, cash, leverage, break-even timing, and DCF valuation.
- Provides decision-ready dashboards, 22 KPIs, financial statements, debt schedules, sensitivity analysis, charts, and built-in audit checks in one editable workbook.
SALON & SPA EXCEL DESCRIPTION
💇 Build a salon forecast around the drivers that actually matter
Opening, acquiring, renovating, or expanding a hair and beauty salon requires more than a simple sales estimate. Revenue depends on service mix, customer visits, ticket size, capacity, utilization, seasonality, staff availability, commissions, consumable costs, retail sales, memberships, and the timing of growth. This premium Hair & Beauty Salon Financial Model brings those moving parts together in one fully editable and formula-driven workbook.
Designed for both startup and operating salons, the model converts practical operating assumptions into a connected 10-year financial forecast. It helps users understand how decisions about pricing, utilization, staffing, service mix, operating costs, capital investment, and debt financing can affect profitability, cash flow, financial position, and business value.
✨ Nine salon-specific revenue streams
Revenue is modeled separately for:
Hair Cuts
Color & Highlights
Treatments
Nail Services
Skincare/Facials
Waxing
Bridal Packages
Product Retail Sales
Membership/Subscription Revenue
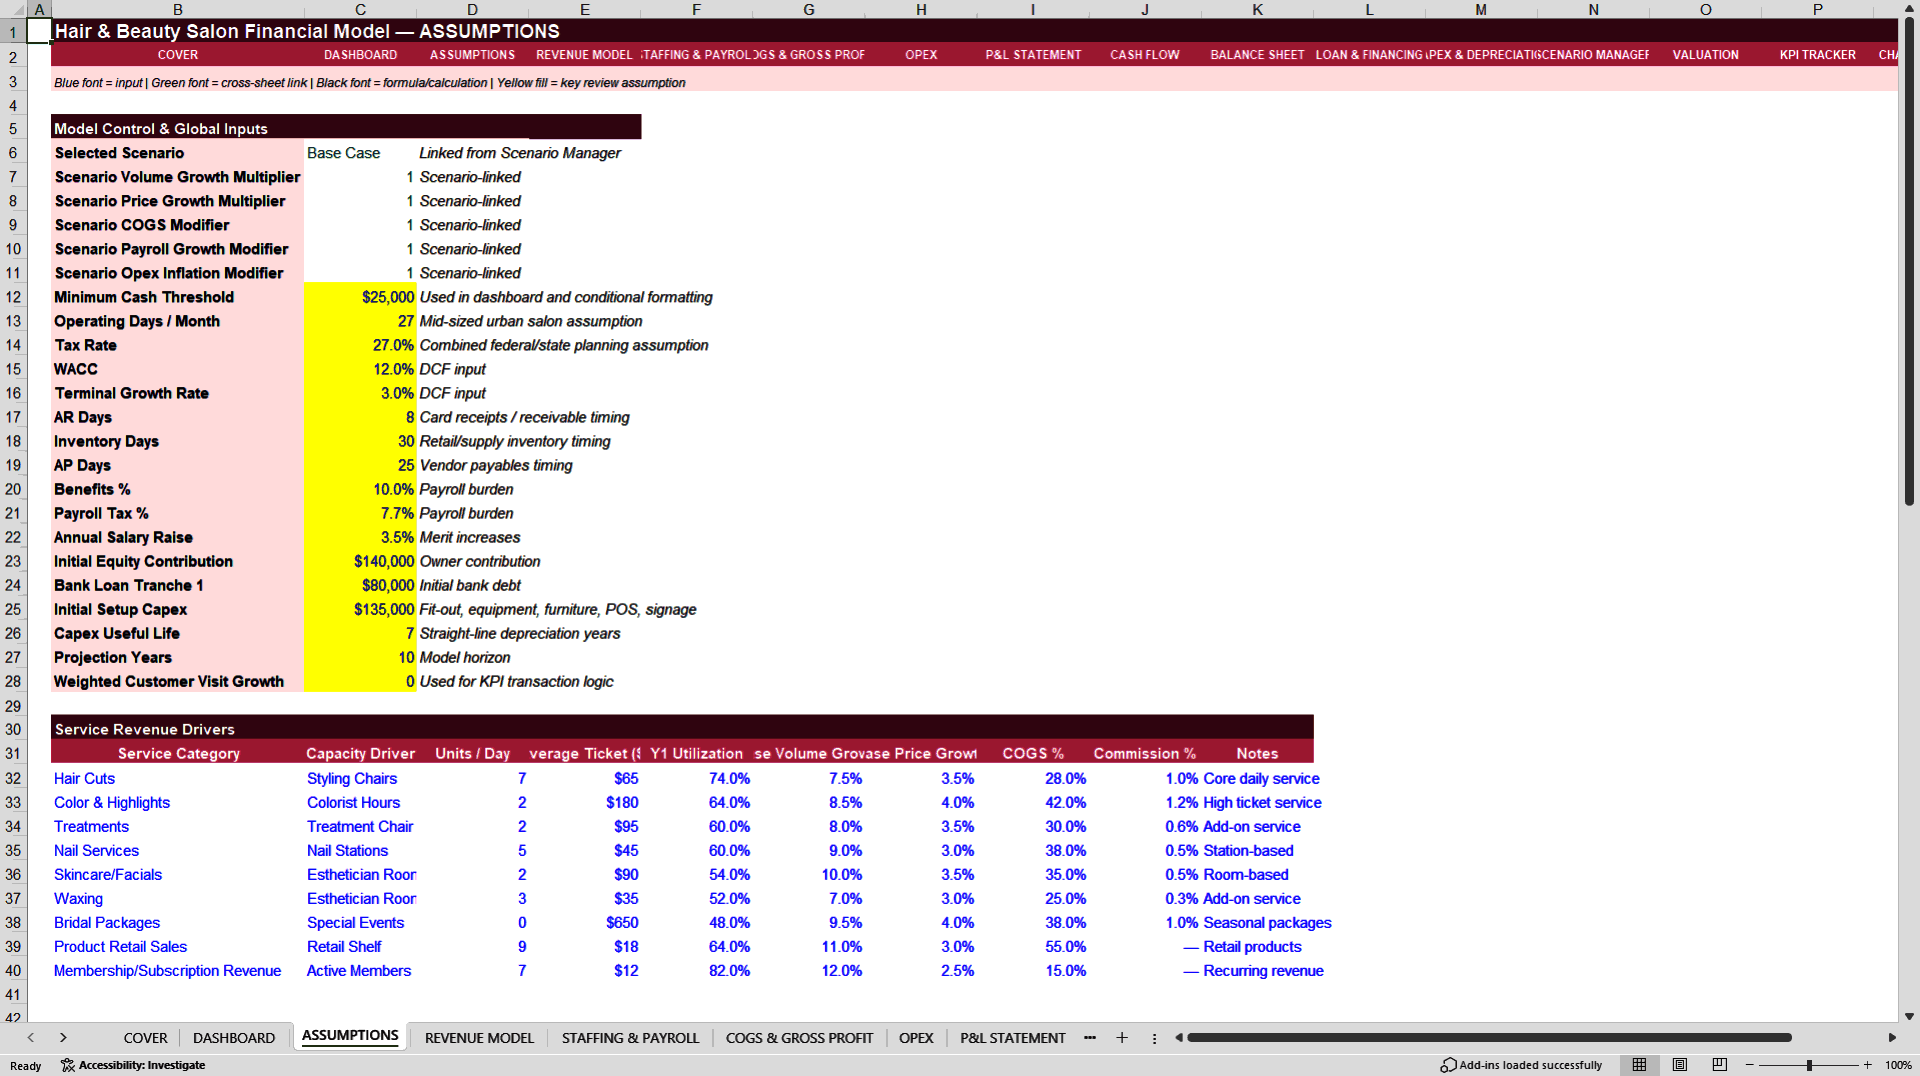
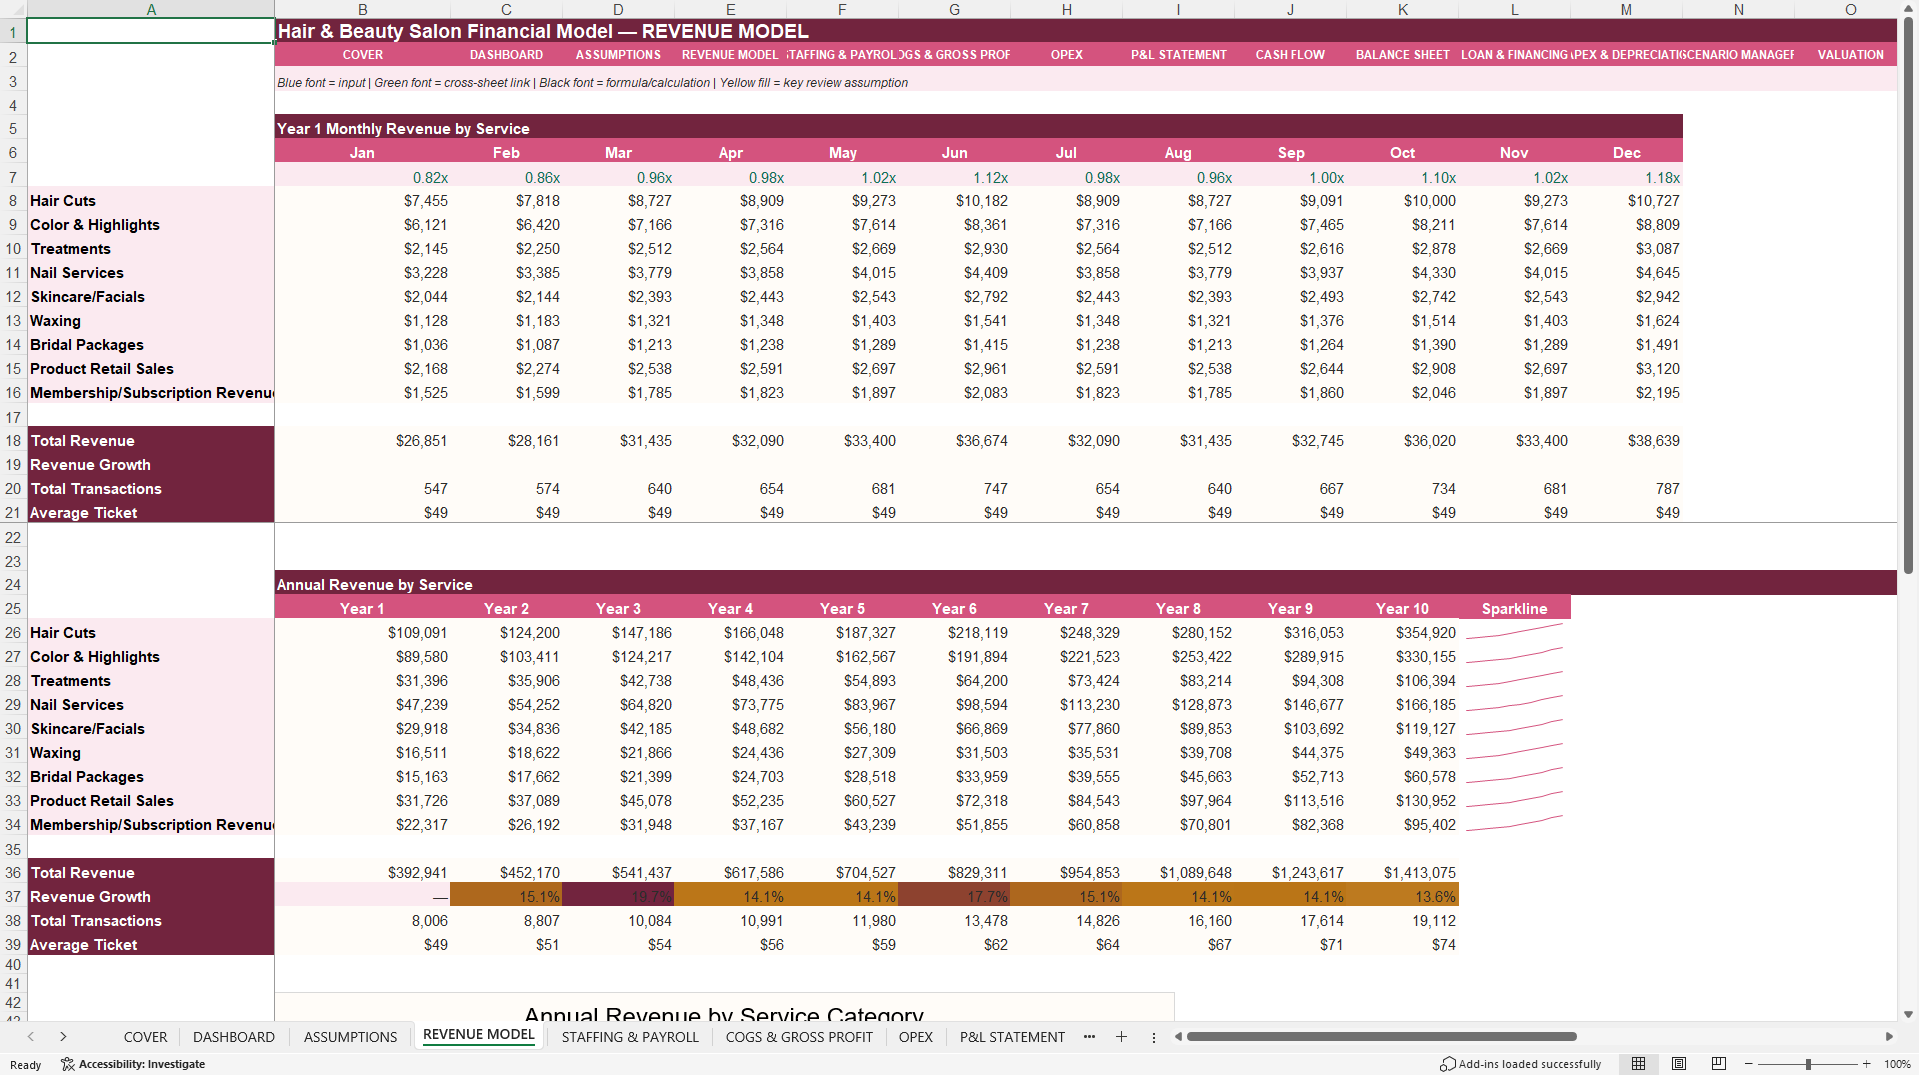
Each stream is driven by editable assumptions for units per day, average ticket, Year 1 utilization, volume growth, price growth, COGS percentage, and commission percentage. The revenue schedule provides detailed monthly calculations for Year 1 using customizable seasonality factors, followed by annual projections through Year 10. Capacity expansion uplifts can be applied by year to reflect additional chairs, treatment capacity, staff, or operational improvements.
👥 Staffing and payroll planning
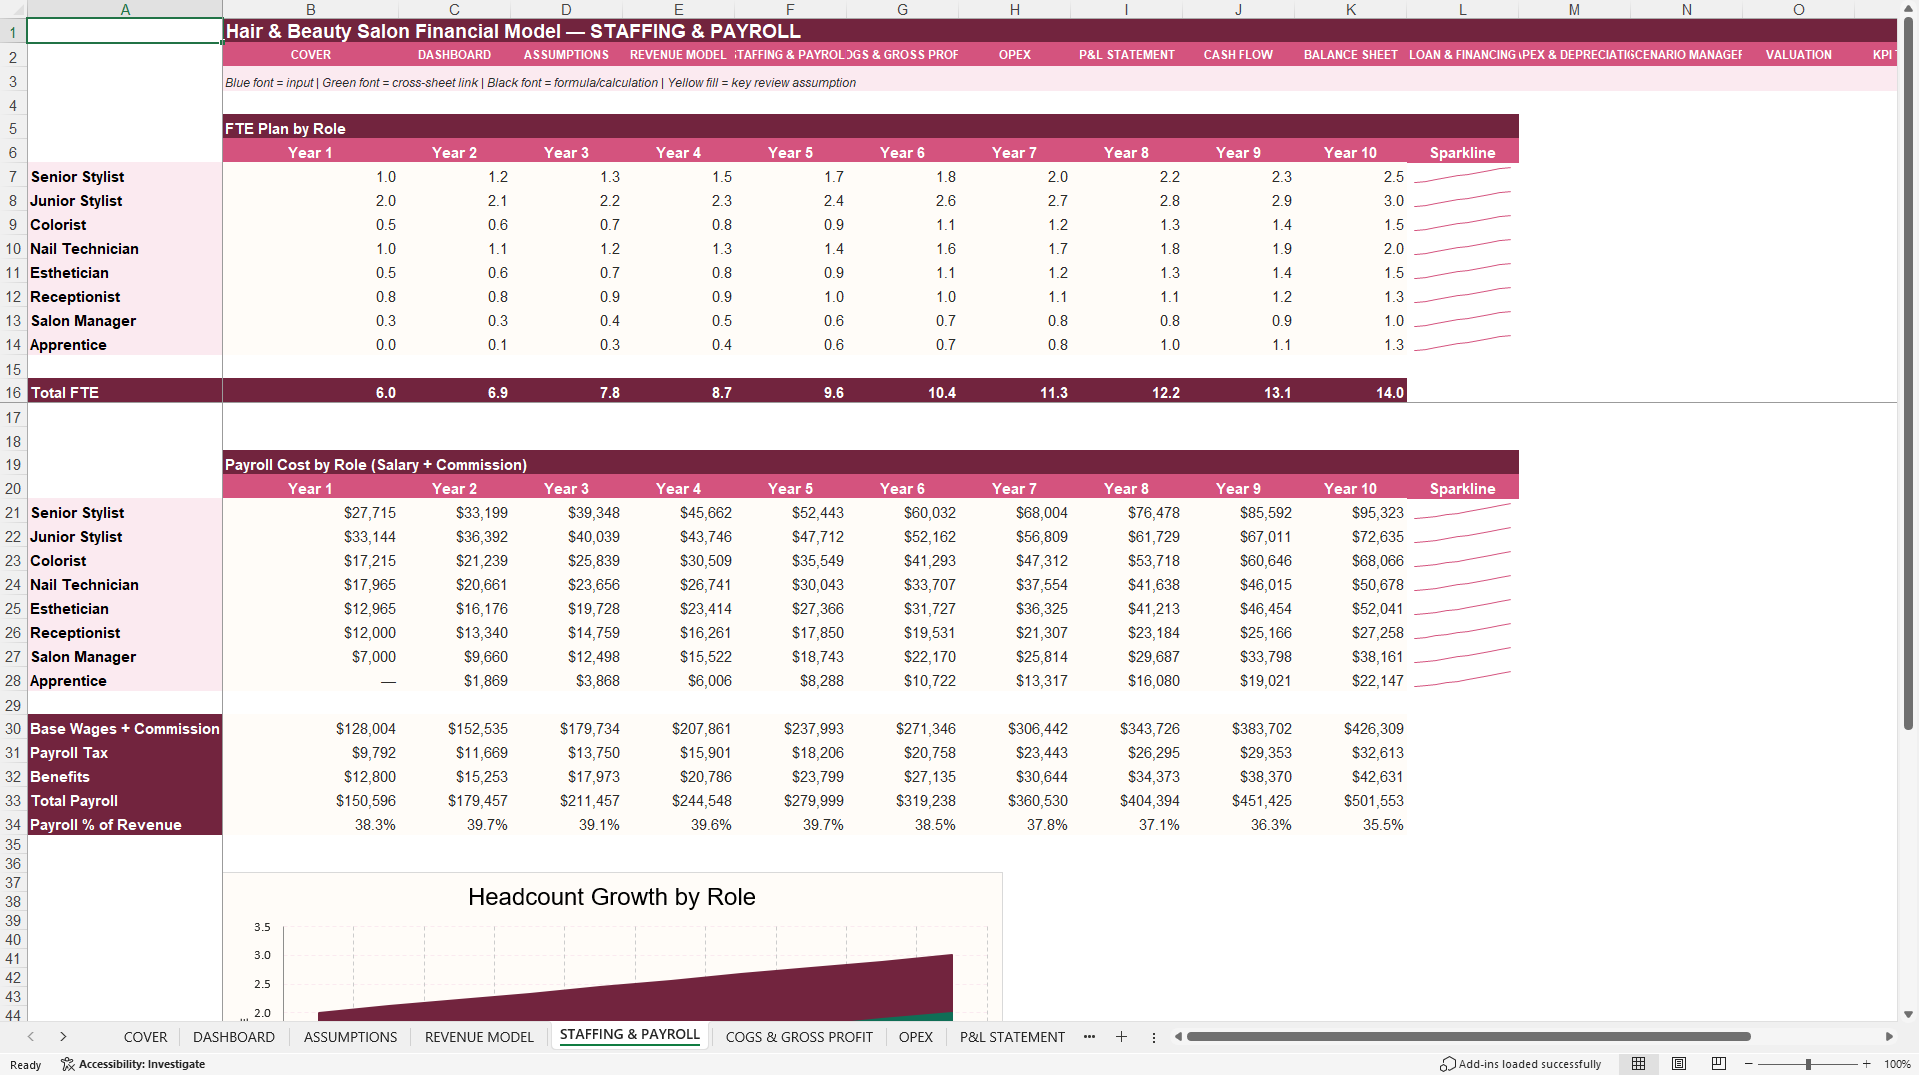
The model includes an integrated workforce plan for senior stylists, junior stylists, colorists, nail technicians, estheticians, receptionists, salon managers, and apprentices. Users can edit launch FTEs, Year 10 FTE targets, salary per FTE, commission rates, benefits eligibility, payroll tax, benefits, and annual salary increases.
The staffing schedule calculates headcount development, base wages and commissions, payroll taxes, benefits, total payroll, and payroll as a percentage of revenue across the full forecast. This allows buyers to assess when additional hiring is affordable and whether planned capacity is supported by projected demand.
📊 Integrated financial statements and operating schedules
The workbook includes:
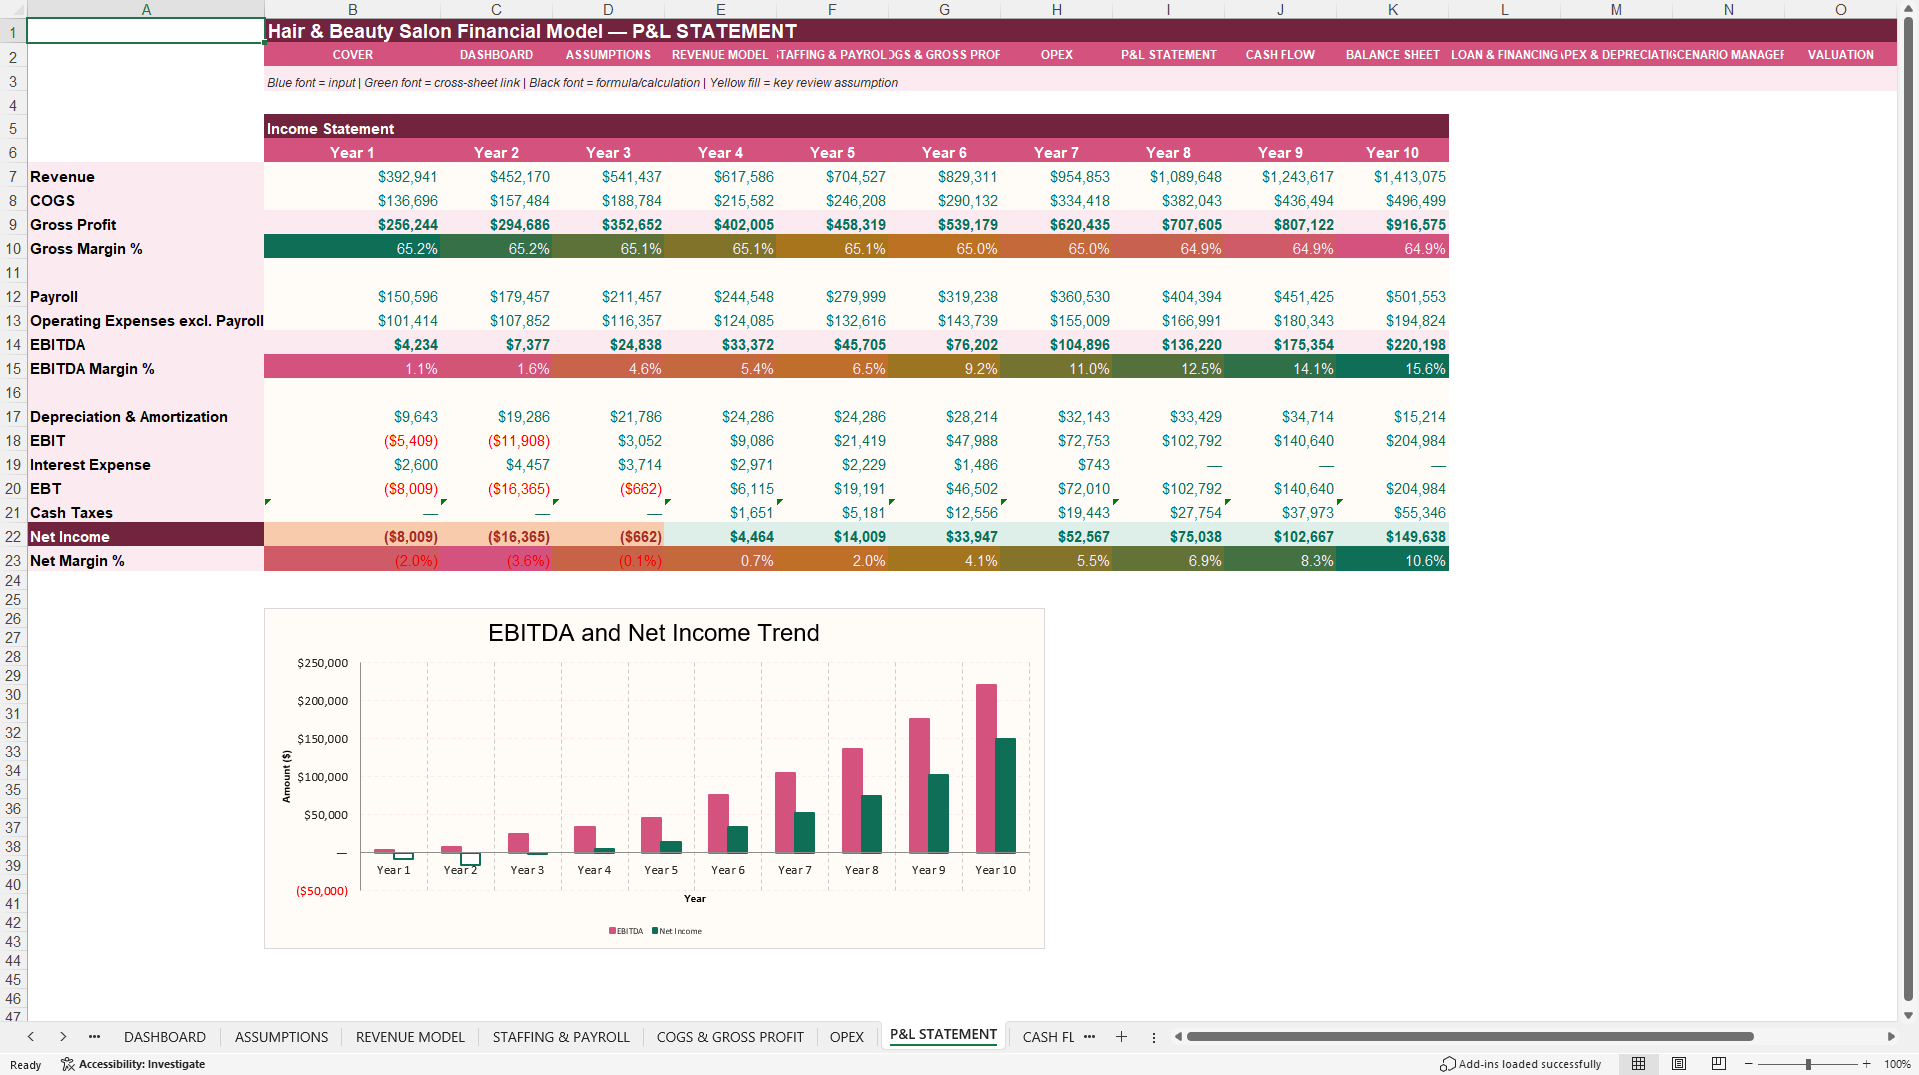
10-year Income Statement with revenue, COGS, gross profit, payroll, operating expenses, EBITDA, depreciation, EBIT, interest, taxes, net income, and margins
10-year Cash Flow Statement covering operating cash flow, capital expenditure, loan drawdowns, equity contributions, principal repayments, net cash flow, and ending cash
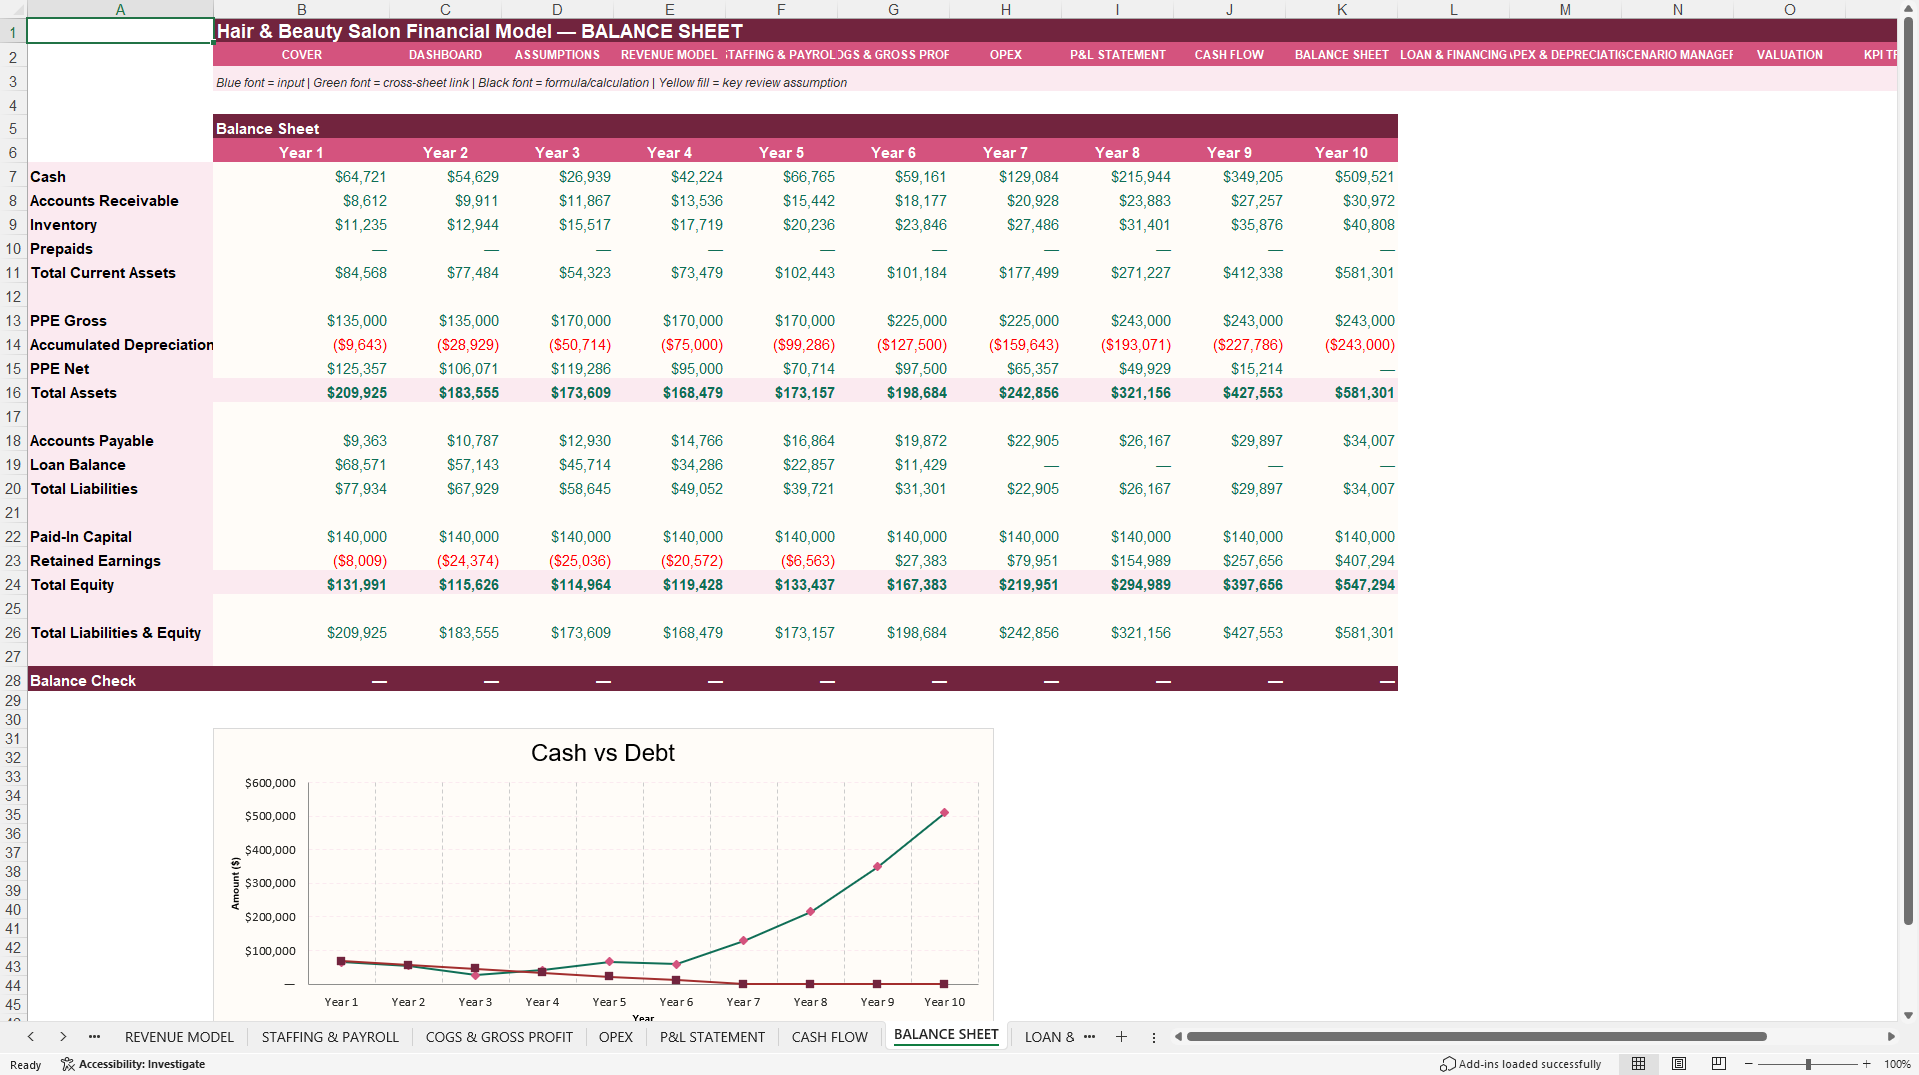
10-year Balance Sheet with cash, receivables, inventory, prepayments, PP&E, payables, debt, paid-in capital, retained earnings, and an annual balance check
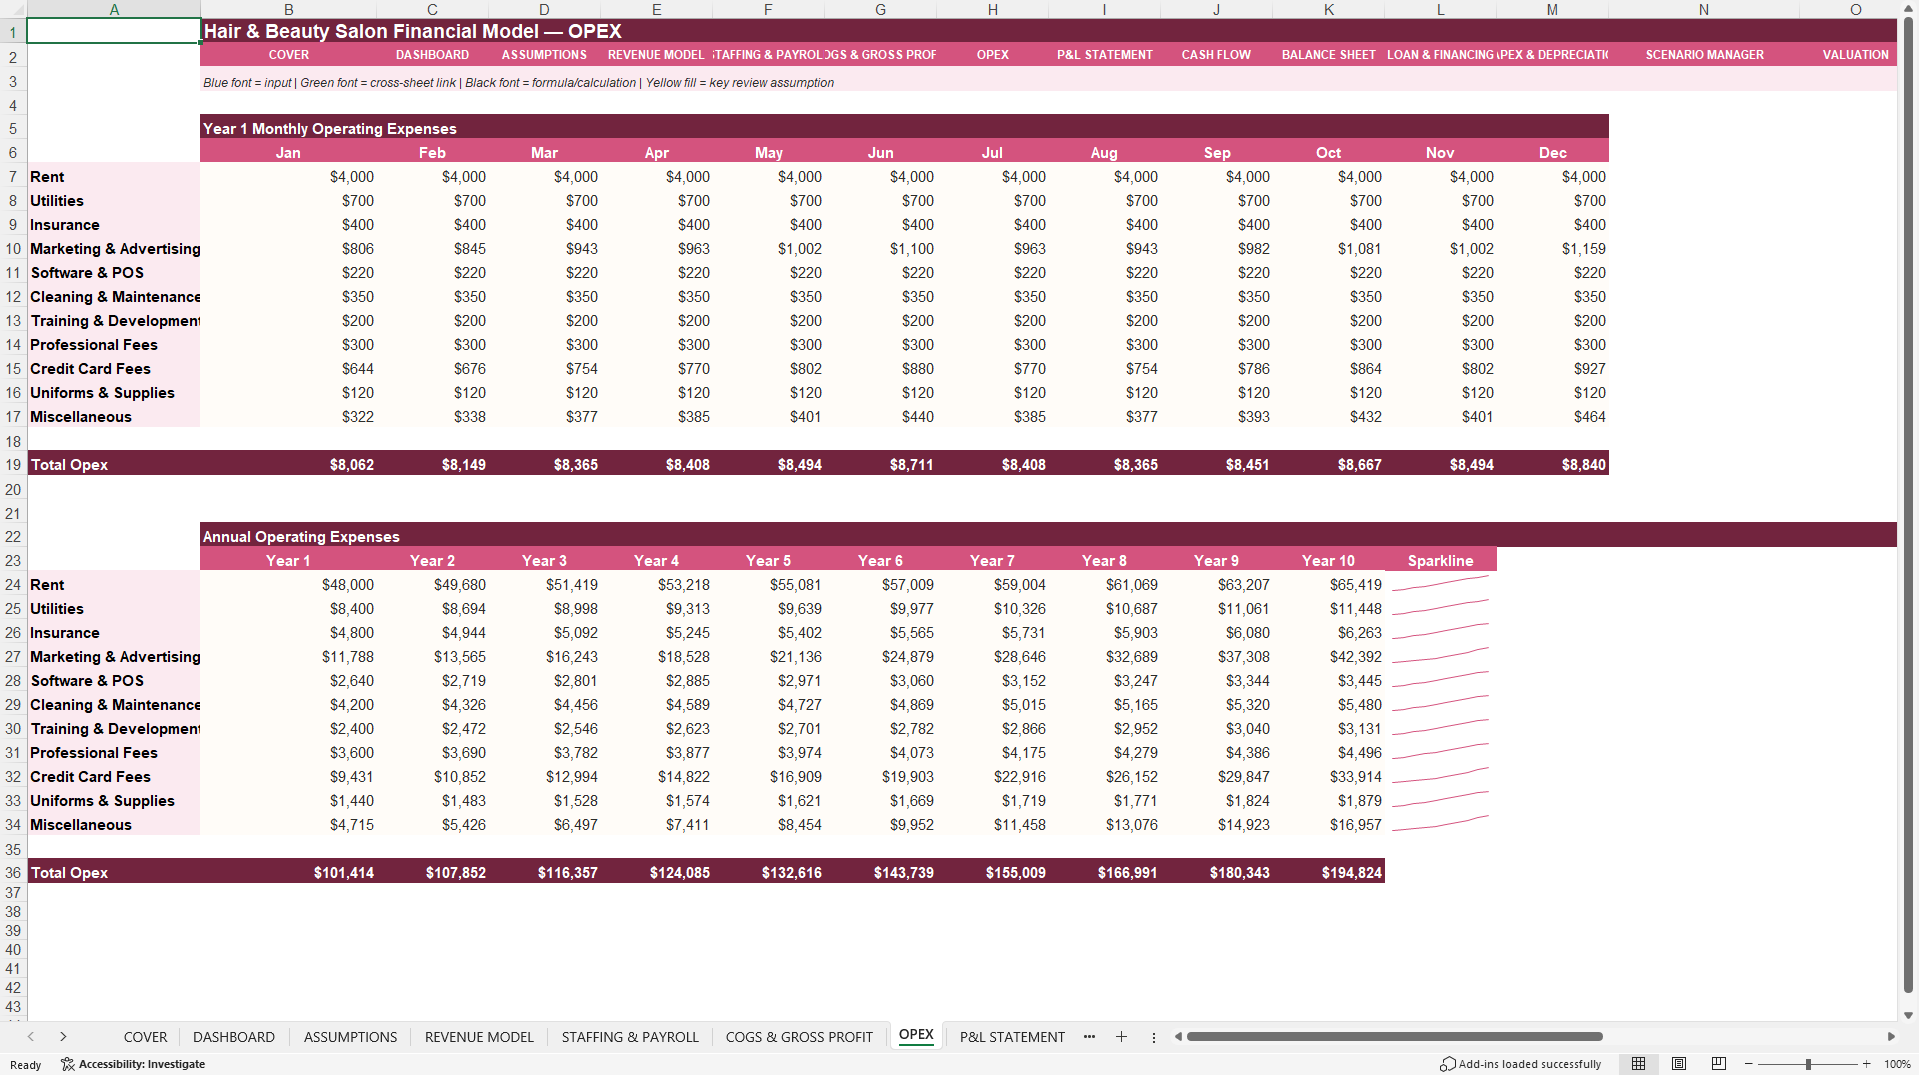
Year 1 monthly and 10-year annual operating expense schedules
COGS and gross profit analysis by revenue category
Capex and straight-line depreciation schedule for fit-out, equipment, furniture and fixtures, POS systems, and signage
Working-capital logic based on receivable days, inventory days, and payable days
The statements are linked so changes in the main assumptions flow through the operating schedules, profitability, cash position, balance sheet, and valuation outputs.
💳 Debt, funding, and cash planning
The Loan & Financing schedule supports up to three debt tranches. Users can customize each tranche's start year, draw amount, interest rate, and term. The model calculates opening balance, drawdowns, interest expense, principal repayments, and closing debt by year. Initial equity contribution and setup capex are also editable.
Cash planning includes beginning cash, ending cash, cumulative cash, a minimum-cash threshold, cash-runway metrics, Debt Service Coverage Ratio, Debt/EBITDA, and break-even timing. A Year 1 monthly view helps identify the modeled break-even month, while the annual schedule identifies the break-even year.
🔄 Base, Bull, and Bear scenario analysis
The Scenario Manager allows the user to switch between Base Case, Bull Case, and Bear Case. Each scenario adjusts five major drivers:
Volume growth
Price growth
COGS
Payroll growth
Operating expense inflation
The selected scenario flows through the main assumptions and forecast. A comparison table shows the Year 10 impact on revenue, EBITDA, net income, and ending cash, making the workbook useful for downside planning, lender discussions, investment analysis, and management decision-making.
💎 DCF valuation and sensitivity analysis
The Valuation sheet estimates free cash flow using EBITDA, cash taxes, changes in net working capital, and capital expenditure. It then calculates discounted forecast cash flows, terminal value, enterprise value, debt, cash, and equity value. The outputs also include EV/Revenue and EV/EBITDA multiples.
A two-way sensitivity table tests valuation across five WACC assumptions and five terminal-growth assumptions, helping the user understand how valuation changes when discount rates or long-term growth expectations move.
🎯 Executive dashboard and 22 KPIs
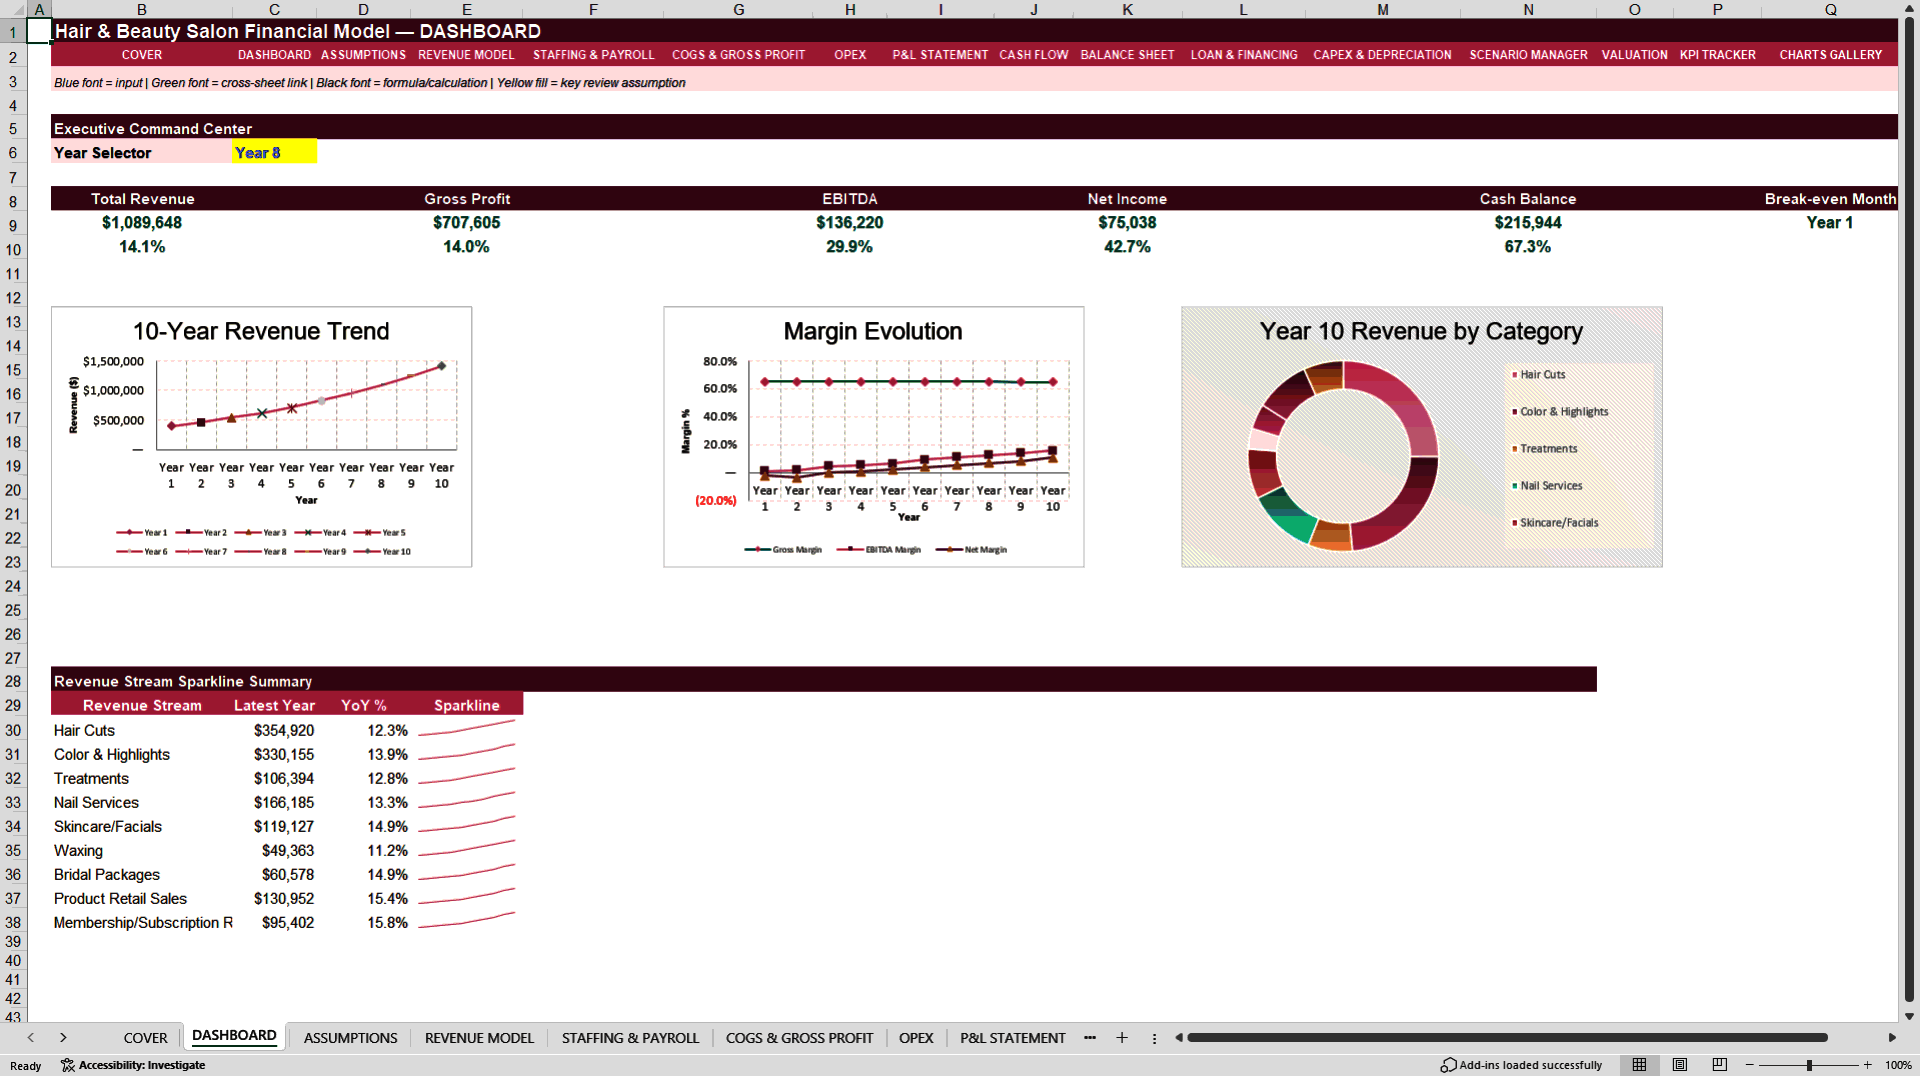
The year-selectable dashboard summarizes total revenue, gross profit, EBITDA, net income, cash balance, and break-even month. It also includes a 10-year revenue trend, margin evolution, Year 10 revenue mix, and revenue-stream sparklines.
The KPI Tracker covers 22 operating and financial measures:
Revenue per chair per day
Revenue per employee
Client retention rate
Average ticket value
Chair utilization
Gross margin
EBITDA margin
Net margin
Employee-to-revenue ratio
Marketing ROI
Monthly recurring revenue
Payback period
Cash conversion cycle
Debt Service Coverage Ratio
Return on Equity
Return on Assets
Product retail revenue mix
Bridal revenue mix
Revenue growth
Cash runway
Debt/EBITDA
Client visits per month
✅ Professional, auditable, and easy to navigate
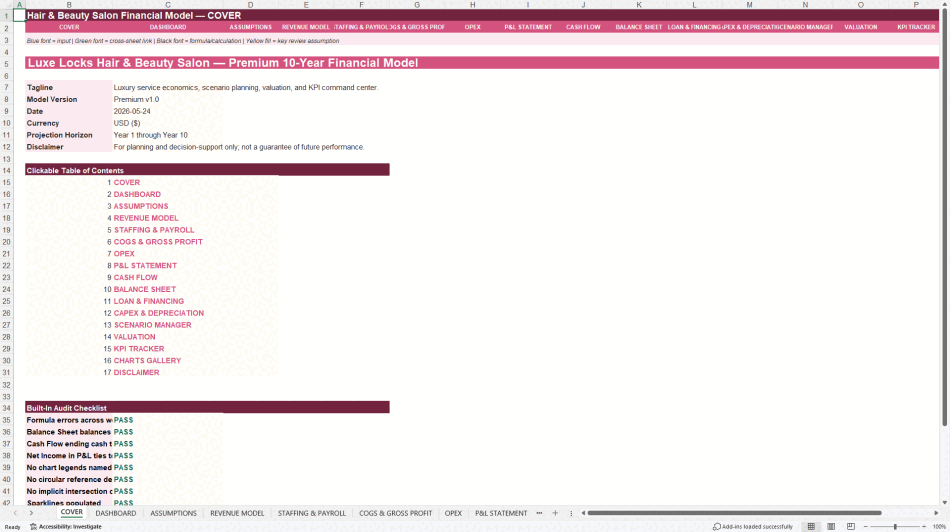
The workbook contains 17 purpose-built sheets with navigation links on every tab. A consistent color convention identifies editable inputs, cross-sheet links, formulas, and important review assumptions. Charts and sparklines support presentation and review, while the cover sheet includes built-in checks for formula errors, Balance Sheet balancing, Cash Flow-to-Balance Sheet cash reconciliation, Net Income reconciliation, circular-reference design, chart labeling, and navigation.
🛠️ How to use the model
Begin on the ASSUMPTIONS sheet and replace the illustrative inputs with your salon's operating days, service volumes, prices, utilization, growth, costs, commissions, staffing, rent, overhead, tax, working capital, funding, and capex assumptions.
Choose Base Case, Bull Case, or Bear Case in the SCENARIO MANAGER.
Review monthly Year 1 revenue and operating expenses, then assess annual results through Year 10.
Review the DASHBOARD, three financial statements, loan schedule, capex, break-even results, valuation, sensitivity table, and KPI trends.
Stress-test the inputs and compare scenarios before using the results in a business plan, financing request, investor discussion, acquisition review, or internal operating plan.
👤 Who should use this model?
This template is suitable for salon founders, independent salon owners, multi-service beauty businesses, operators considering expansion, consultants, accountants, finance professionals, business-plan writers, lenders, and investors. It can support new salon feasibility, acquisition review, renovation planning, capacity expansion, debt funding, annual budgeting, pricing analysis, hiring decisions, and performance monitoring.
Got a question about the product? Email us at support@flevy.com or ask the author directly by using the "Ask the Author a Question" form. If you cannot view the preview above this document description, go here to view the large preview instead.
Source: Best Practices in Salon & Spa, Integrated Financial Model Excel: Hair & Beauty Salon Financial Model Excel (XLSX) Spreadsheet, PDMM Financial Models
ABOUT THE AUTHOR

PDMM Financial Models develops professional, decision-ready Excel models for business owners, entrepreneurs, investors, consultants, analysts, and finance teams. Our objective is to transform complex business assumptions into clear, structured analysis that supports better planning and investment decisions.
Our models cover business planning, forecasting, budgeting, feasibility analysis,
... [read more]
Ask the Author a Question
You must be logged in to contact the author.




























