
BENEFITS OF THIS DOWNLOADABLE EXCEL DOCUMENT
- Excel XLSX File
PROJECT MANAGEMENT EXCEL DESCRIPTION
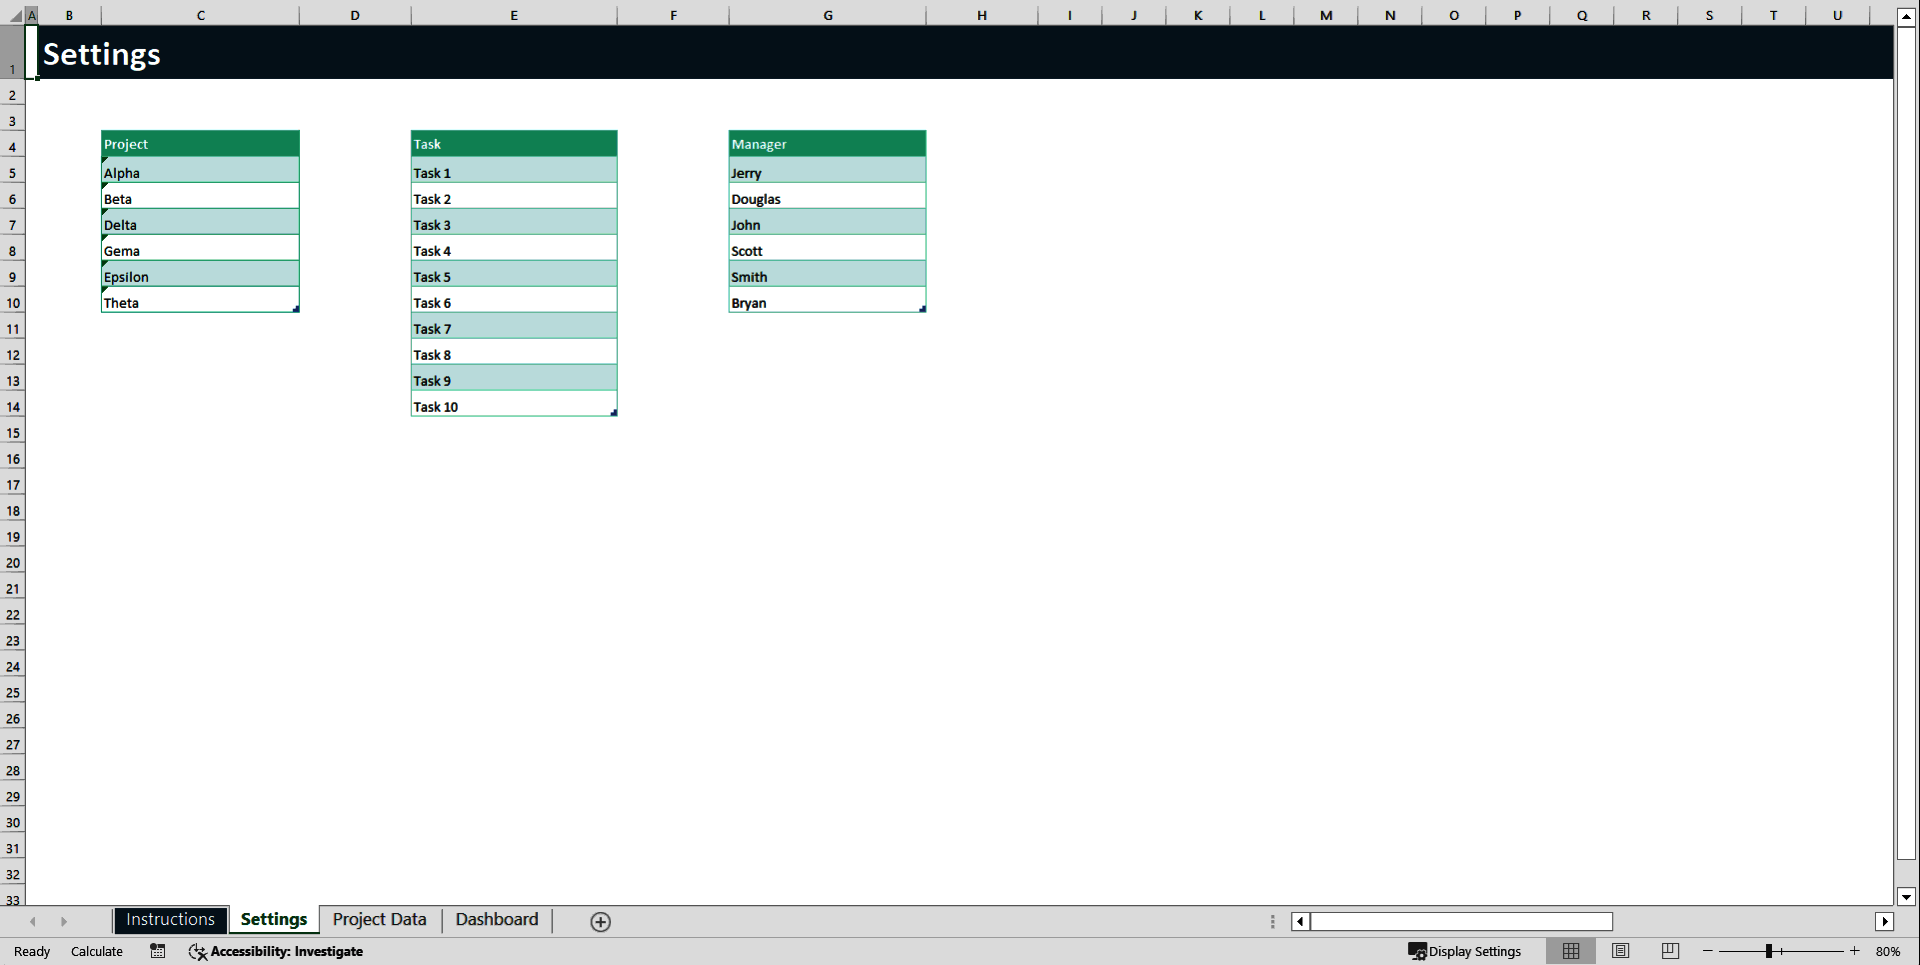
⚙️ Settings Sheet
The Settings sheet is the configuration area of the template. It allows you to customize the structure before entering any project data.
• This sheet contains predefined lists for Projects, Tasks, and Managers.
• These lists are connected to dropdown menus in the Project Data sheet.
• Updating these lists ensures consistent data entry and prevents spelling errors.
• You can add new projects, tasks, or managers at the bottom of each list.
• Do not leave blank rows within the lists, as this may affect dropdown functionality.
• Avoid renaming the sheet or deleting headers to maintain proper formula connections.
This sheet only needs to be updated when you want to customize or expand your system.
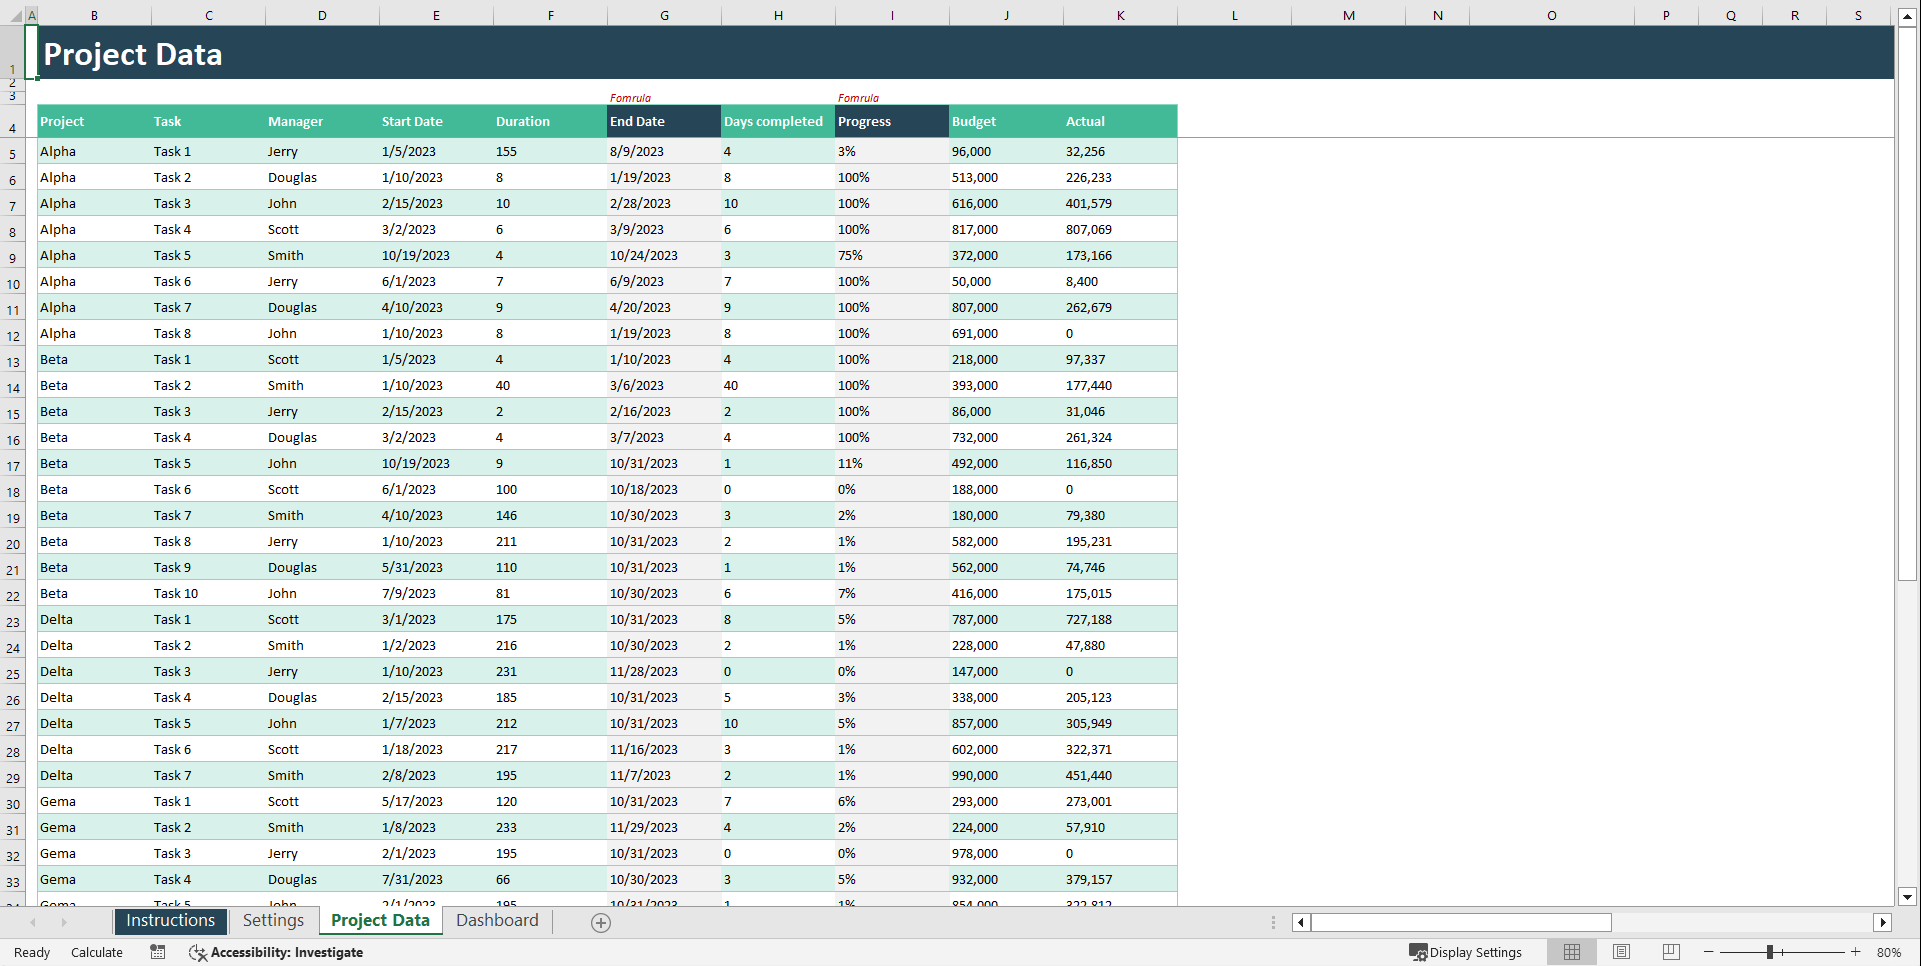
📋 Project Data Sheet
The Project Data sheet is the main input area of the template. Every row represents a single task and feeds the Dashboard and Gantt Chart automatically.
• Select the Project name from the dropdown menu.
• Select the Task name from the dropdown menu.
• Choose the responsible Manager.
• Enter the Start Date of the task.
• Enter the Duration in days.
• The End Date is calculated automatically (if formulas are enabled).
• Enter the number of Days Completed to track progress.
• The Progress percentage is calculated automatically based on completed days divided by total duration.
• Enter the planned Budget for the task.
• Enter the Actual cost spent so far.
Important usage guidelines:
• Do not delete or modify formula cells.
• Do not change the table headers.
• Always use valid date formats.
• Update progress and actual costs regularly to keep reports accurate.
All dashboard charts and timeline visuals update automatically based on this sheet.
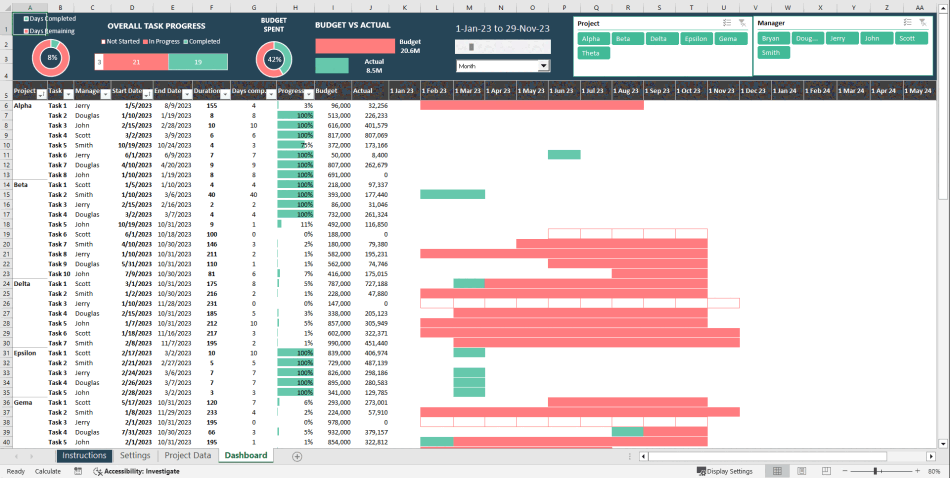
📈 Dashboard Sheet
The Dashboard sheet provides a high-level visual summary of your projects. It is fully automated and does not require manual data entry.
• Displays overall project performance metrics.
• Shows task completion percentages.
• Compares Budget vs Actual spending.
• Highlights manager performance.
• Provides visual charts and KPI indicators for quick insights.
• Updates automatically when changes are made in the Project Data sheet.
This sheet is designed for reporting, presentations, and performance analysis.
📅 Gantt Chart
The Gantt Chart sheet provides a timeline view of all tasks across projects. It visually represents scheduling and progress.
• Displays tasks across a calendar timeline.
• Shows task start and end dates visually.
• Highlights planned task duration.
• Indicates completed portion of each task.
• Helps identify delays or overlapping tasks.
• Updates automatically based on Project Data entries.
This sheet is ideal for monitoring project timelines and workload distribution.
🔄 Recommended Workflow
To use the template effectively:
• First, customize project names, tasks, and managers in the Settings sheet.
• Second, enter all task details in the Project Data sheet.
• Third, review insights in the Dashboard sheet.
• Finally, monitor timelines in the Gantt Chart sheet.
Once data is entered, refresh it and everything else updates automatically.
Got a question about the product? Email us at support@flevy.com or ask the author directly by using the "Ask the Author a Question" form. If you cannot view the preview above this document description, go here to view the large preview instead.
Source: Best Practices in Project Management Excel: Excel Project Management Dashboard Excel (XLSX) Spreadsheet, Improve Your Excel
ABOUT THE AUTHOR
Introducing our Excel Premium Templates – your solution to simplifying your tasks. Our collection offers meticulously designed templates that are crafted to streamline your work processes and enhance efficiency. Whether you're managing budgets, creating reports, or organizing data, our premium templates are tailored to cater to your specific needs. With user-friendly interfaces and ... [read more]
Ask the Author a Question
You must be logged in to contact the author.
