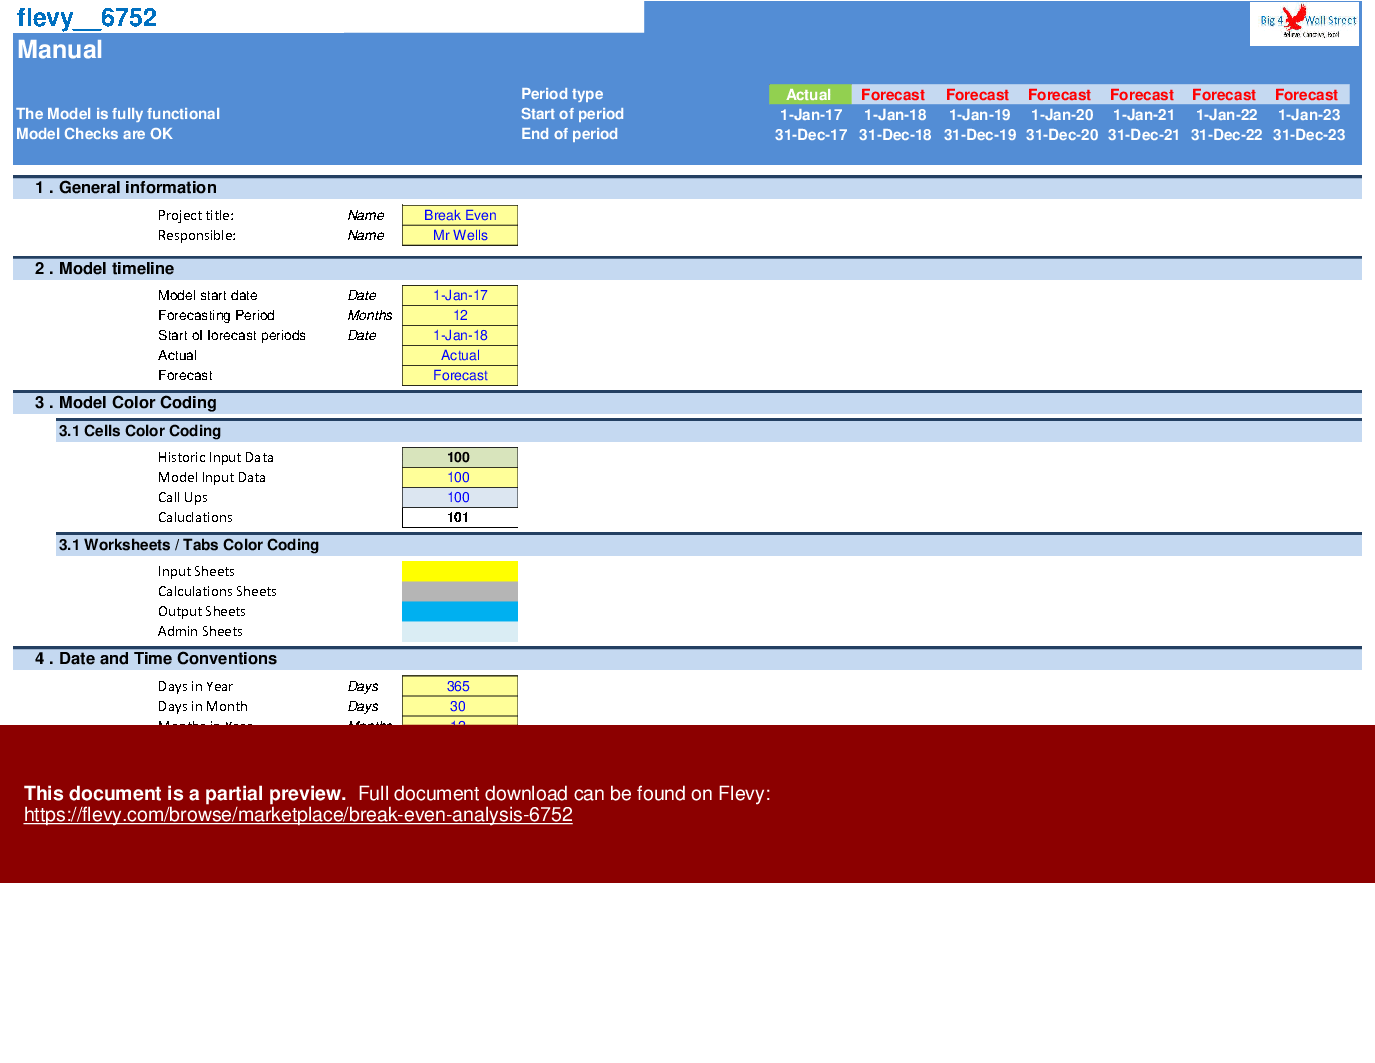

Break Even Analysis – Excel XLSX
Excel (XLSX)
BENEFITS OF THIS DOWNLOADABLE EXCEL DOCUMENT
- Calculate Break Even Dollar Sales
- Calculate Break Even Sales #
- Contribution margin,Target profit, Margin of safety
BREAK EVEN ANALYSIS EXCEL DESCRIPTION
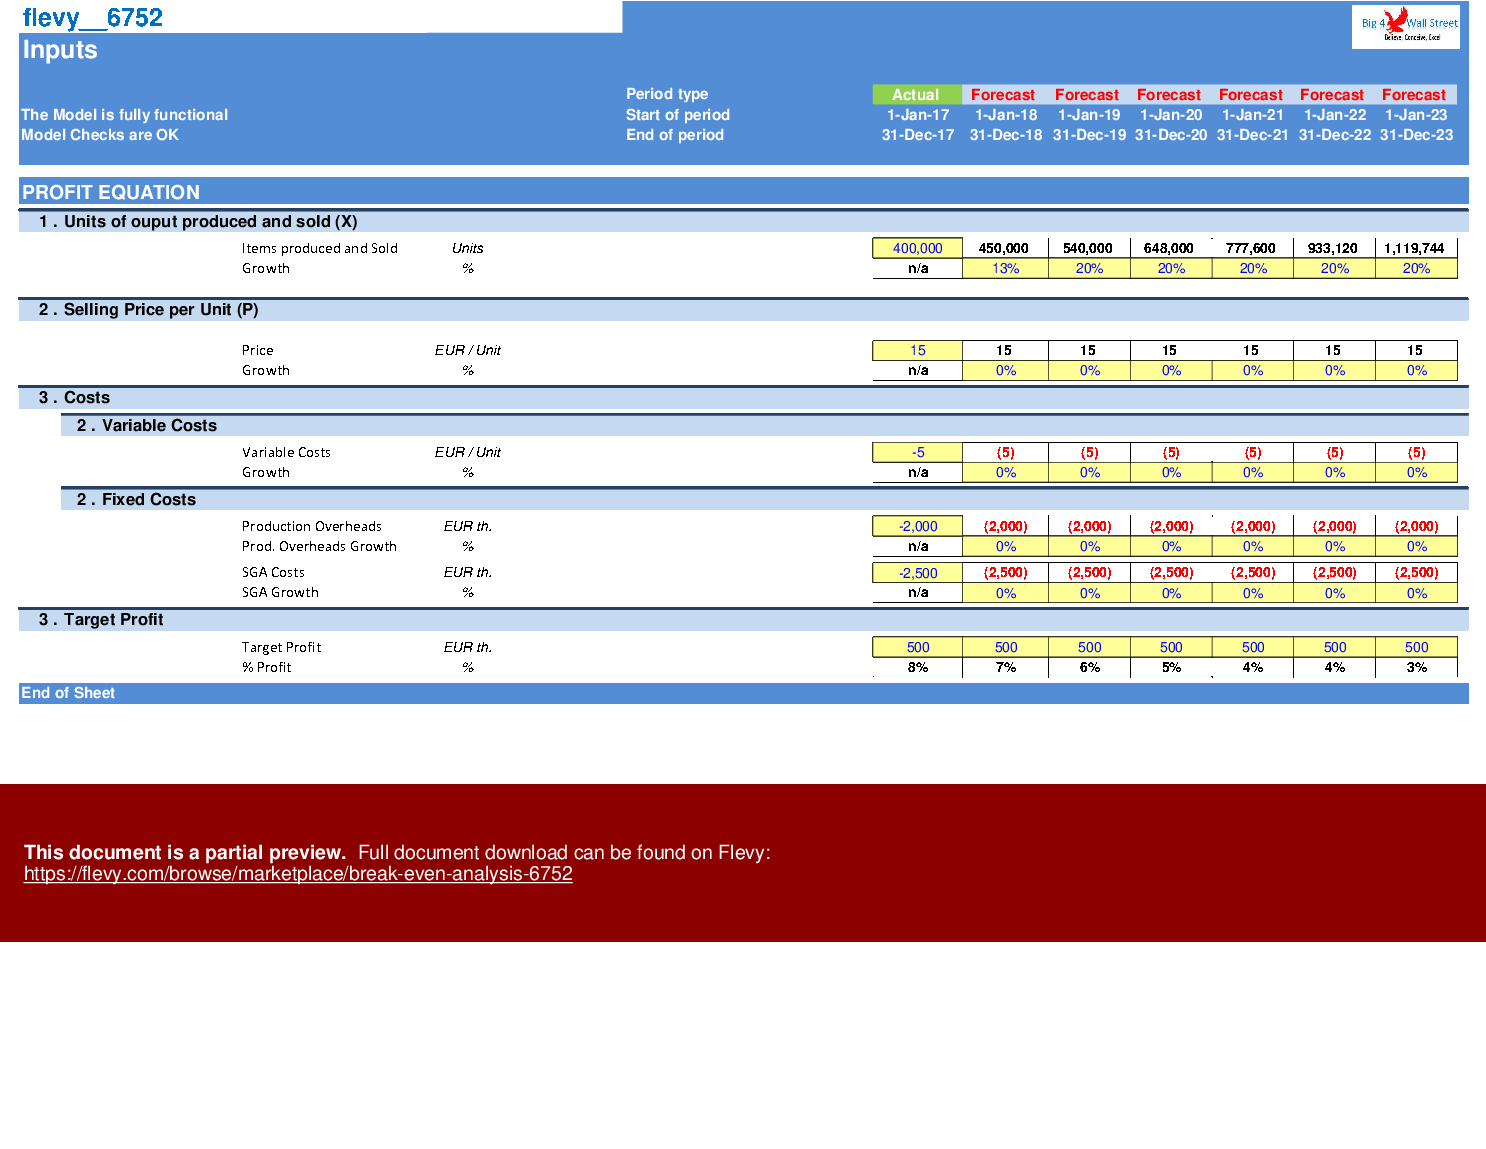
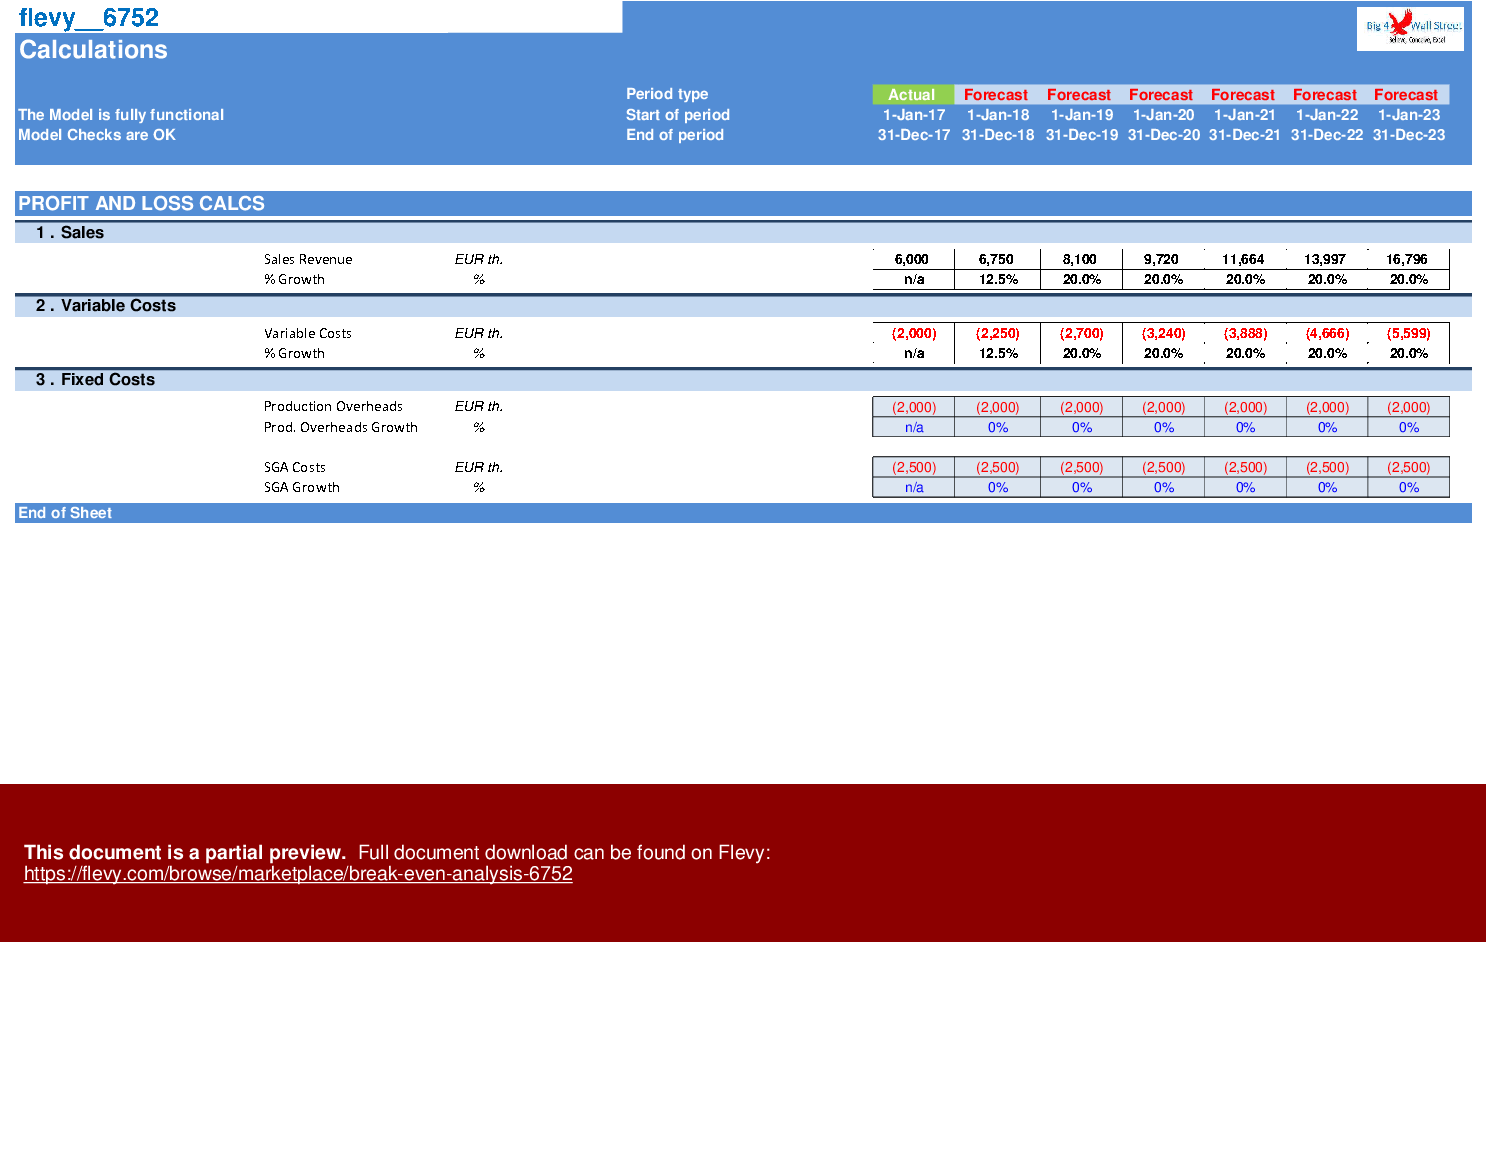
Managers must make decisions about sales volume, pricing and costs and are concerned about the impact of their decisions on profit. Therefore, they need to understand the relations among revenues, costs, volume and profit. Cost-volume-profit, or CVP, analysis provides managers with information for decision making.
What is CVP?
CVP analysis explores the relationship between sales revenue, cost and their effect on profits. CVP analysis is also known as Break-even analysis.
Contribution Margin
Contribution margin (CM) is the amount remaining from sales revenue after variable expenses have been deducted. CM goes to cover fixed expenses.
Basically CM is the difference between price and variable cost. It is what is leftover to cover fixed costs and then add to operating profit.
Contribution Margin Ratio
The contribution margin ratio is the contribution margin as a percentage of sales revenue.
Contribution Margin Ratio
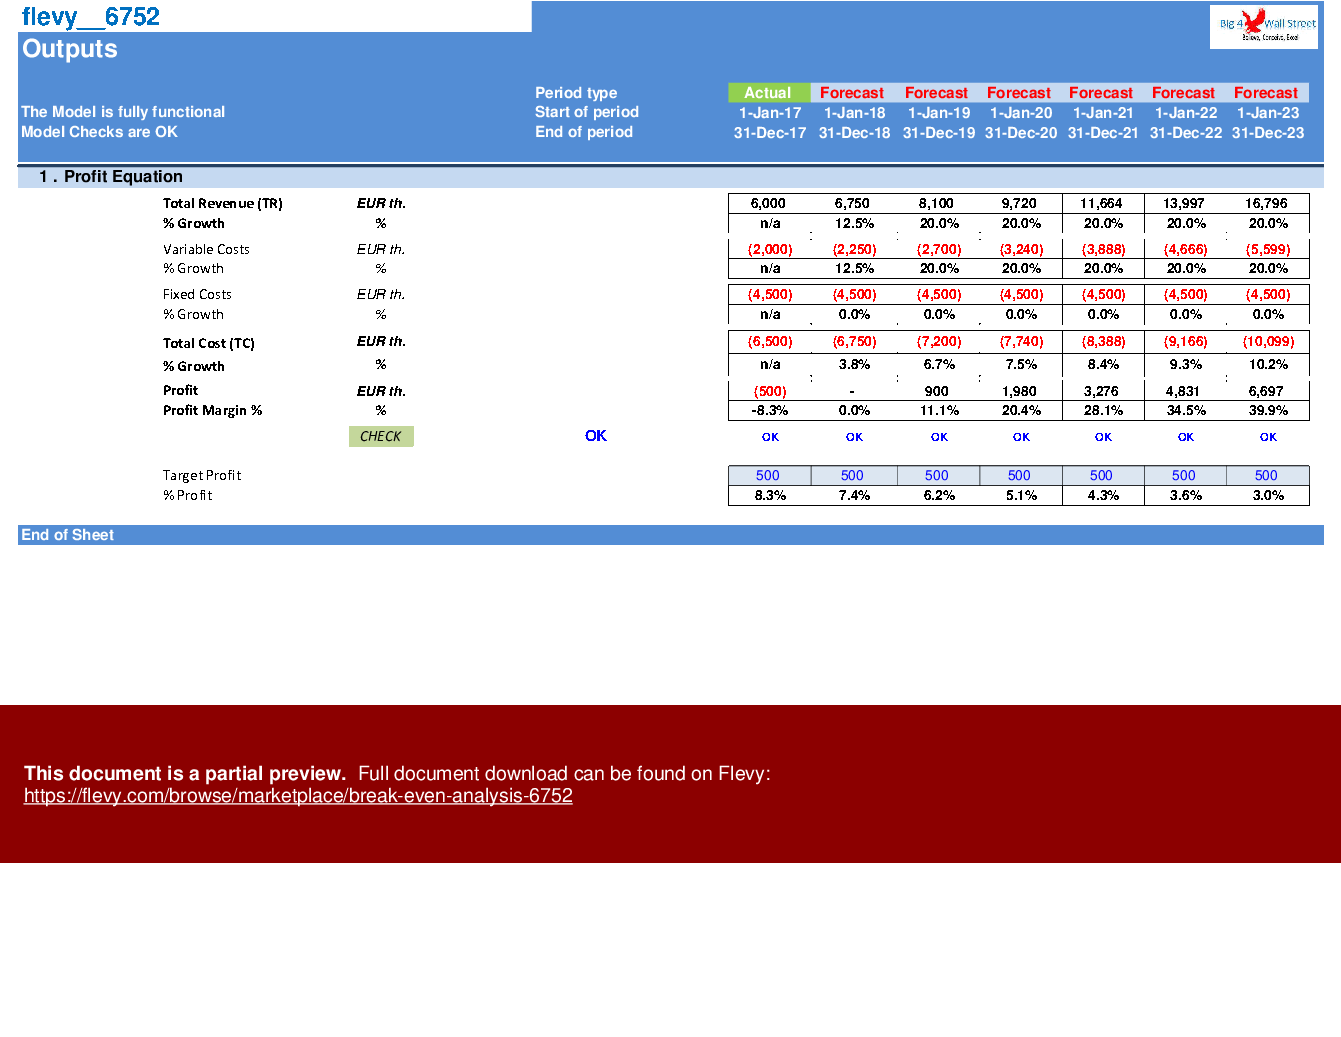
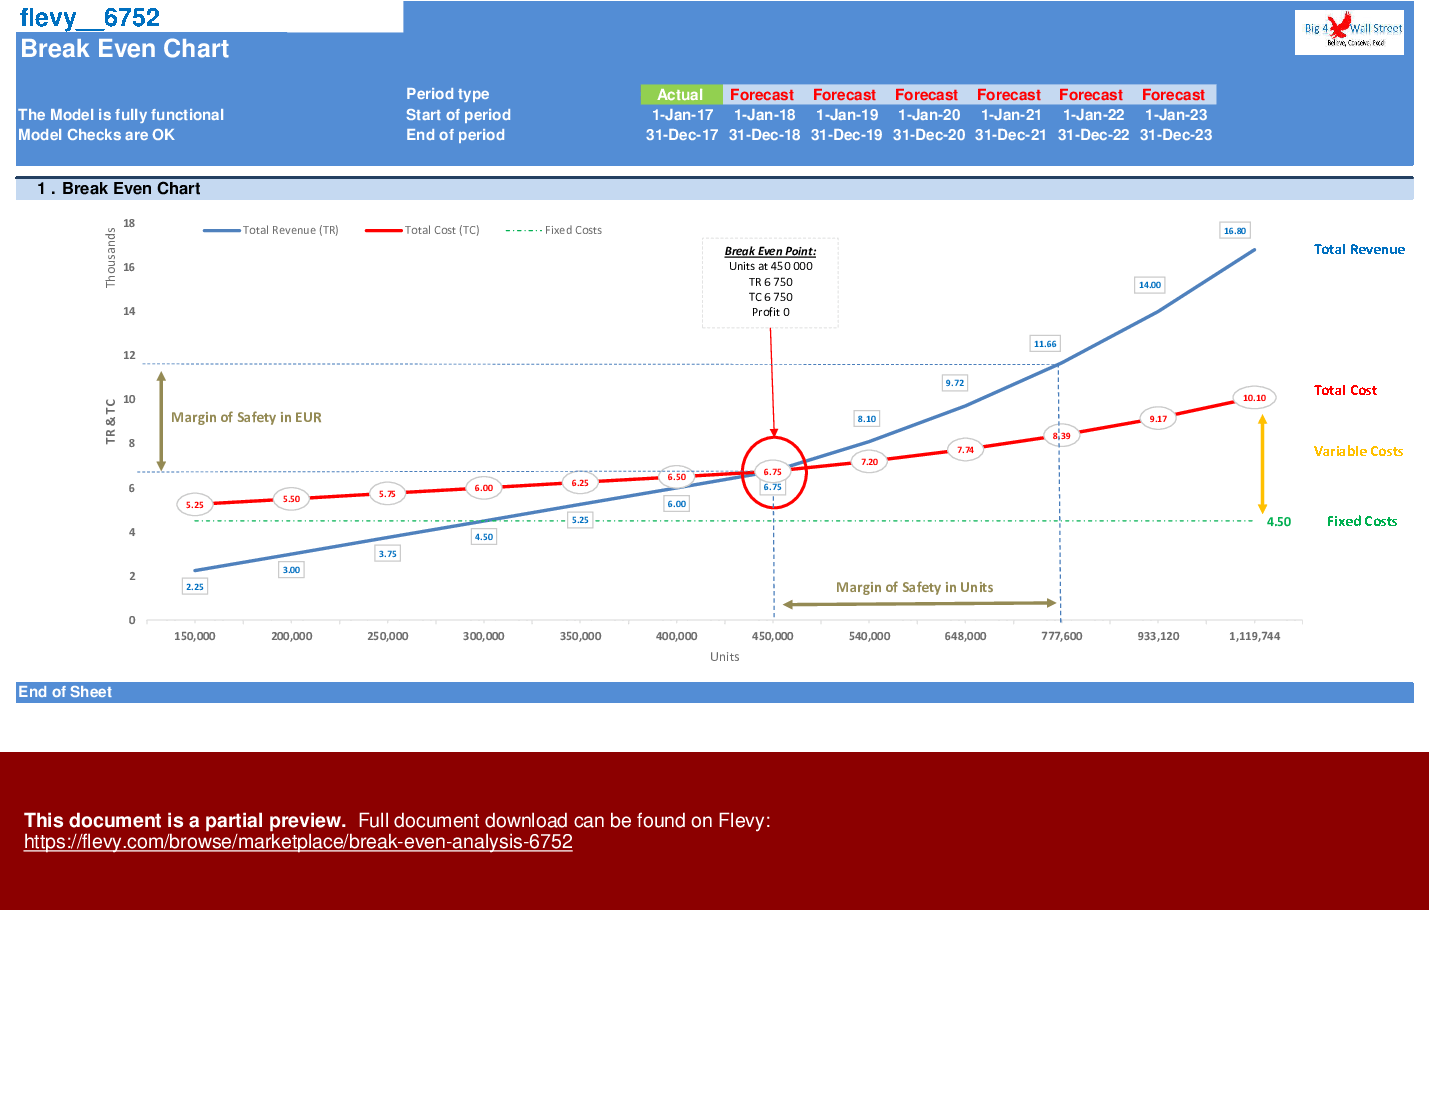
Break Even Analysis
The break-even point can be defined as:
the level of activity at which a business makes neither a profit nor loss.
OR
the point where total sales revenue equals total expenses (variable and fixed)
OR
the point where total contribution margin equals total fixed expenses.
In summary, at break-even target profit is zero. Therefore, break-even sales volume in units equals fixed costs divided by unit contribution margin and break-even sales volume in dollars equals fixed costs divided by contribution margin ratio.
Target Profit Analysis
In addition to calculating the break-even level of sales, a company can set itself a target to achieve a certain level of profits.
Margin of Safety
Margin of safety is the excess of budgeted or actual sales revenue over break-even revenue.
Expressed as a % of Budgeted Sales Value or in units above break-even level.
In other words, the margin of safety indicates the risk of losing money that a company faces.
How much can sales decrease in either volume or revenue before the company experiences a net loss?
Got a question about the product? Email us at support@flevy.com or ask the author directly by using the "Ask the Author a Question" form. If you cannot view the preview above this document description, go here to view the large preview instead.
Source: Best Practices in Break Even Analysis Excel: Break Even Analysis Excel (XLSX) Spreadsheet, Big4WallStreet
ABOUT THE AUTHOR
We help small and midsize businesses' leaders with their strategic problems by creating or improving financial models, implementing tools to drive efficiency, performance, and better decision making.
With over 15 years of experience in Financial & Business Modeling / Planning, Performance & Analysis (Ernst & Young, Toyota, Viohalco and Upstream), we have developed strong business
... [read more]
Ask the Author a Question
You must be logged in to contact the author.
