
 Click main image to view in full screen. Unlock all 13 preview images:
TCFD / ISSB Physical Climate Risk Model – Excel XLSX
Excel (XLSX) + supplemental PDF


BENEFITS OF THIS DOWNLOADABLE EXCEL DOCUMENT
- Provides a structured financial translation layer for converting climate scenarios into asset value, revenue, insurance, supply chain, P&L, balance sheet, and adaptation CapEx impacts.
- Supports TCFD / ISSB-style reporting preparation through scenario mapping, quantitative outputs, and disclosure-ready narrative sections.
- Helps decision-makers evaluate climate risk exposure, stranded asset risk, carbon repricing sensitivity, supply chain disruption, and resilience investment economics.
ESG EXCEL DESCRIPTION
🌍 TCFD / ISSB Physical Climate Risk Financial Model
The TCFD / ISSB Physical Climate Risk Financial Model is a premium Excel-based financial model designed to translate physical climate risk scenarios into practical financial outputs for corporate planning, risk management, ESG reporting, investor communication, and disclosure preparation.
Many organizations discuss climate risk qualitatively, but the difficult part is converting climate exposure into financial impact. This model helps bridge that gap by linking physical climate scenarios to asset value, revenue exposure, insurance cost, carbon repricing, supply chain disruption, adaptation CapEx, P&L impact, balance sheet impact, and ISSB / TCFD-style disclosure outputs.
This model is especially useful for companies, consultants, investors, analysts, sustainability teams, risk managers, and CFO offices that need a structured way to quantify climate-related financial exposure.
⚡ What This Model Is Used For
This model is used to evaluate how physical climate risks may affect a business financially under different climate pathways.
It helps users answer key questions such as:
✅ What is the asset value at risk under RCP 2.6, RCP 4.5, and RCP 8.5?
✅ Which facilities, regions, or assets face the highest climate exposure?
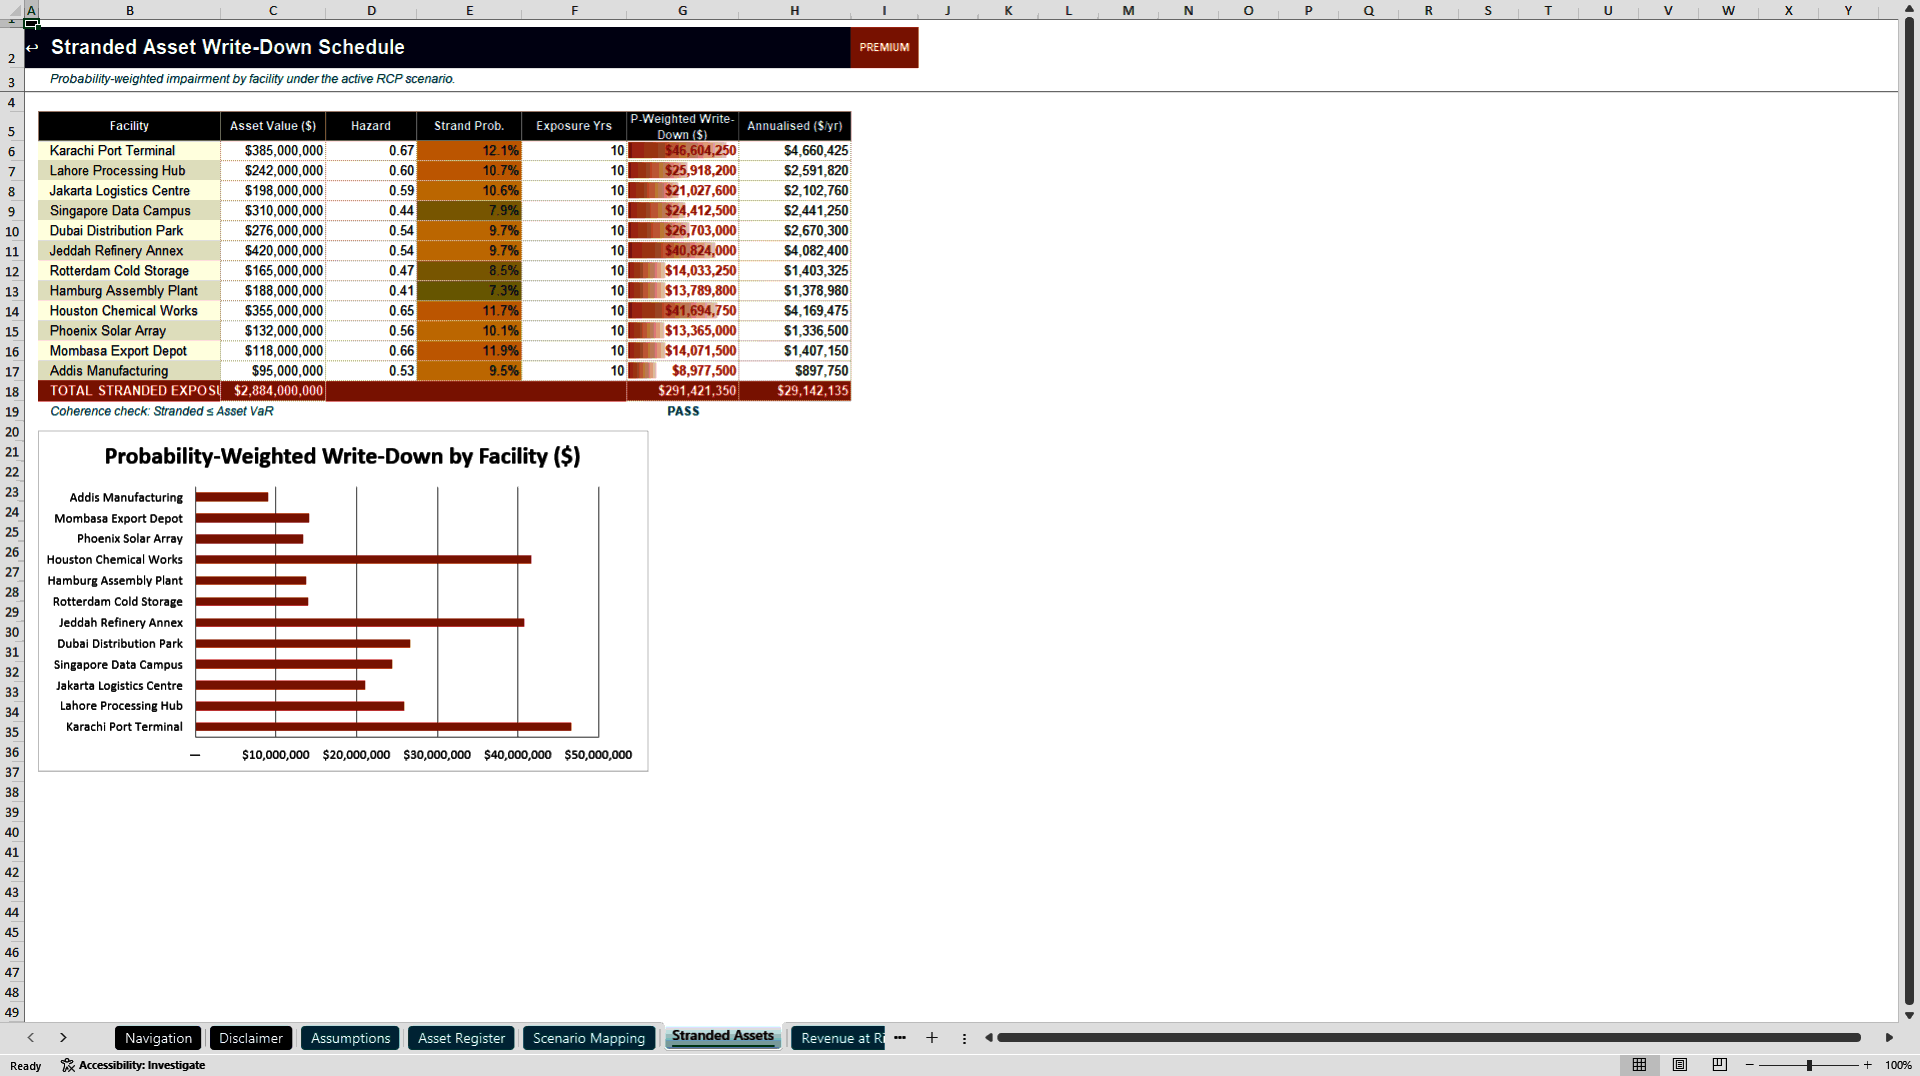
✅ What is the probability-weighted stranded asset write-down?
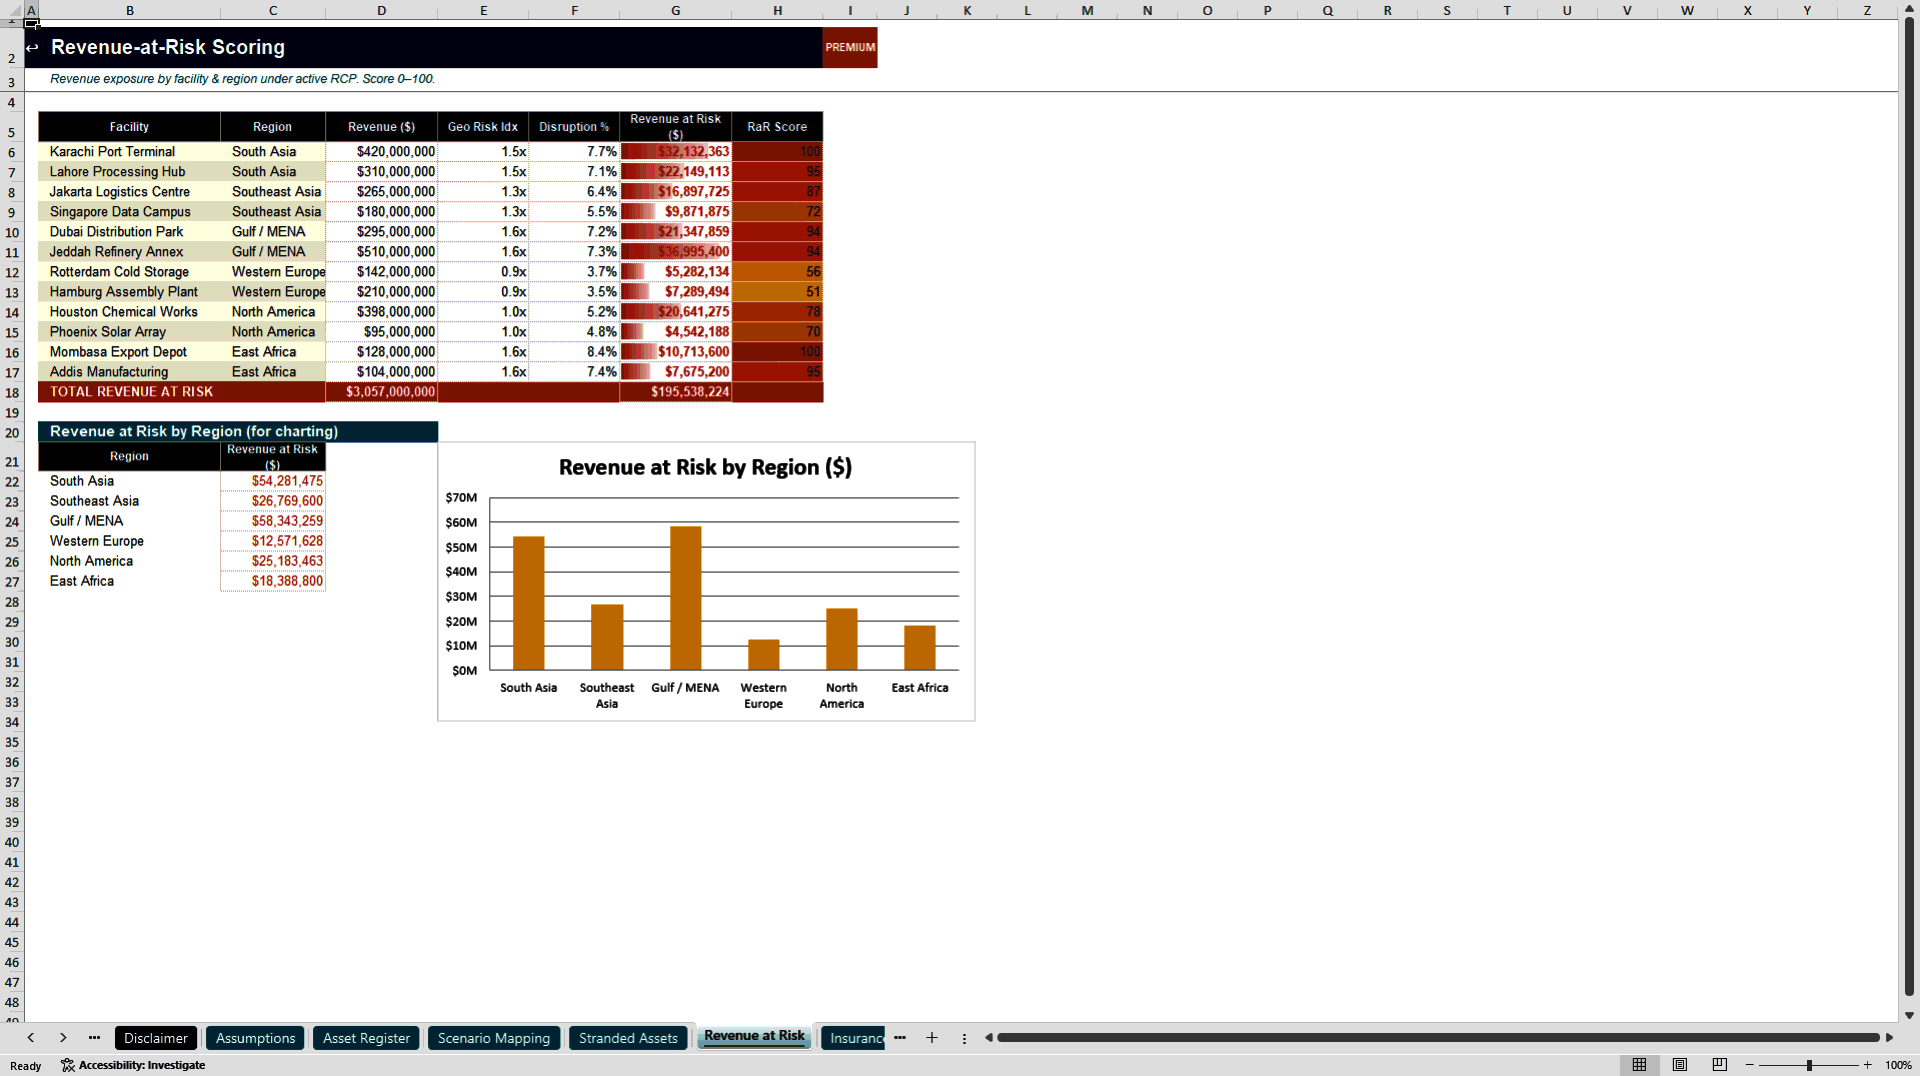
✅ How much revenue is exposed by facility and geography?
✅ How will insurance premiums escalate under different climate scenarios?
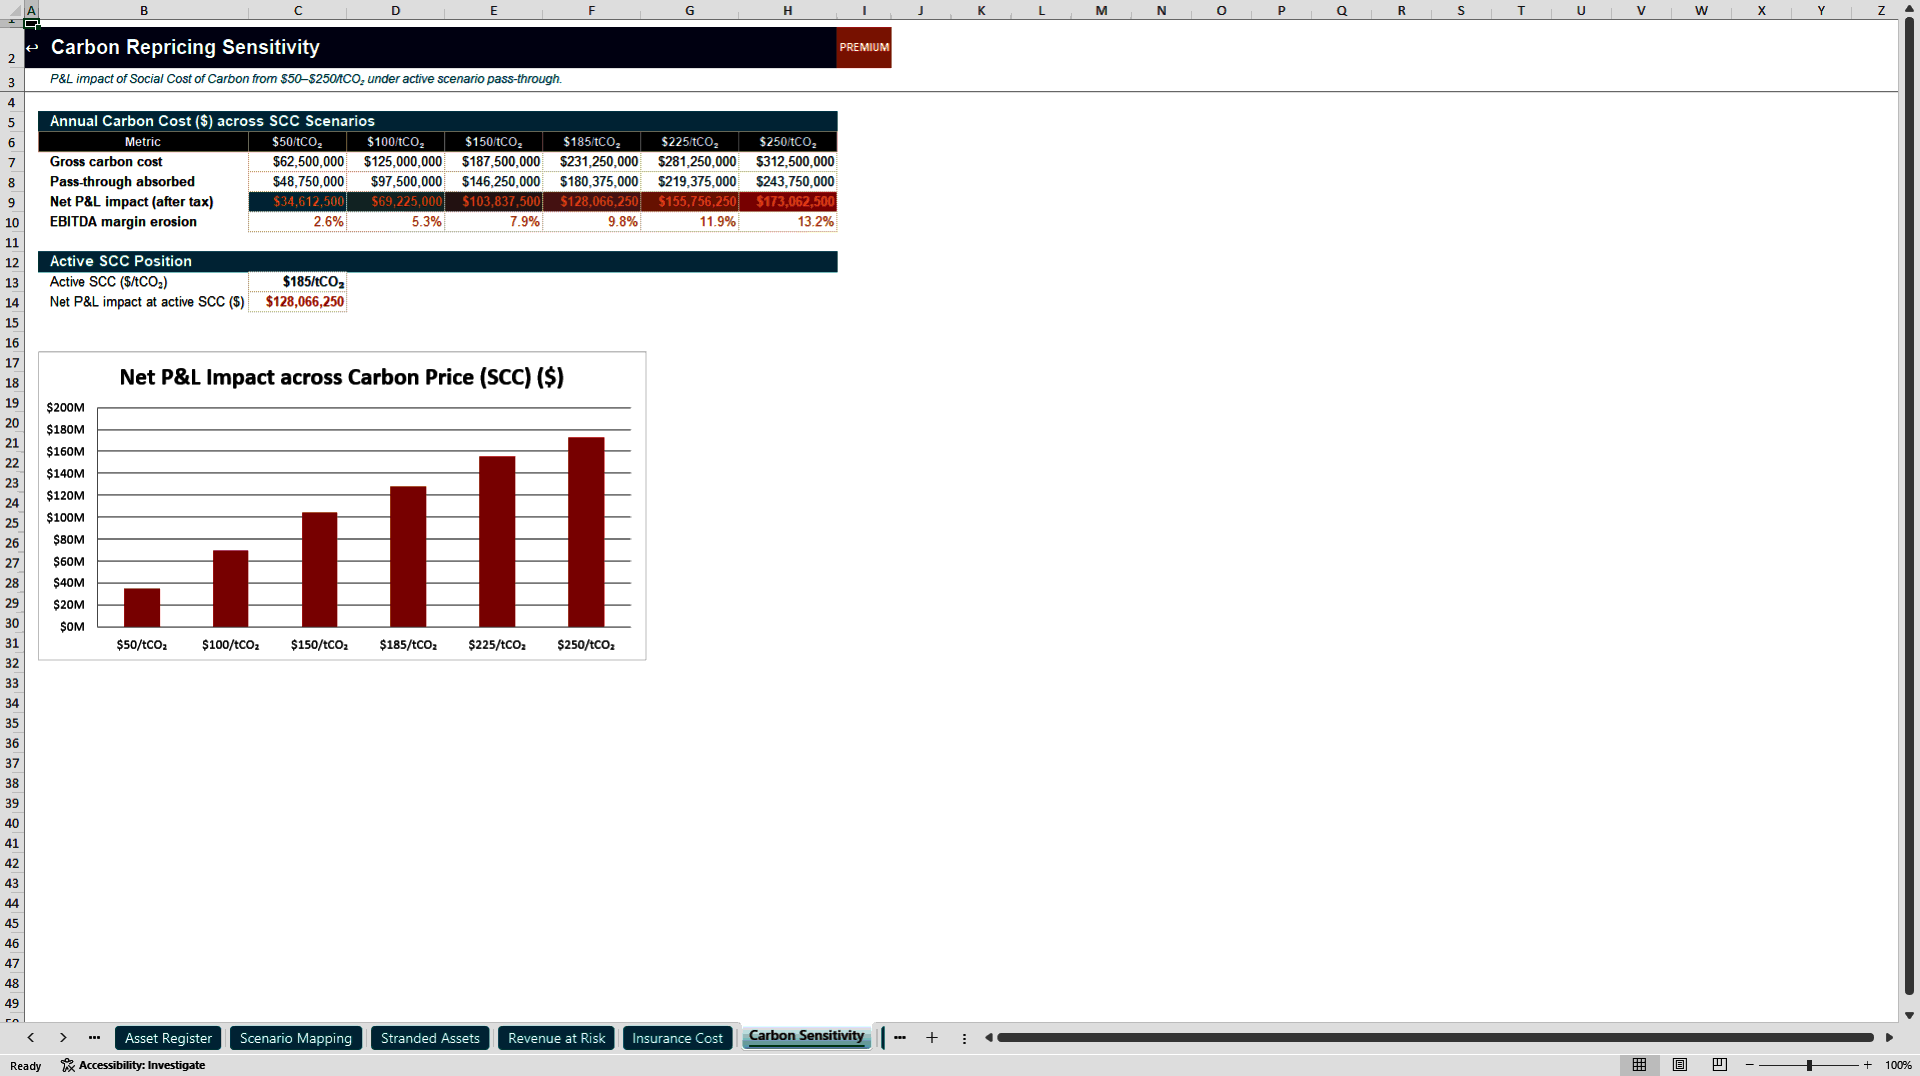
✅ What is the P&L impact of carbon repricing from $50–$250/tCO₂?
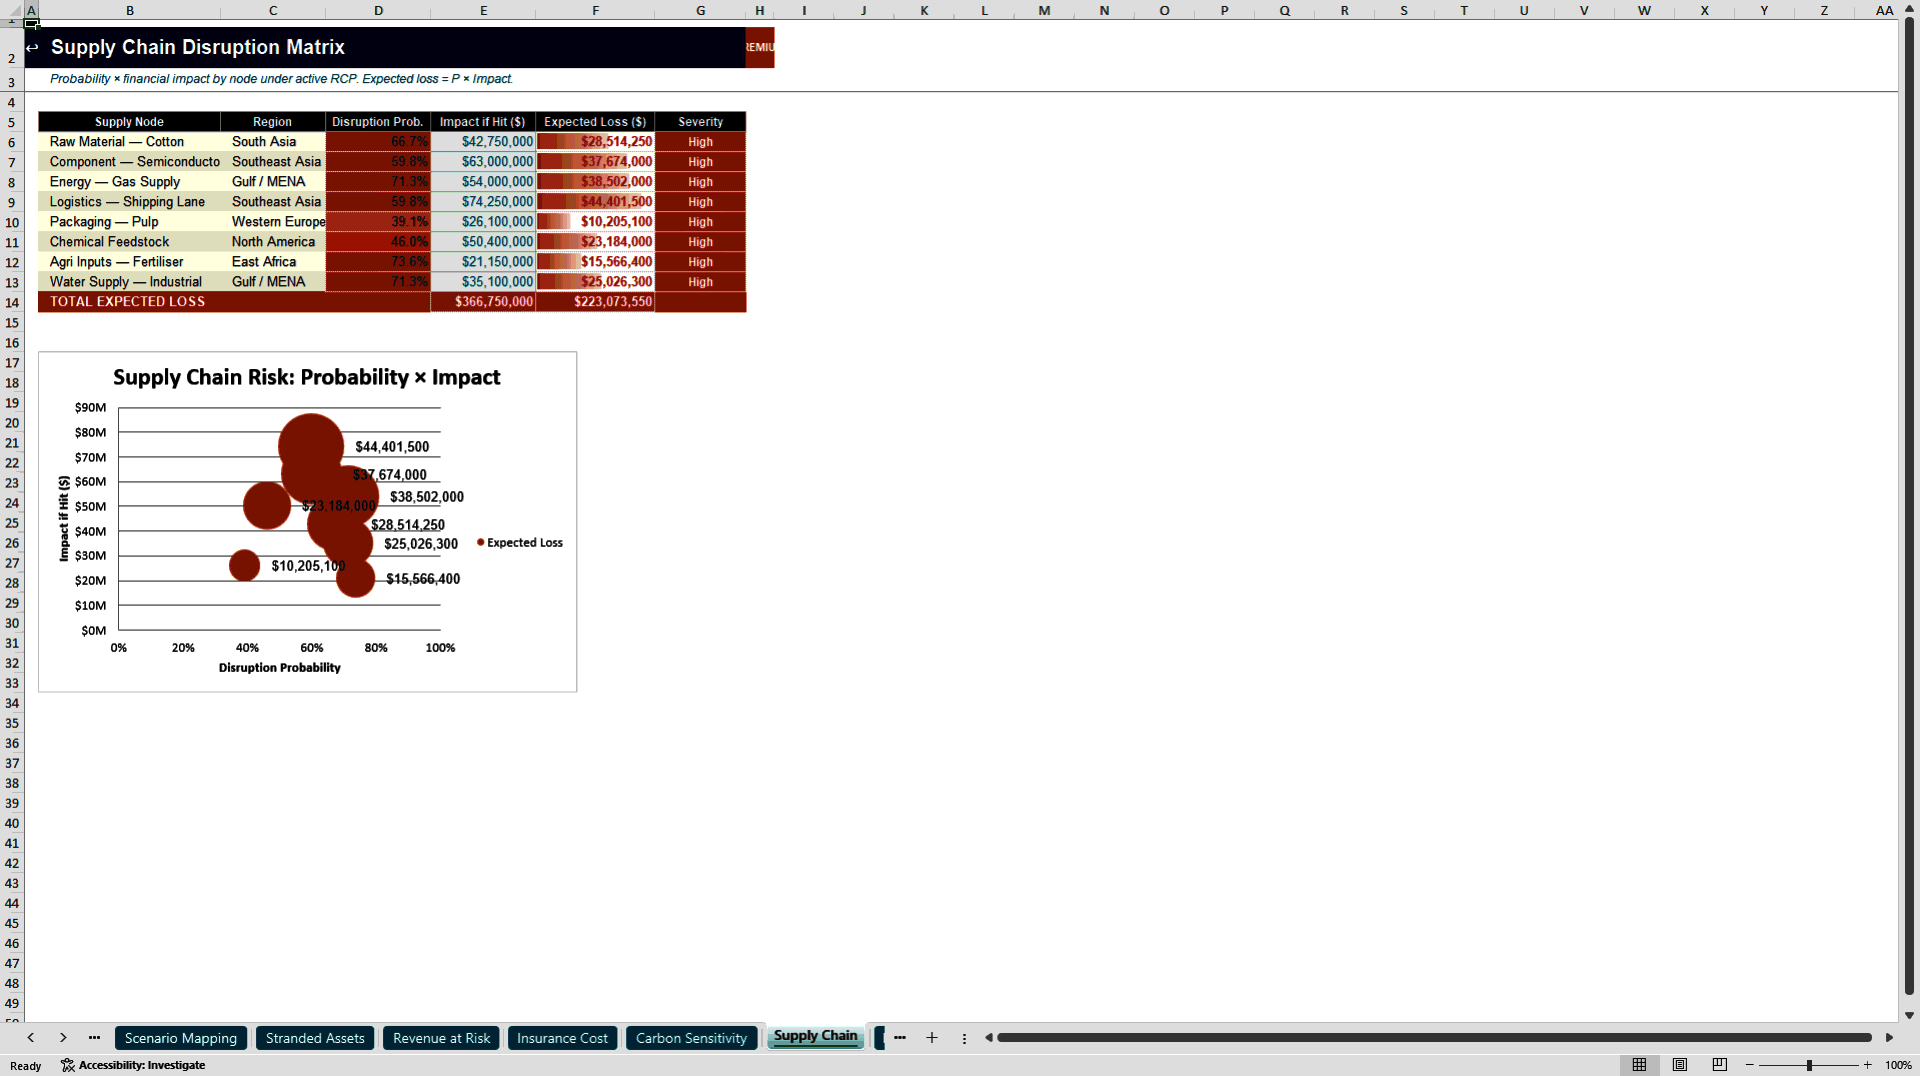
✅ What is the expected financial impact of supply chain disruption?
✅ What adaptation CapEx is required and does it generate positive avoided-loss NPV?
✅ How do climate risks flow into P&L and balance sheet outputs?
✅ What disclosure-ready outputs can support TCFD / ISSB-style reporting?
🔥 Core Model Features
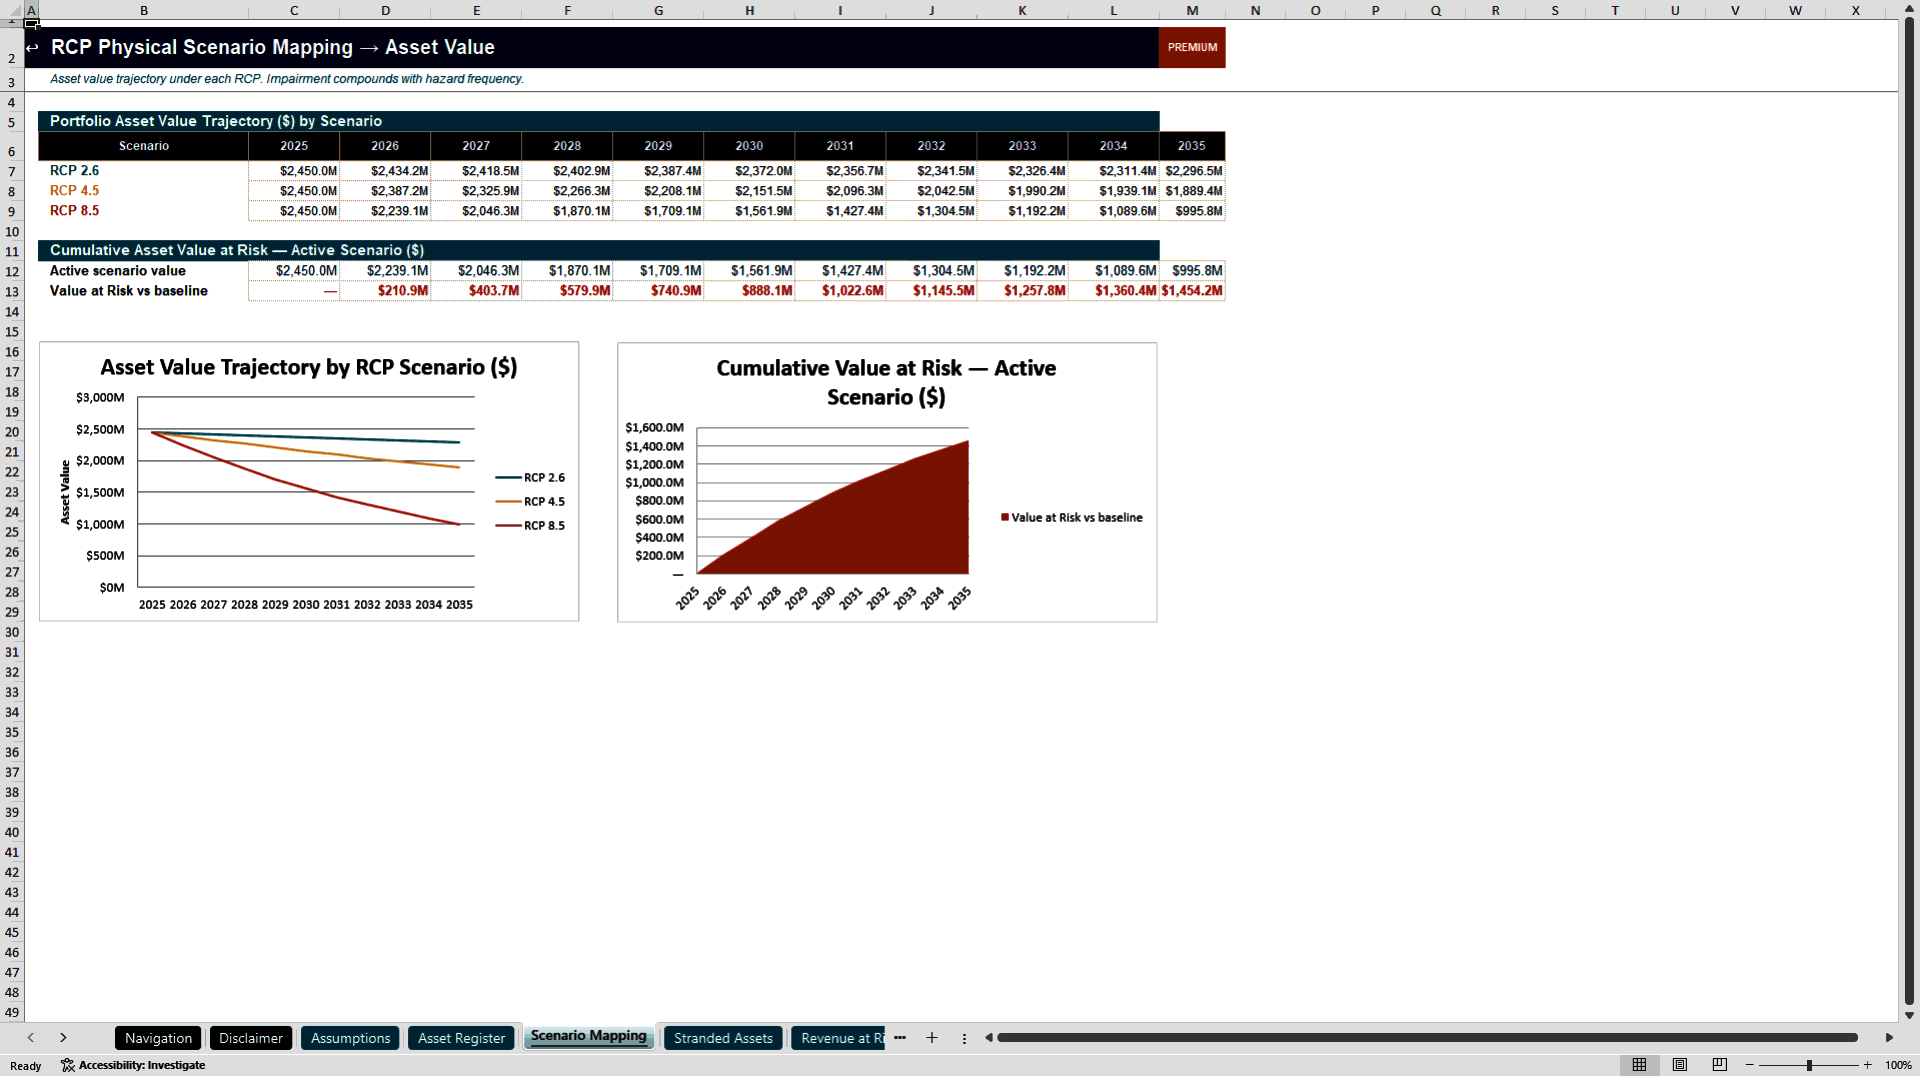
1. RCP Scenario Mapping
The model includes physical climate scenario mapping across:
🔹 RCP 2.6
🔹 RCP 4.5
🔹 RCP 8.5
The scenario mapping module connects climate pathways to warming assumptions, hazard multipliers, sea-level rise, precipitation stress, heat stress, drought stress, wildfire risk, flood risk, insurance escalation, and stranding probability.
This gives the user a structured method for comparing lower-risk and higher-risk climate outcomes.
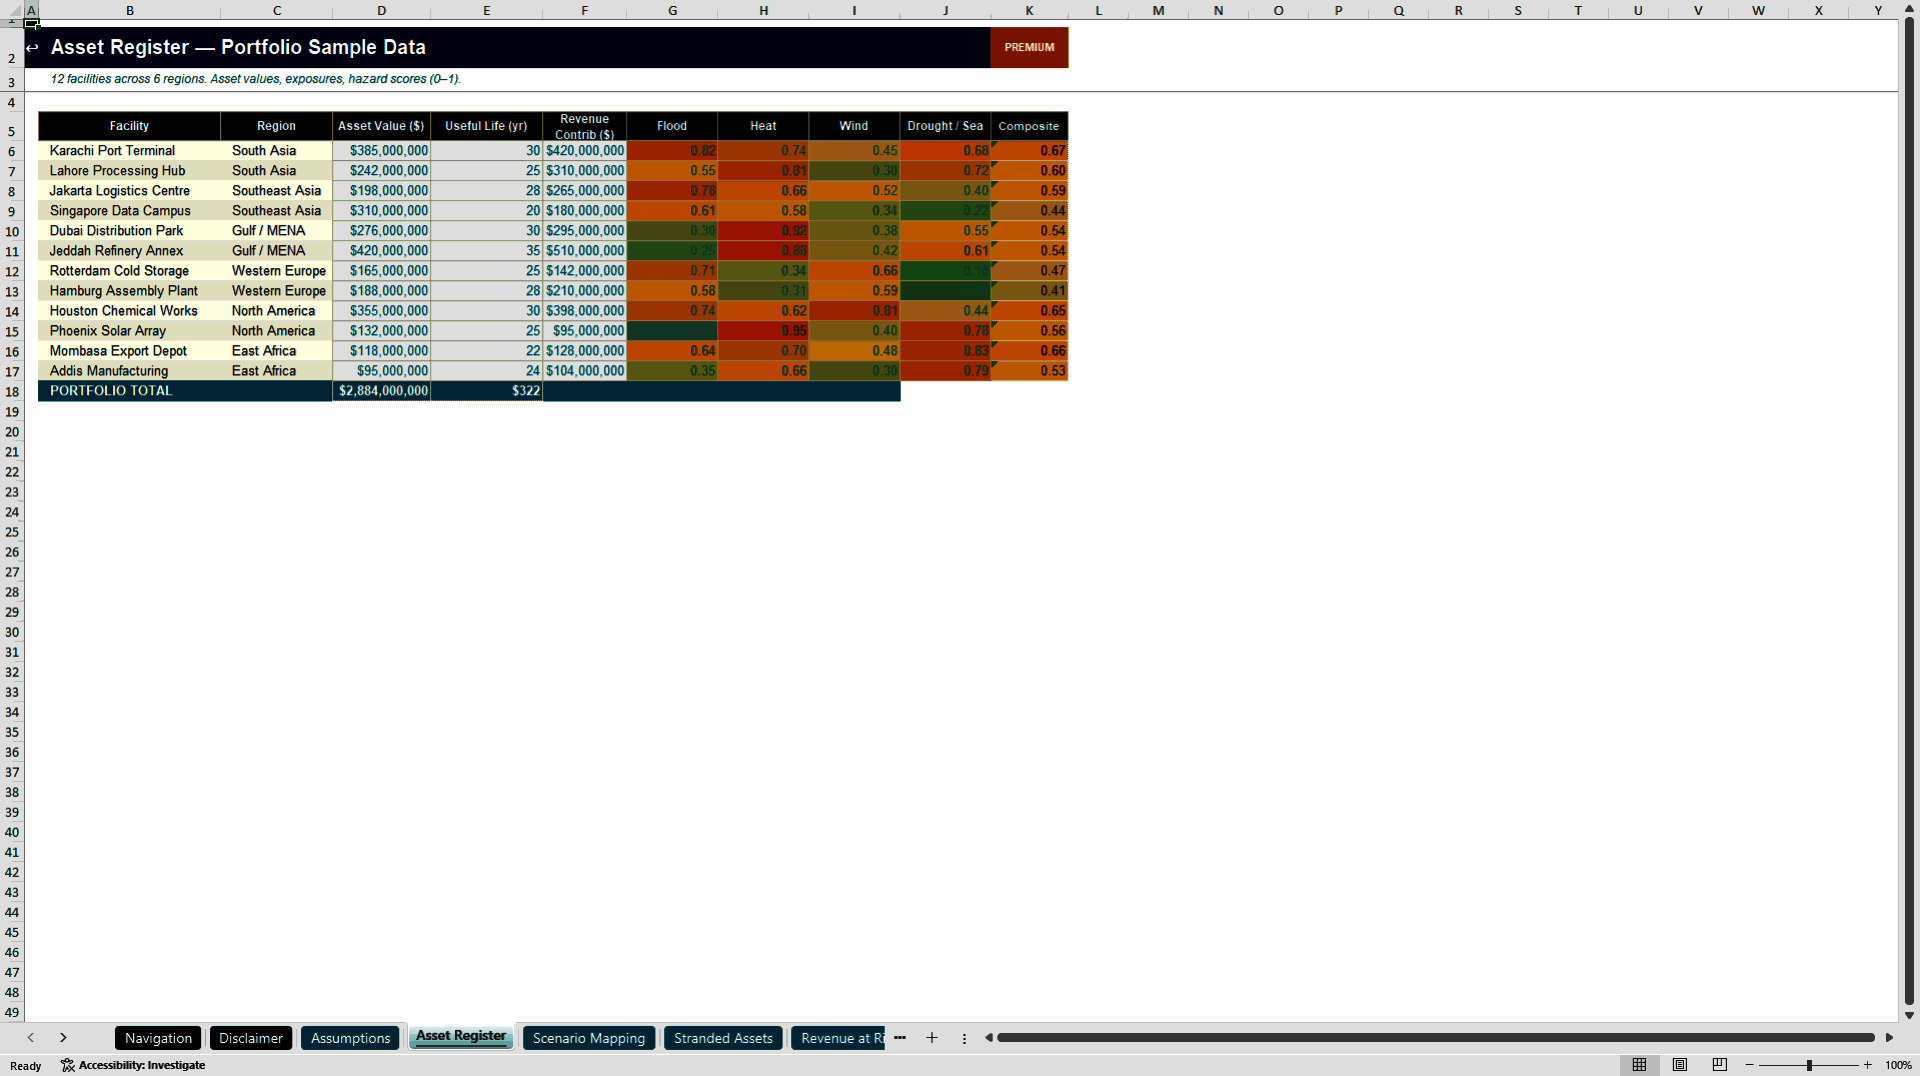
2. Asset Register and Facility-Level Risk View
The workbook includes an asset register where facilities can be evaluated by region, asset value, revenue contribution, emissions, hazard score, criticality, and adaptation priority.
This is important because climate risk is not only a company-level issue. Physical risk often depends on specific facility location, regional exposure, asset importance, and revenue concentration.
3. Stranded Asset Write-Down Schedule
The model includes a stranded asset module that calculates probability-weighted asset write-down exposure.
It helps users evaluate which assets may face impairment risk under the active climate scenario and how this risk may affect financial position.
This makes the model useful for impairment analysis, strategic asset review, investor risk review, and climate-adjusted balance sheet planning.
4. Revenue-at-Risk Scoring
The model includes revenue-at-risk calculations by facility and geography.
It evaluates how climate hazards may reduce or disrupt revenue generation based on facility exposure, regional risk, and active scenario assumptions.
This is valuable for companies with distributed operations, supply chains, manufacturing sites, real estate assets, infrastructure assets, or regionally exposed revenue streams.
5. Climate-Adjusted Insurance Cost Escalation
The insurance cost module models premium escalation under different climate pathways.
Users can see how insurance burden changes across years and scenarios, including excess premium burden versus baseline.
This is useful because insurance availability and cost are increasingly important in climate-exposed sectors and locations.
6. Carbon Repricing Sensitivity
The carbon sensitivity module evaluates the P&L effect of carbon repricing across a social cost of carbon range from $50 to $250 per tCO₂.
It calculates gross carbon cost, pass-through absorbed, net P&L impact after tax, and EBITDA margin erosion.
This helps users understand how carbon repricing assumptions may affect profitability and resilience.
7. Supply Chain Disruption Matrix
The model includes a probability × impact supply chain disruption matrix.
It evaluates disruption probability, financial impact if hit, expected loss, and severity by supply chain node.
This helps users assess climate-related disruption exposure across raw materials, components, energy supply, logistics, packaging, chemical feedstock, agricultural inputs, and water supply.
8. P&L and Balance Sheet Impact
The model includes dedicated sheets for:
📌 Climate-adjusted P&L impact
📌 Balance sheet impact
📌 Equity value at risk
📌 Asset impairment exposure
📌 Climate provisions
📌 EBITDA erosion
📌 Revenue at risk
📌 Insurance, carbon, and supply chain cost impact
This gives the buyer a clear financial translation layer rather than a purely qualitative ESG tool.
9. Adaptation CapEx and Avoided-Loss NPV
The model includes an adaptation CapEx module that compares resilience investment against avoided climate losses.
It calculates annual adaptation CapEx, avoided losses, net benefit, discount factor, present value of net benefit, and total adaptation program NPV.
This helps users evaluate whether climate adaptation investment is financially justified.
10. Executive Dashboard and Scenario Comparison
The model includes an executive climate risk dashboard and a scenario comparison dashboard.
The dashboards summarize:
📊 Active climate scenario
📊 Total asset value at risk
📊 Stranded asset exposure
📊 Total revenue at risk
📊 Insurance excess
📊 Supply chain expected loss
📊 Equity value at risk
📊 EBITDA erosion
📊 Climate-adjusted EBITDA
📊 Carbon cost impact
📊 Adaptation NPV
📊 Mean warming and stranding probability
11. ISSB / TCFD Disclosure Output
The workbook includes an ISSB IFRS S2 / TCFD disclosure output sheet structured around governance, strategy, risk management, metrics, and targets.
This gives users a practical starting point for converting the model's outputs into disclosure narratives and quantitative references.
🧭 How to Use This Model
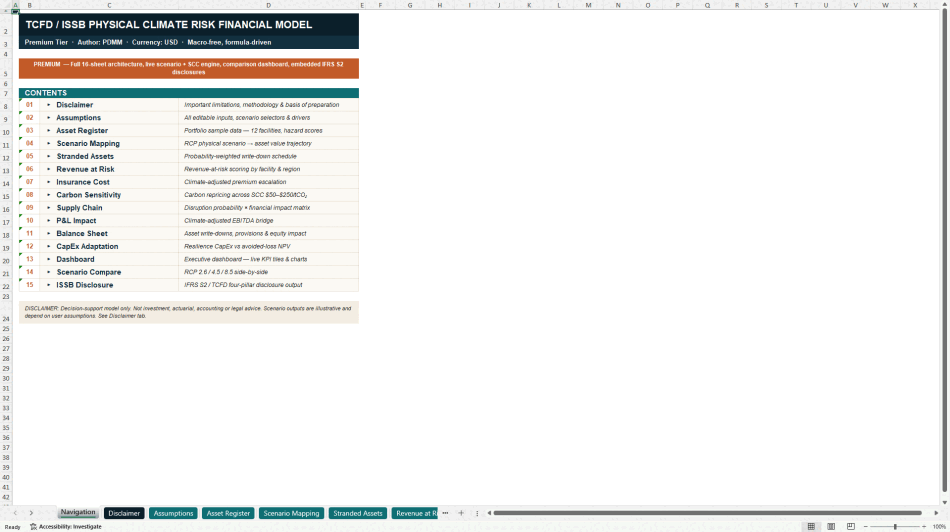
Start with the Navigation sheet to understand the workbook structure.
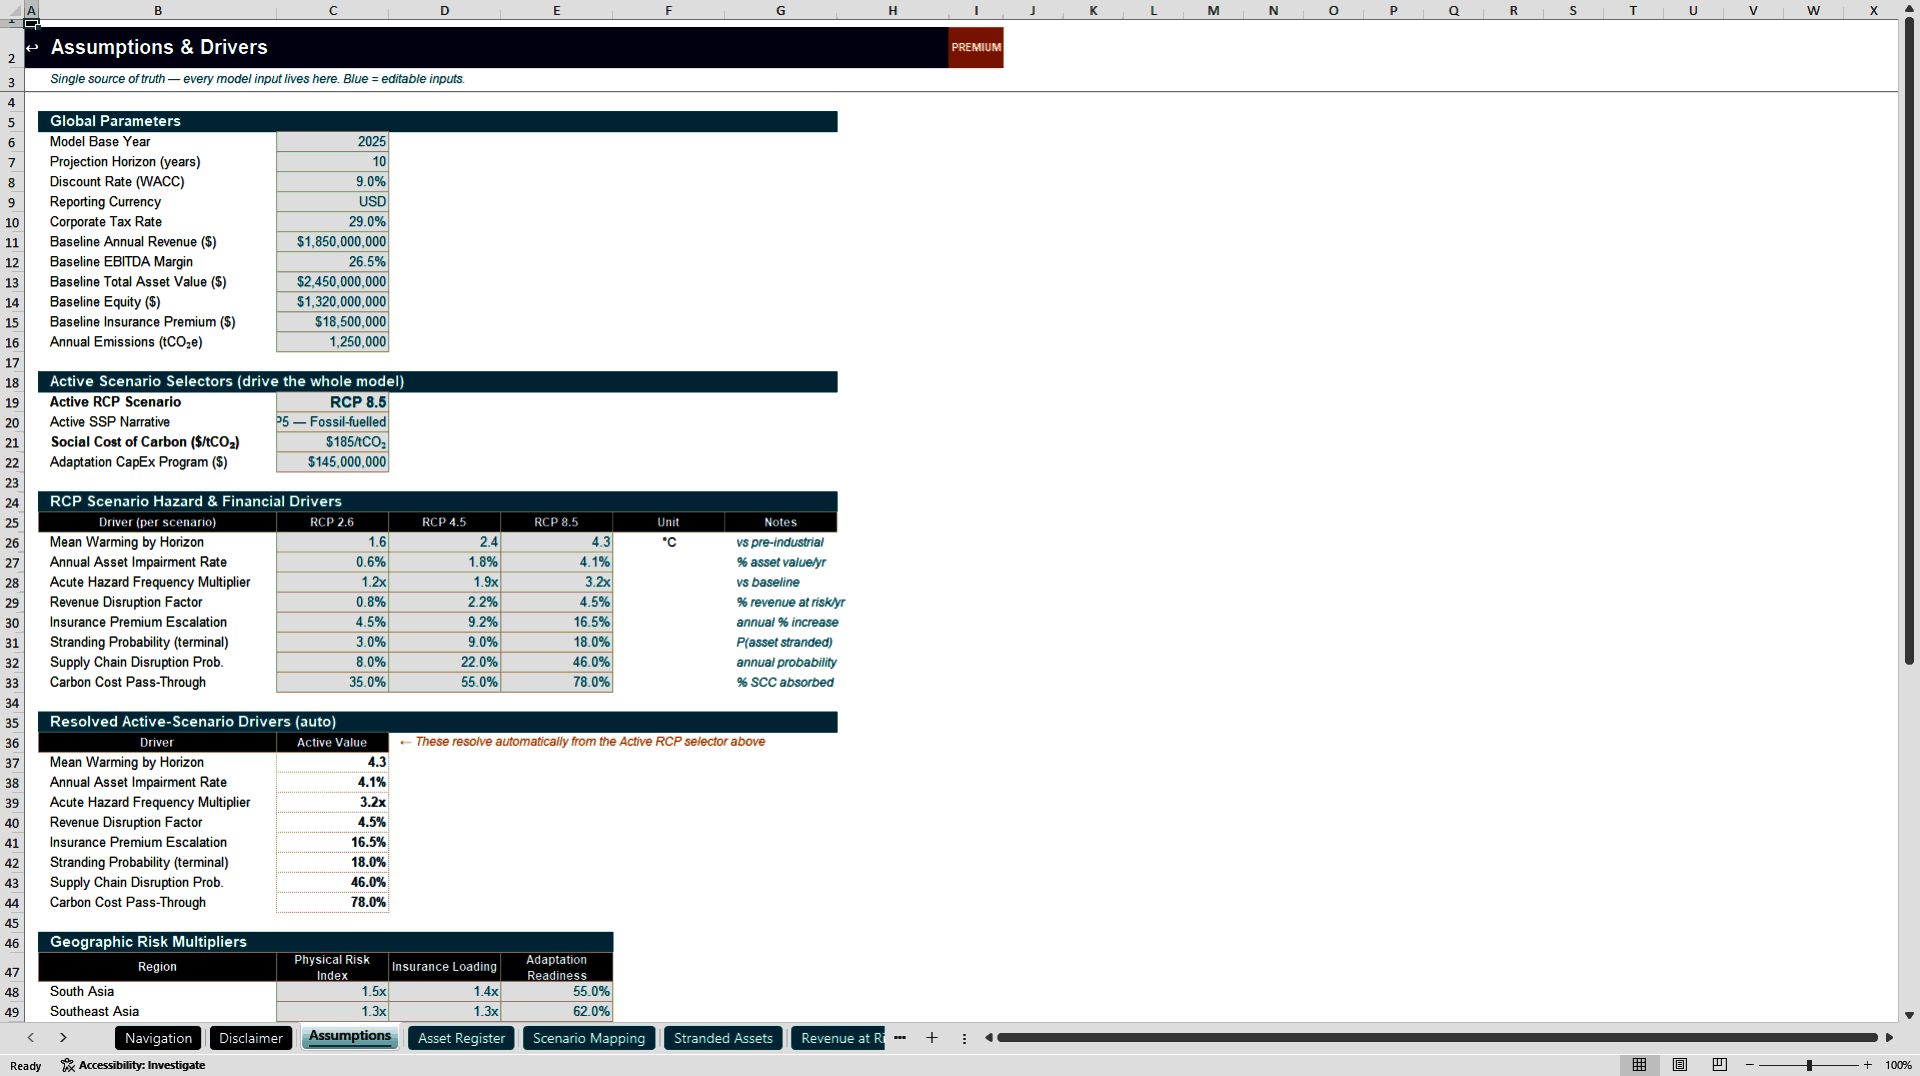
Then move to the Assumptions sheet to select the active RCP scenario, carbon price, baseline revenue, EBITDA margin, tax rate, discount rate, insurance assumptions, adaptation assumptions, and other core model drivers.
Next, review and update the Asset Register to reflect the company's actual facilities, regions, asset values, revenue contribution, emissions, hazard scores, and adaptation priority.
After that, the model flows into the scenario mapping, stranded asset, revenue-at-risk, insurance cost, carbon sensitivity, supply chain, P&L impact, balance sheet impact, CapEx adaptation, dashboard, scenario comparison, and disclosure sheets.
The buyer can use the dashboard outputs for internal review, investor presentations, ESG reporting preparation, climate risk workshops, and strategic finance discussions.
🎯 Who Should Buy This Model?
This model is suitable for:
✅ CFO offices
✅ Corporate finance teams
✅ ESG and sustainability teams
✅ Risk management teams
✅ Climate risk consultants
✅ Infrastructure investors
✅ Corporate strategy teams
✅ Energy transition analysts
✅ Manufacturing and industrial companies
✅ Asset-heavy companies
✅ Real estate and infrastructure operators
✅ Investment analysts and advisors
✅ Professionals preparing TCFD / ISSB-style climate disclosures
💡 Why You Need This Model
Climate risk reporting becomes much more useful when it is connected to financial impact.
This model helps users move beyond generic ESG language and quantify how physical climate risk may affect assets, revenue, insurance costs, supply chain stability, EBITDA, balance sheet exposure, adaptation investment, and disclosure outputs.
It is designed to support decision-making, not just reporting.
Got a question about the product? Email us at support@flevy.com or ask the author directly by using the "Ask the Author a Question" form. If you cannot view the preview above this document description, go here to view the large preview instead.
Source: Best Practices in ESG, Integrated Financial Model Excel: TCFD / ISSB Physical Climate Risk Model Excel (XLSX) Spreadsheet, PDMM Financial Models
ABOUT THE AUTHOR

PDMM Financial Models develops professional, decision-ready Excel models for business owners, entrepreneurs, investors, consultants, analysts, and finance teams. Our objective is to transform complex business assumptions into clear, structured analysis that supports better planning and investment decisions.
Our models cover business planning, forecasting, budgeting, feasibility analysis,
... [read more]
Ask the Author a Question
You must be logged in to contact the author.




























