
STRATEGIC ANALYSIS PPT TEMPLATE DESCRIPTION
This deck is a strategy training deck prepared by a top-tier consulting firm. The contents include: General analytical techniques, Supply side analysis, Demand side analysis. This deck can give flavor of expected analyses, show which analyses have been most productive historically and explain basic techniques and warn of common methodological errors
It is an ideal reference document for MBA students, corporate managers, business/financial analysts and management consultants.
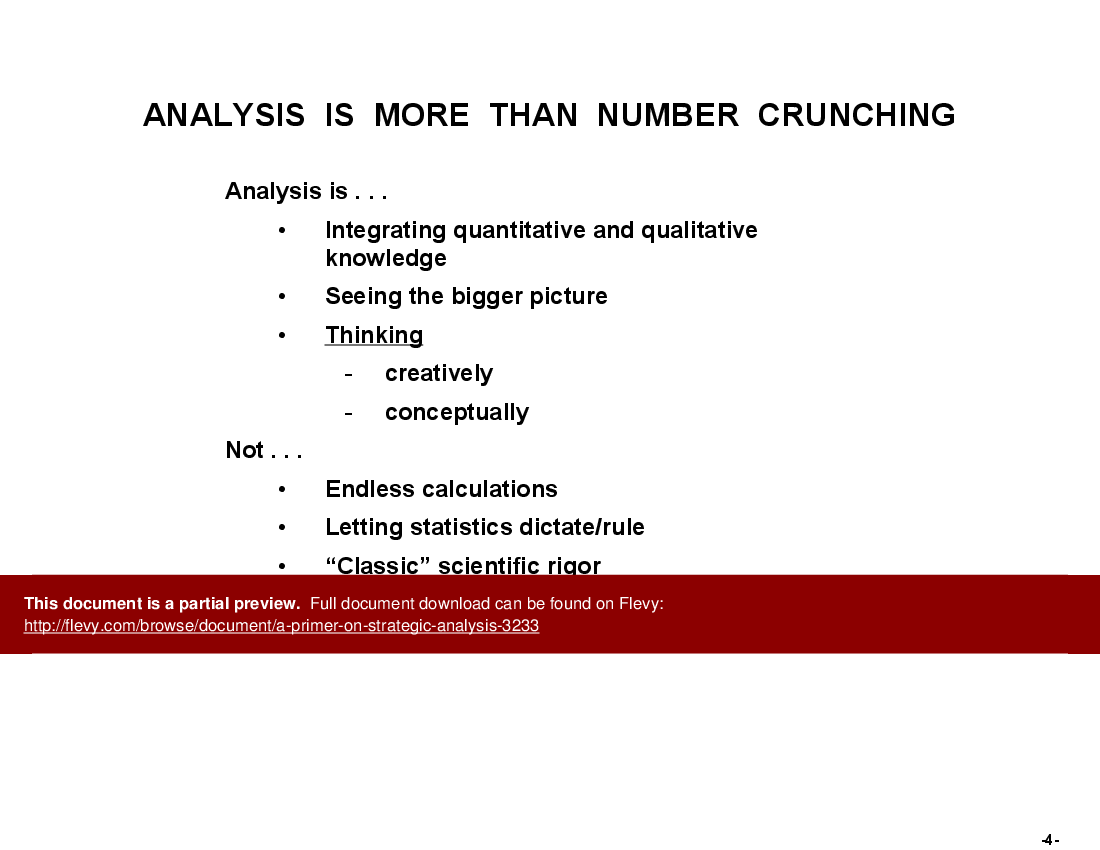
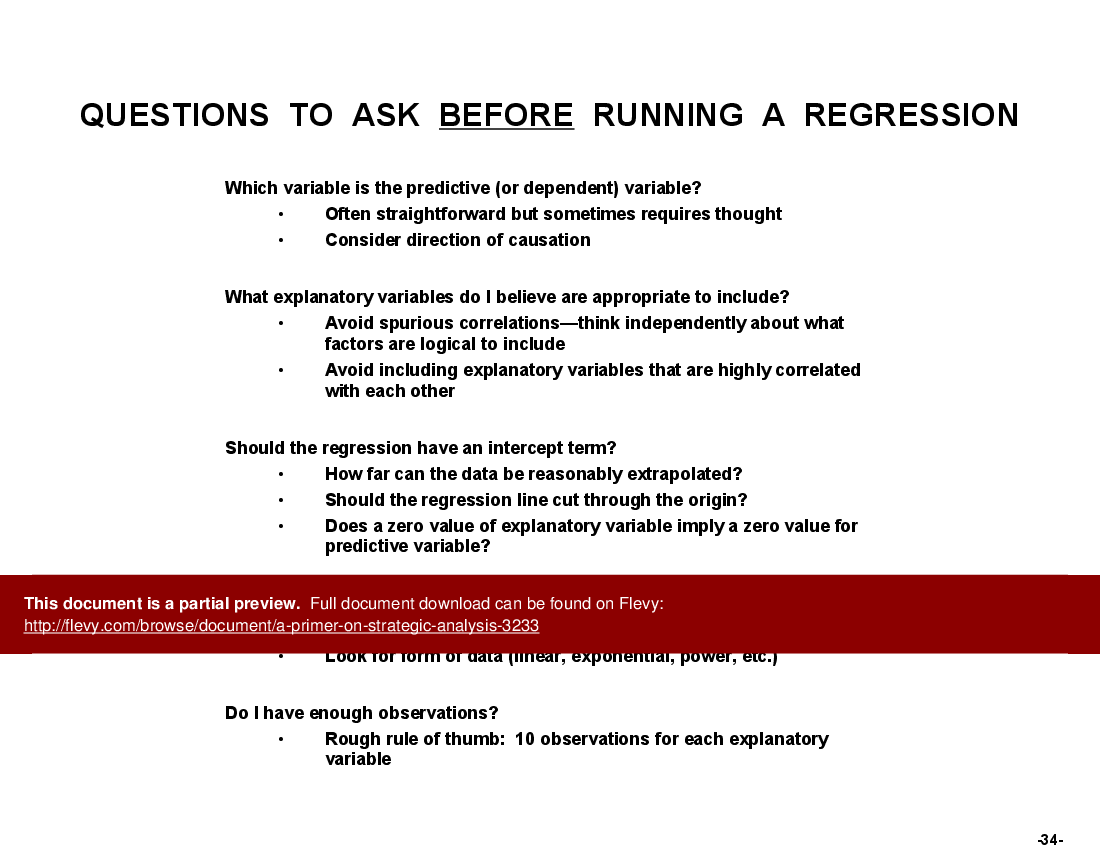
This Strategic Analysis Primer goes beyond traditional number-crunching. It emphasizes integrating both quantitative and qualitative insights, encouraging creative and conceptual thinking. This approach helps you see the bigger picture and avoid common pitfalls like endless calculations and over-reliance on statistics. The primer is designed to enhance your analytical skills by providing a comprehensive understanding of various analytical techniques.
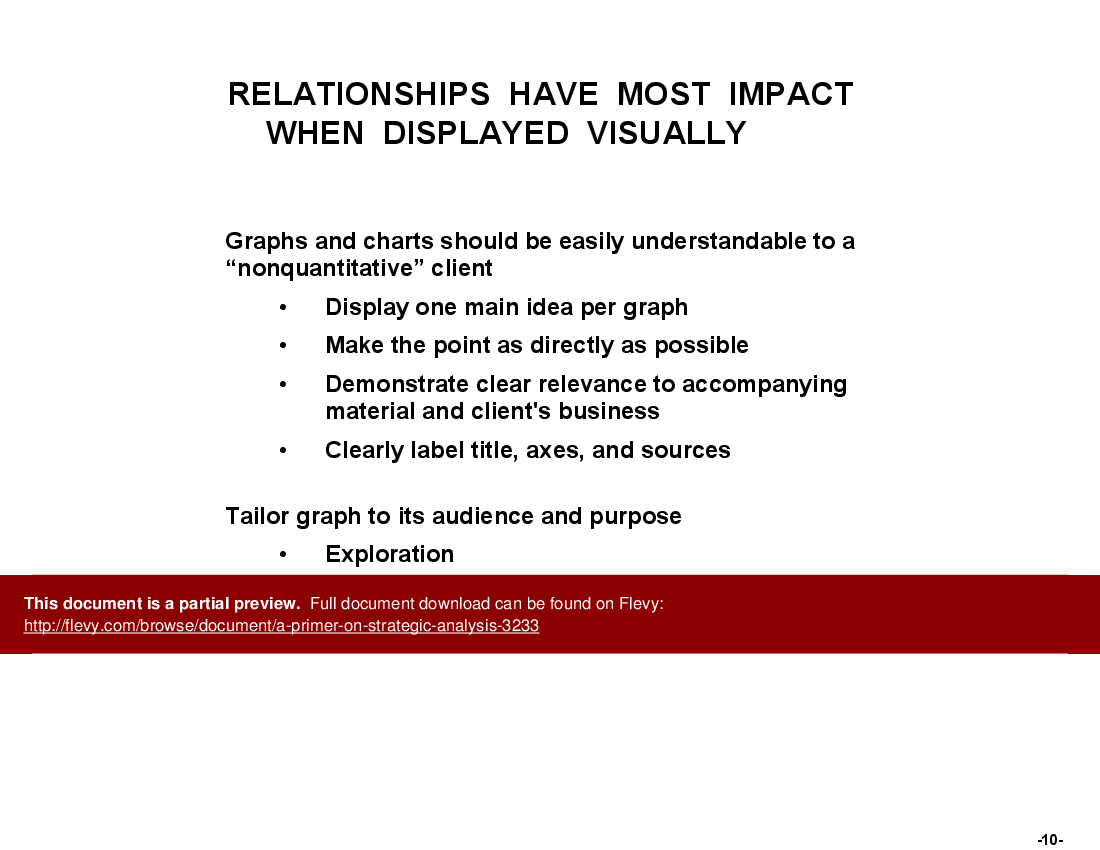
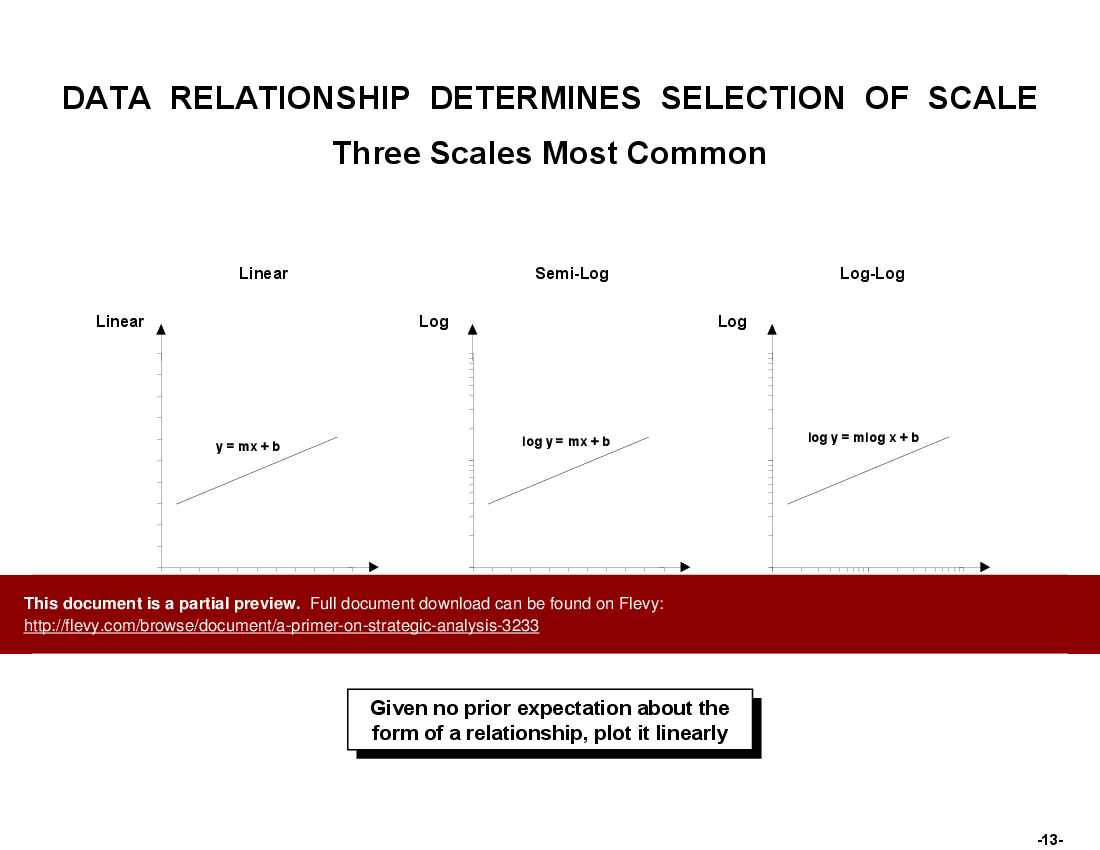
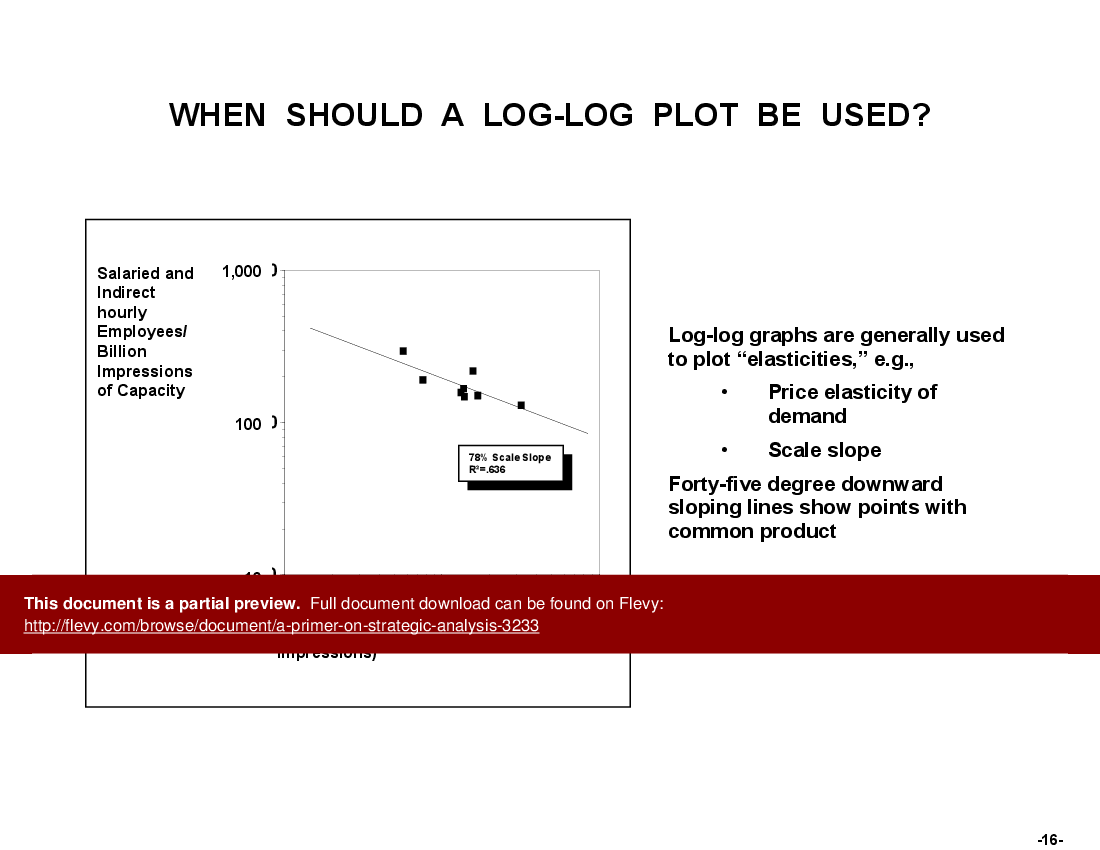
The document also delves into the importance of visual representation in analysis. Graphs and charts should be tailored to the audience, ensuring they are easily understandable and directly relevant to the client's business. This ensures that the data presented is not just informative, but also impactful. The primer guides you on how to effectively use different types of scales, such as linear, semi-log, and log-log, to best represent data relationships.
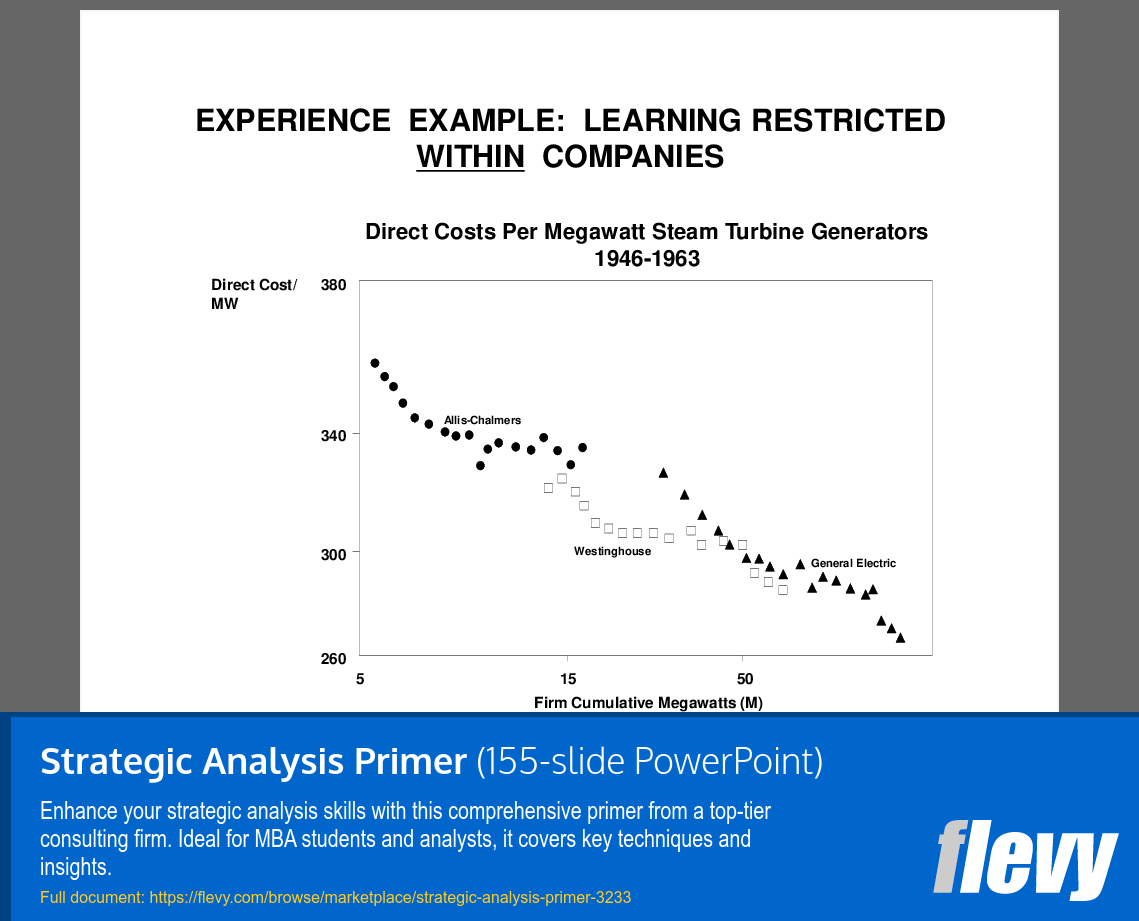
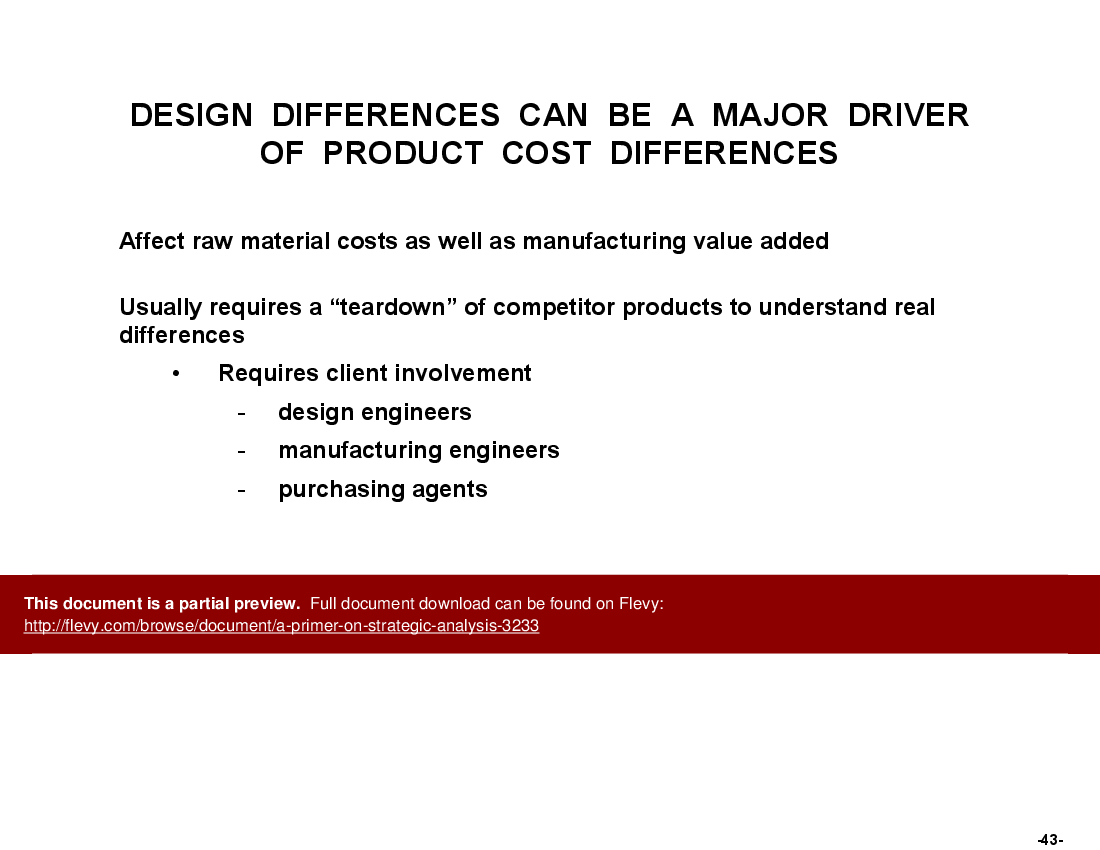
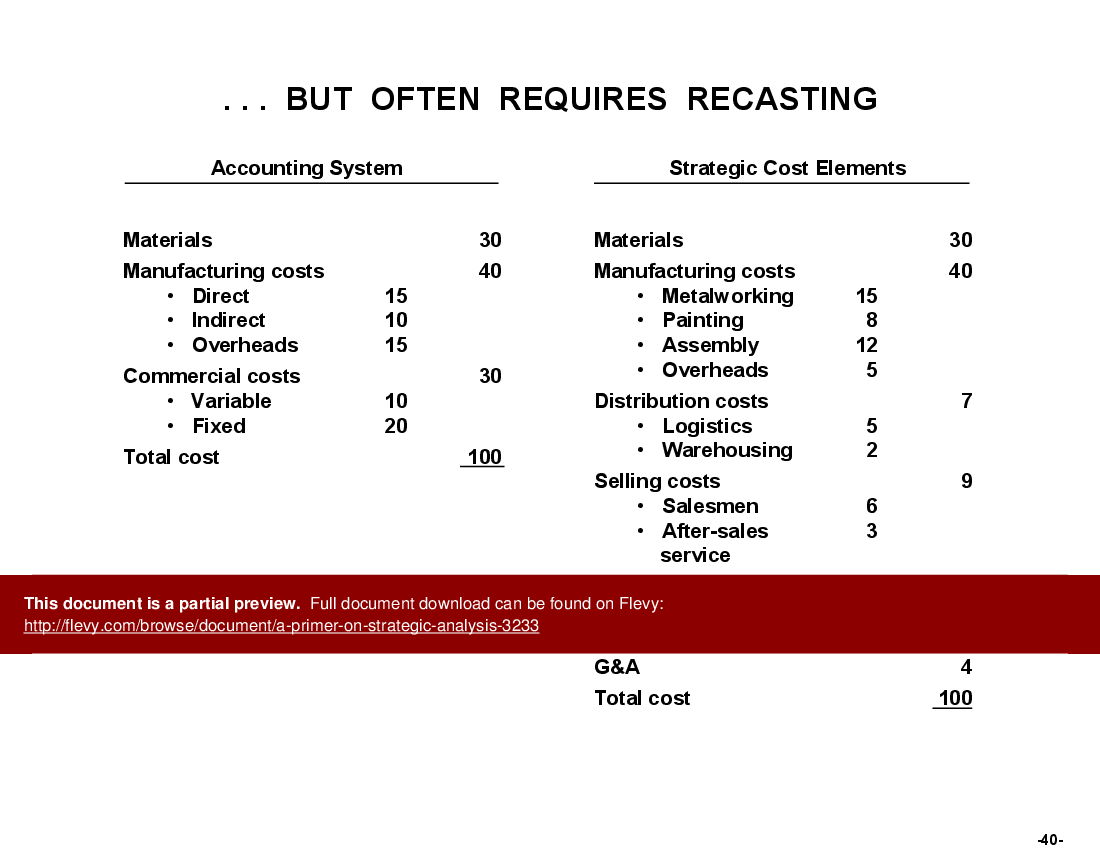
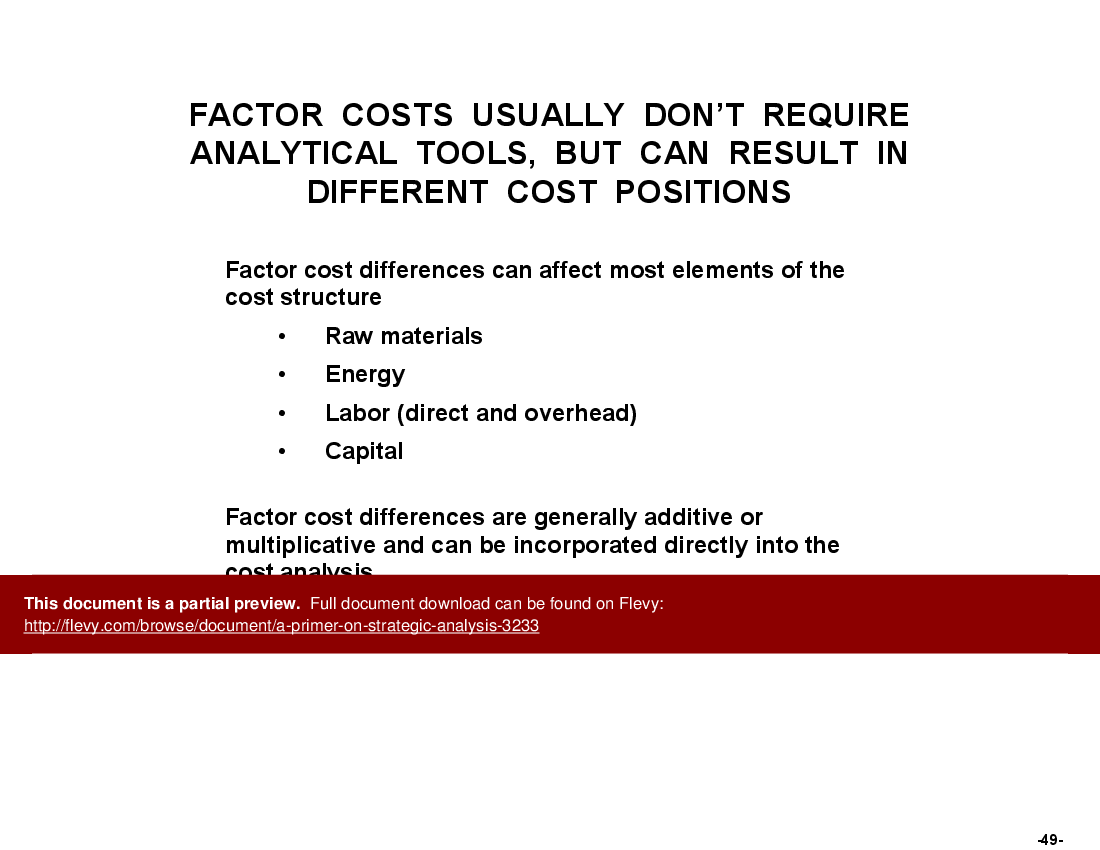
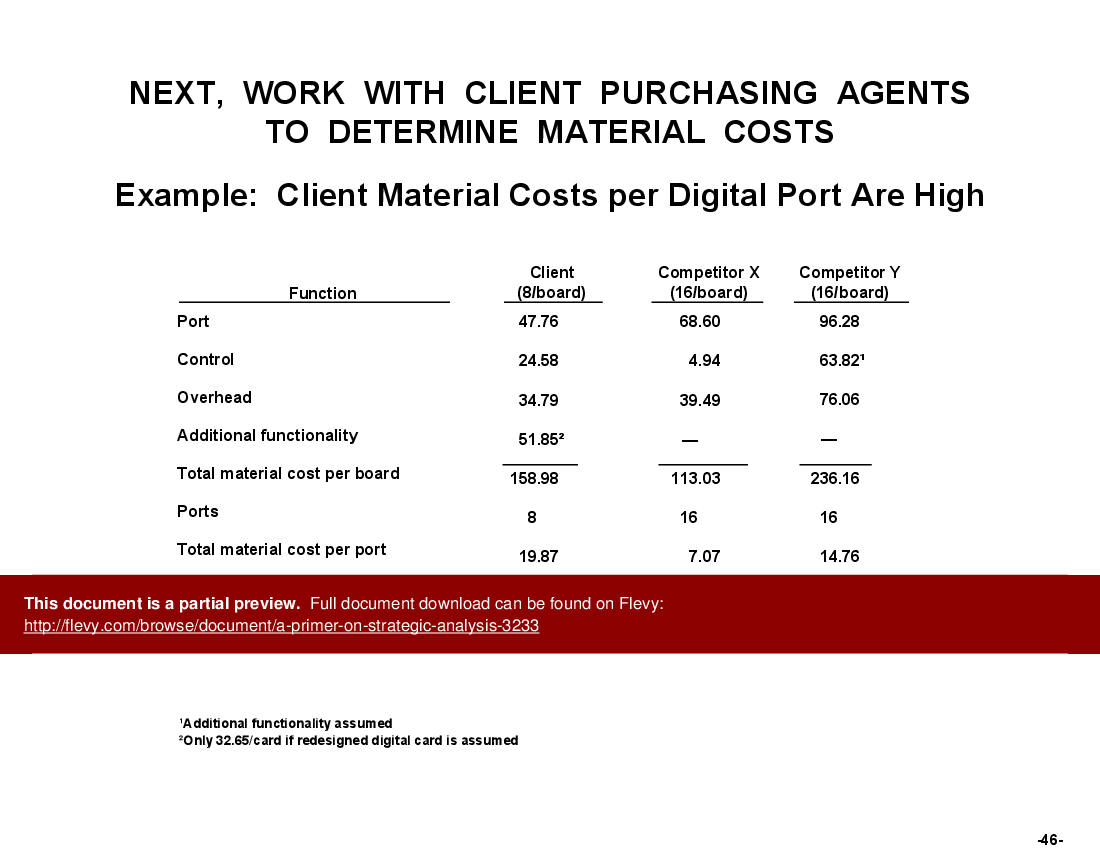
Moreover, the primer covers the nuances of cost analysis, highlighting the significance of understanding cost structures, design differences, and factor costs. It explains how scale, experience, complexity, and utilization affect costs and provides practical examples to illustrate these concepts. This section is particularly useful for those involved in competitive cost analysis and strategic decision-making.
The primer addresses the importance of understanding customer needs through segmentation and conjoint analysis. It provides a framework for identifying the most attractive customer segments and developing targeted action plans. This customer-focused approach ensures that your strategies are aligned with market demands, ultimately driving growth and profitability.
Got a question about the product? Email us at support@flevy.com or ask the author directly by using the "Ask the Author a Question" form. If you cannot view the preview above this document description, go here to view the large preview instead.
PRESENTATION DEEP DIVE ANALYSIS
This deep-dive analysis was generated from the full 155-slide PowerPoint presentation.
STRATEGIC ANALYSIS PPT TEMPLATES
Source: Best Practices in Strategic Analysis PowerPoint Slides: Strategic Analysis Primer PowerPoint (PPT) Presentation Slide Deck, Documents & Files
