The Six Sigma Confidence Interval Analysis (CIA) Training Module includes:
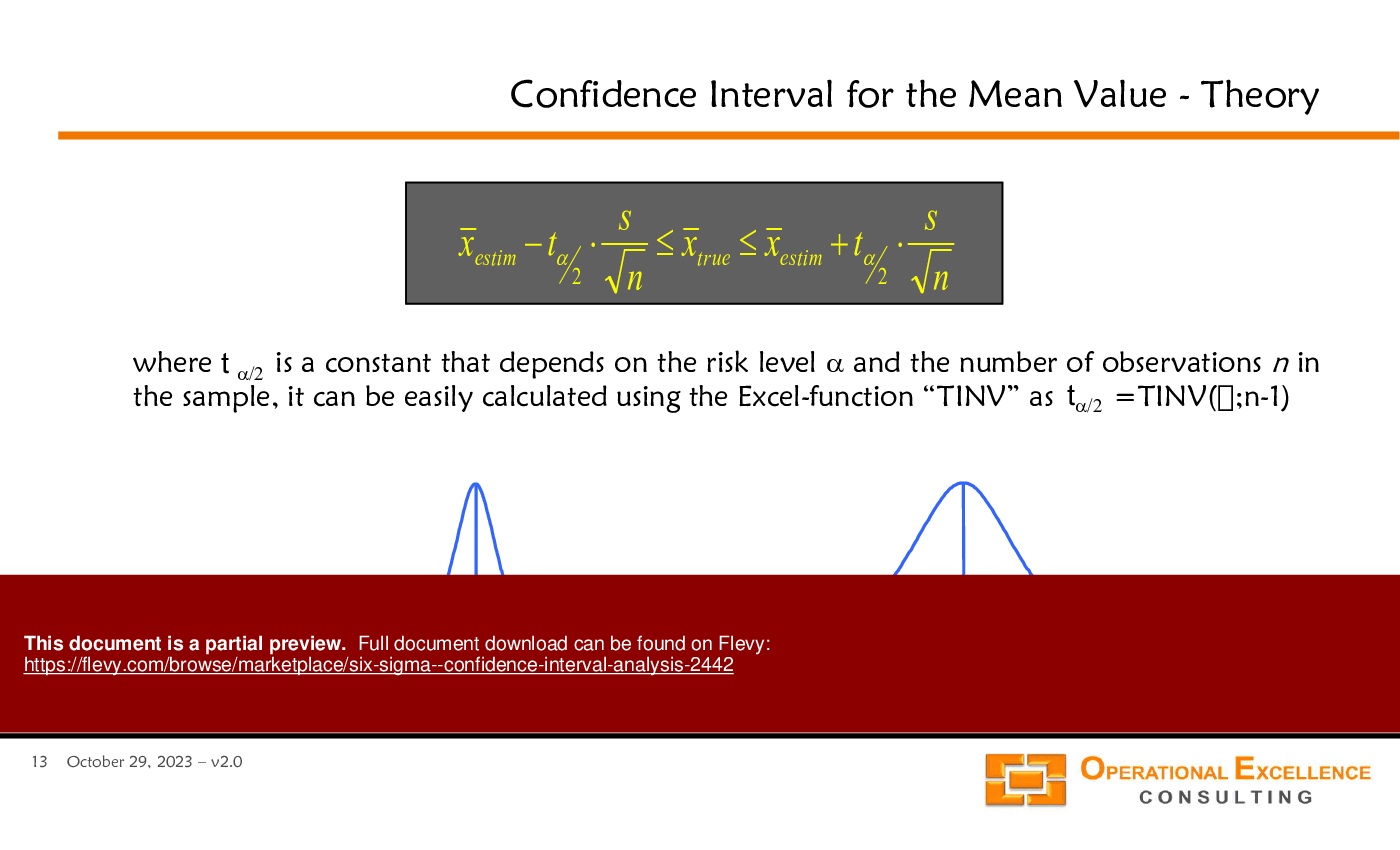
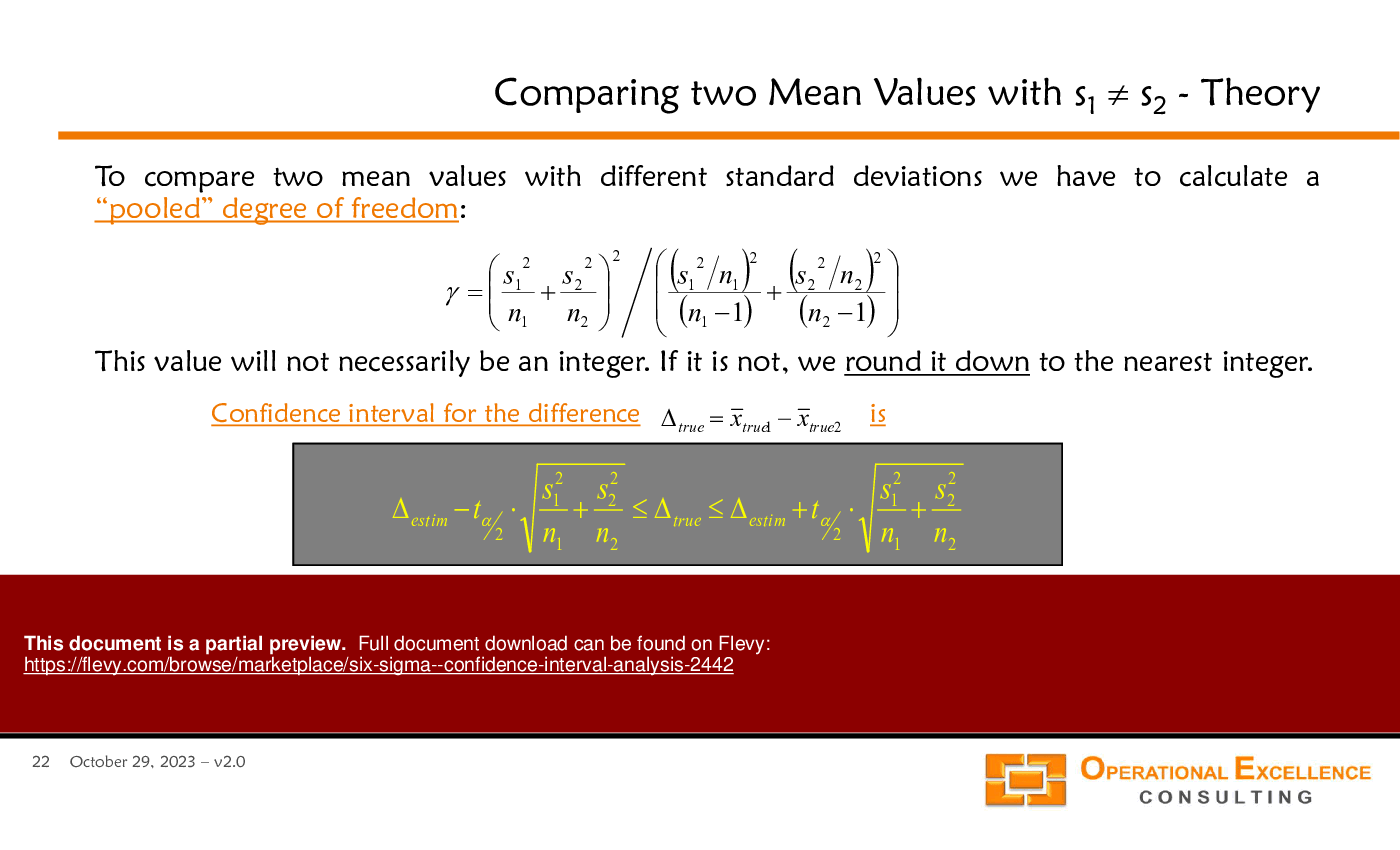
1. MS PowerPoint Presentation including 72 slides covering theory and examples of Confidence Interval Analysis and Hypothesis Testing for CIA for one Mean Value, Comparison of two Mean Values, Comparison of a Paired Data Sets, CIA for one Standard Deviation, Comparison of two Standard Deviations, CIA for Capability Indices, CIA for one Defect Rate, Comparison of two Defect Rates, CIA for one Count, and Comparison of two Counts.
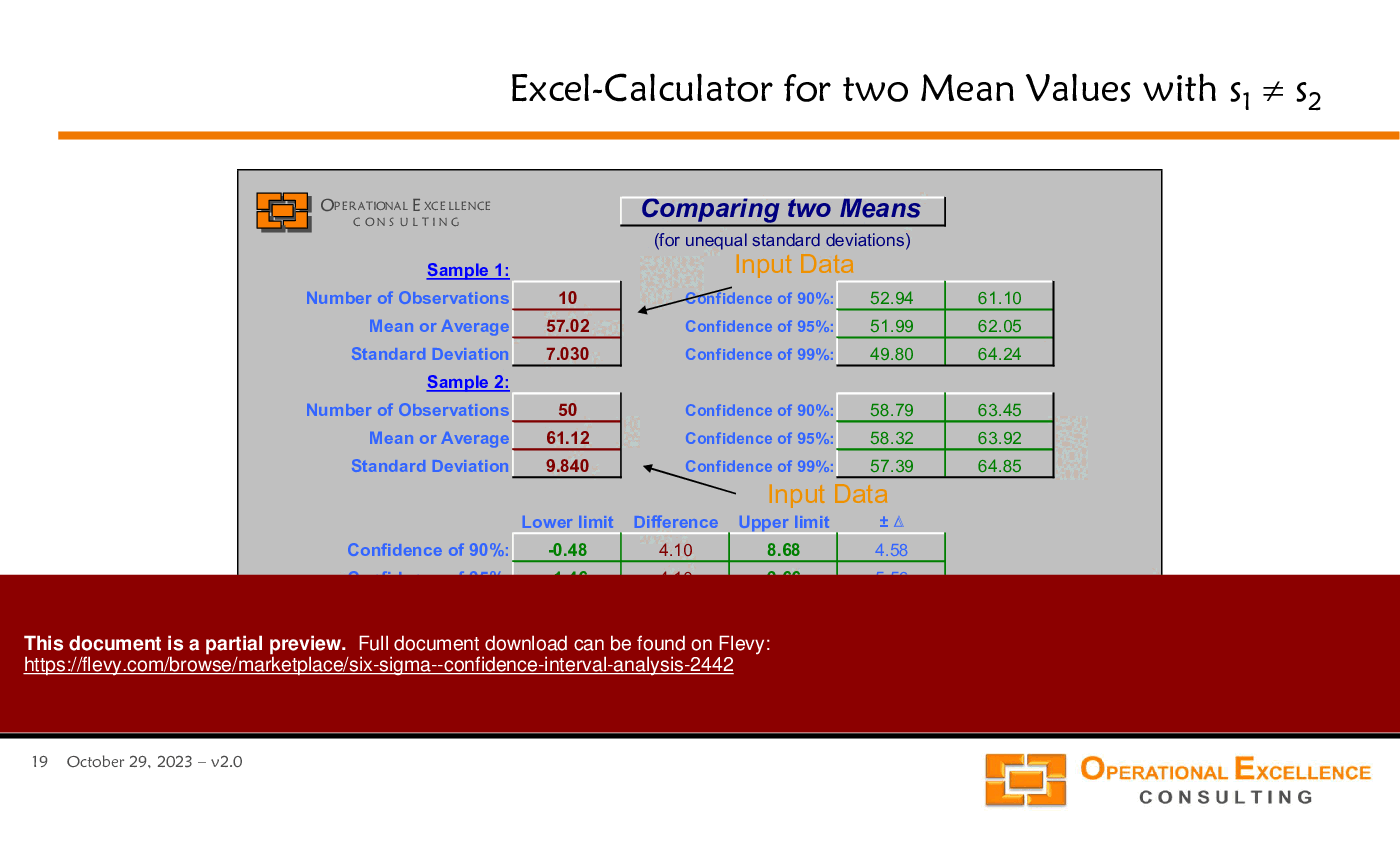
2. MS Excel Six Sigma Confidence Interval Analysis Calculator making it really easy to calculate Confidence Intervals (mean value, standard deviation, capability indices, defect rate, count) and perform a Comparison of two Statistics (mean values, standard deviations, defect rates, counts).
"After you have downloaded the training material, you can change any part of the training material and remove all logos and references to Operational Excellence Consulting. You can share the material with your colleagues and clients, and re-use it as you need. The only restriction is that you cannot publicly re-distribute, sell, rent or license the material as though it is your own. Thank you."
Got a question about the product? Email us at support@flevy.com or ask the author directly by using the "Ask the Author a Question" form. If you cannot view the preview above this document description, go here to view the large preview instead.
Executive Summary
The "Six Sigma - Confidence Interval Analysis" presentation is a comprehensive resource developed by Operational Excellence Consulting LLC. This deck, crafted by a Senior Executive and Operational Excellence Coach, delves into the intricacies of confidence interval analysis within the Six Sigma framework. It equips users with the tools necessary for effective data-based decision-making, emphasizing the importance of understanding uncertainty in data. The presentation includes an Excel application for practical calculations, allowing users to apply hypothesis testing, mean comparisons, and defect rate assessments in their operational contexts.
Who This Is For and When to Use
• Quality Assurance Managers focused on process improvement and data analysis
• Operational Excellence Teams implementing Six Sigma methodologies
• Data Analysts tasked with interpreting statistical data
• Project Managers overseeing quality control initiatives
• Executives aiming to enhance decision-making through data insights
Best-fit moments to use this deck:
• During training sessions on statistical analysis and Six Sigma principles
• When introducing new quality control measures or processes
• In workshops aimed at improving data interpretation skills
• For presentations on operational performance metrics and analysis
Learning Objectives
• Define confidence intervals and their significance in data analysis
• Build confidence intervals for means and standard deviations using sample data
• Establish methods for comparing means and defect rates across processes
• Interpret confidence intervals to make informed operational decisions
• Utilize Excel tools for calculating confidence intervals and analyzing data
• Recognize the assumptions underlying confidence interval analysis
Table of Contents
• Introduction to Confidence Interval Analysis (page 4)
• Definition of a Confidence Interval (page 5)
• Assumptions for Confidence Interval Analysis (page 6)
• Confidence Interval for a Mean Value (page 8)
• Confidence Interval for a Standard Deviation (page 28)
• Comparing Two Mean Values (page 14)
• Comparing Two Standard Deviations (page 33)
• Confidence Interval for Defect Rates (page 51)
• Comparing Two Defect Rates (page 58)
• Confidence Interval for Counts (page 63)
Primary Topics Covered
• Confidence Interval Analysis - A method for estimating the range within which a population parameter lies, based on sample data.
• Data-Based Decision Making - A structured approach to making informed decisions using collected and analyzed data.
• Hypothesis Testing - Techniques for determining if there is a statistically significant difference between sample means or defect rates.
• Excel Calculators - Tools provided for calculating confidence intervals for means, standard deviations, and defect rates.
• Assumptions of Analysis - Key assumptions including control, randomness, and normality that underpin confidence interval calculations.
• Comparative Analysis - Methods for comparing means and standard deviations across different processes to assess performance improvements.
Deliverables, Templates, and Tools
• Excel calculator for estimating confidence intervals for means
• Excel calculator for standard deviation analysis
• Templates for comparing defect rates between processes
• Worksheets for paired data analysis
• Guides for interpreting confidence intervals in operational contexts
• Sample data sets for practical exercises in confidence interval calculations
Slide Highlights
• Visual representation of confidence intervals for means and standard deviations
• Step-by-step guides on using Excel for statistical calculations
• Case studies demonstrating the application of confidence interval analysis
• Graphical comparisons of defect rates across different processes
• Summary of key assumptions necessary for accurate analysis
Potential Workshop Agenda
Introduction to Confidence Intervals (60 minutes)
• Overview of confidence intervals and their significance
• Discussion of key assumptions and their implications
Hands-On Excel Session (90 minutes)
• Practical exercises using Excel calculators for means and standard deviations
• Group activities comparing defect rates using sample data
Case Study Analysis (60 minutes)
• Review of real-world applications of confidence interval analysis
• Group discussions on findings and implications for operational excellence
Customization Guidance
• Tailor the Excel calculators to reflect specific operational metrics relevant to your organization
• Adjust case study examples to align with industry-specific scenarios
• Incorporate company-specific terminology and processes into the presentation materials
Secondary Topics Covered
• Statistical significance in hypothesis testing
• The impact of sample size on confidence interval width
• Techniques for visualizing data distributions
• Understanding the relationship between confidence intervals and process capability
FAQ
What is a confidence interval?
A confidence interval is a range of values derived from sample data that is likely to contain the true population parameter with a specified level of confidence.
Why is it important to understand confidence intervals?
Understanding confidence intervals helps in assessing the reliability of sample estimates and making informed decisions based on data analysis.
How can I calculate confidence intervals using Excel?
Excel provides functions such as TINV and CHIINV to calculate confidence intervals for means and standard deviations based on sample data.
What assumptions must be met for confidence interval analysis?
Key assumptions include control of the process, randomness of the sample, and normality of the data distribution.
Can confidence intervals be used for defect rates?
Yes, confidence intervals can be applied to defect rates to assess the likelihood that the true defect rate falls within a specified range.
How do I interpret a confidence interval?
A confidence interval provides a range within which the true parameter is expected to lie, allowing for risk assessment in decision-making.
What is the significance of comparing 2 means?
Comparing 2 means helps determine if there is a statistically significant difference between 2 processes or groups, aiding in performance evaluation.
How can I apply this analysis in my organization?
Utilize the tools and methodologies outlined in the presentation to enhance data-driven decision-making and improve operational processes.
Glossary
• Confidence Interval - A range of values that likely contains the true population parameter.
• Hypothesis Testing - A statistical method for testing assumptions about a population parameter.
• Standard Deviation - A measure of the dispersion of a set of values.
• Excel Calculator - A tool for performing statistical calculations in Excel.
• Defect Rate - The proportion of defective items in a production process.
• Paired Data - Data collected from 2 related groups or conditions.
• Random Sample - A sample that fairly represents a population, ensuring each member has an equal chance of selection.
• Normal Distribution - A probability distribution that is symmetric about the mean, showing that data near the mean are more frequent in occurrence.
• Process Capability - The ability of a process to produce output within specification limits.
• Statistical Significance - A determination that an observed effect in data is unlikely to have occurred by chance.
• Assumptions - Conditions that must be met for statistical analysis to be valid.
• Data-Based Decision Making - The process of making decisions based on data analysis rather than intuition or observation.
Source: Six Sigma - Confidence Interval Analysis PowerPoint (PPTX) Presentation Slide Deck, Operational Excellence Consulting LLC
This document is available as part of the following discounted bundle(s):
Save %!
OPERATIONAL EXCELLENCE Training Module Library
This bundle contains 18 total documents. See all the documents to the right.
Save %!
SIX SIGMA METHODOLOGY Training Module Library
This bundle contains 7 total documents. See all the documents to the right.
|
Download our FREE Strategy & Transformation Framework Templates
Download our free compilation of 50+ Strategy & Transformation slides and templates. Frameworks include McKinsey 7-S, Balanced Scorecard, Disruptive Innovation, BCG Curve, and many more. |