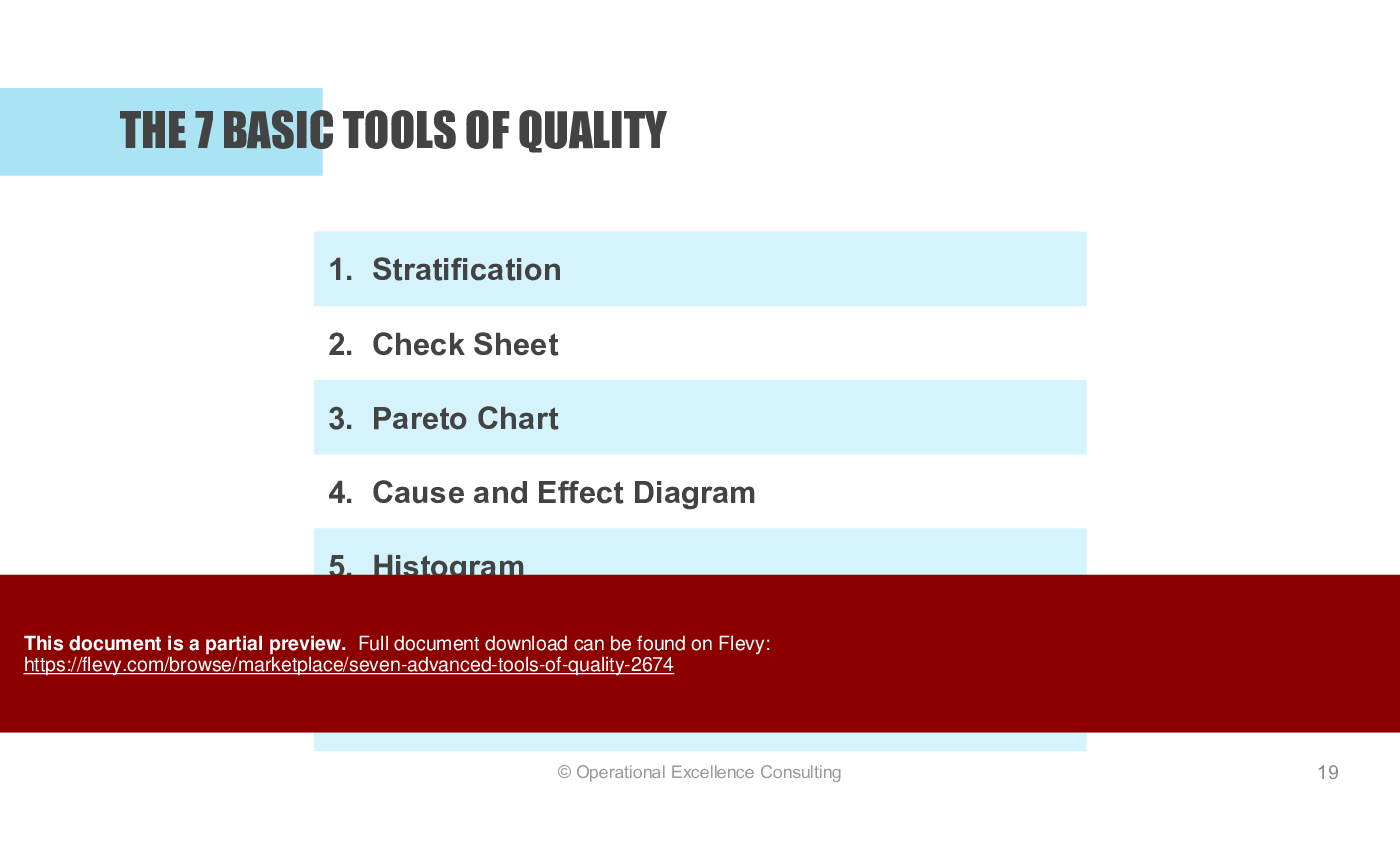
The 7 Advanced QC Tools are effective for data analysis, process control, and quality improvement (numerical data). However, these basic tools cannot be used for non-numerical or verbal data. To organize verbal data into useful information, you would require the advanced quality tools.
The 7 Advanced QC Tools (a.k.a Seven New Tools or Seven Management & Planning Tools) were developed with a design approach to organize verbal data diagramatically. These tools work in conjunction with the basic quality tools and can be used by management and staff to develop ideas, solve problems and formulate plans for improved project management.
The Seven Advanced Tools are:
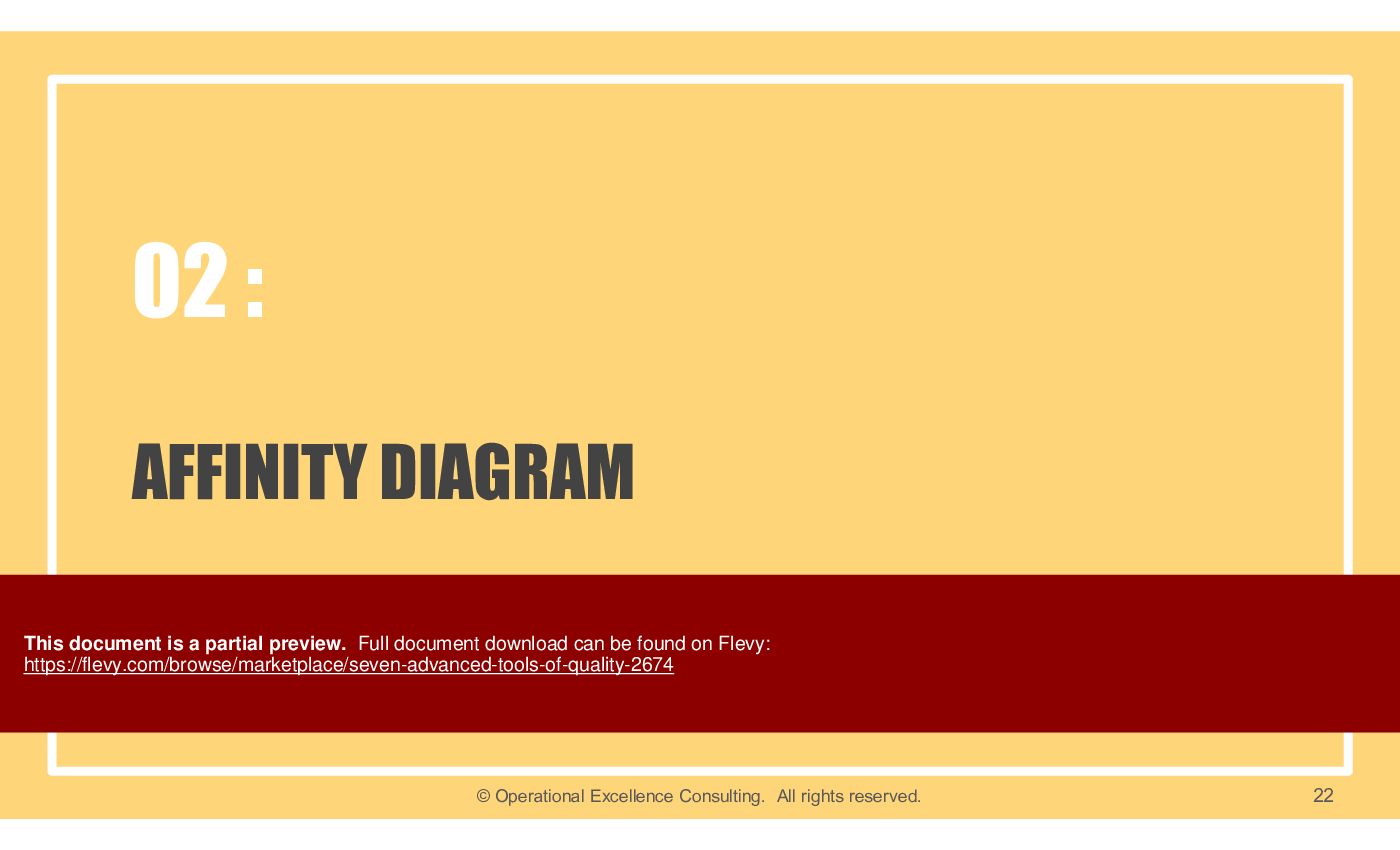
1) Affinity Diagram: Organizes a large number of ideas into their natural relationships.
2) Relations Diagram: Shows cause-and-effect relationships and helps analyze the natural links between different aspects of a complex situation.
3) Tree Diagram: Breaks down broad categories into finer and finer levels of detail, helping to move step-by-step thinking from generalities to specifics.
4) Matrix Diagram: Shows the relationship between two, three, or four groups of information and can give information about the relationship, such as its strength, the roles played by various individuals, or measurements.
5) Matrix Data Analysis Chart: A complex mathematical technique for analyzing matrices, often replaced by the similar prioritization matrix. A prioritization matrix is an L-shaped matrix that uses pairwise comparisons of a list of options to a set of criteria in order to choose the best option(s).
6) Arrow Diagram: Shows the required order of tasks in a project or process, the best schedule for the entire project, and potential scheduling and resource problems and their solutions.
7) Process Decision Program Chart: Systematically identifies what might go wrong in a plan under development.
LEARNING OBJECTIVES
1. Acquire knowledge on the seven advanced quality tools for project planning and management.
2. Learn how to apply the seven management and planning tools to problem solving, projects, communication and daily management work.
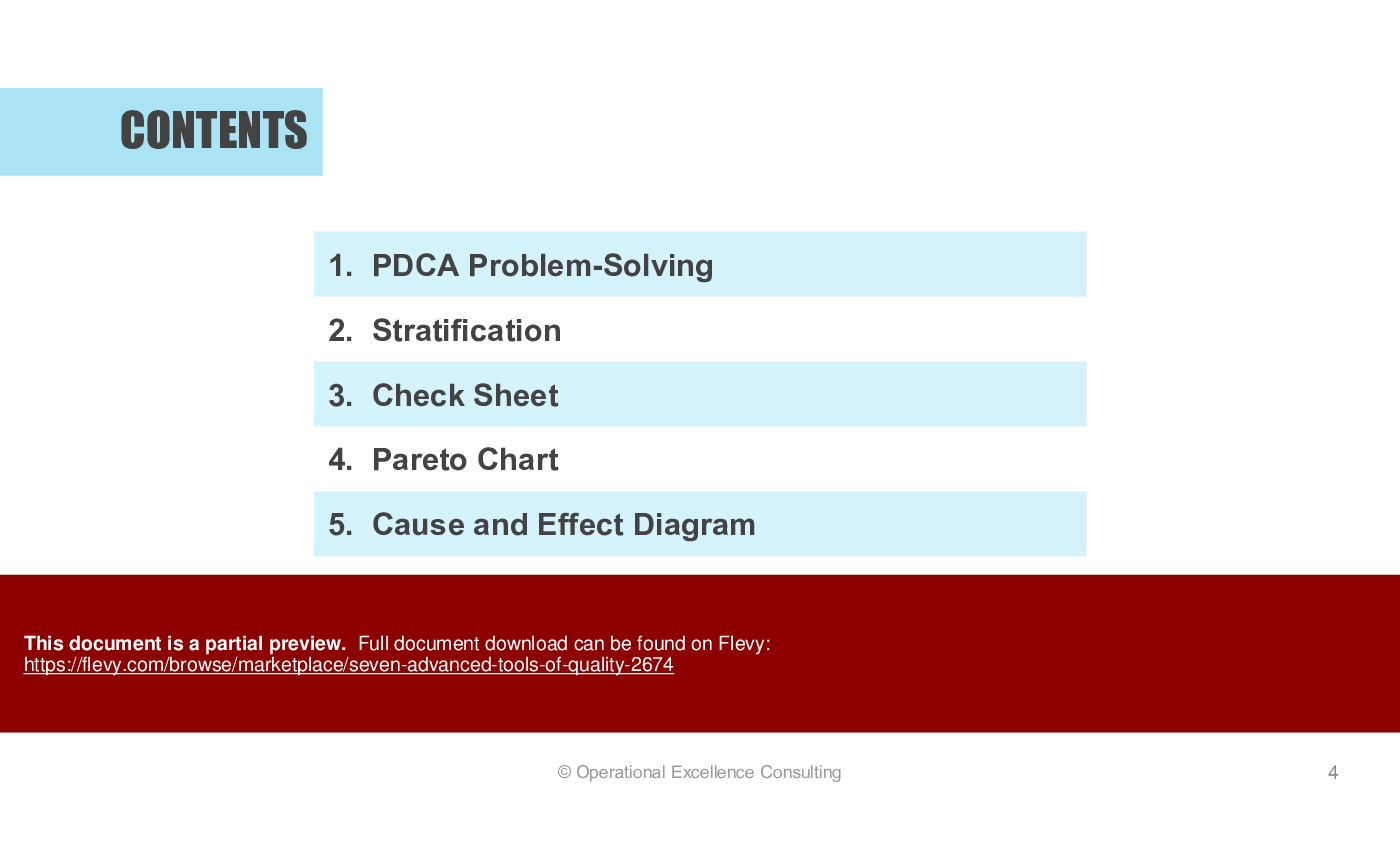
CONTENTS
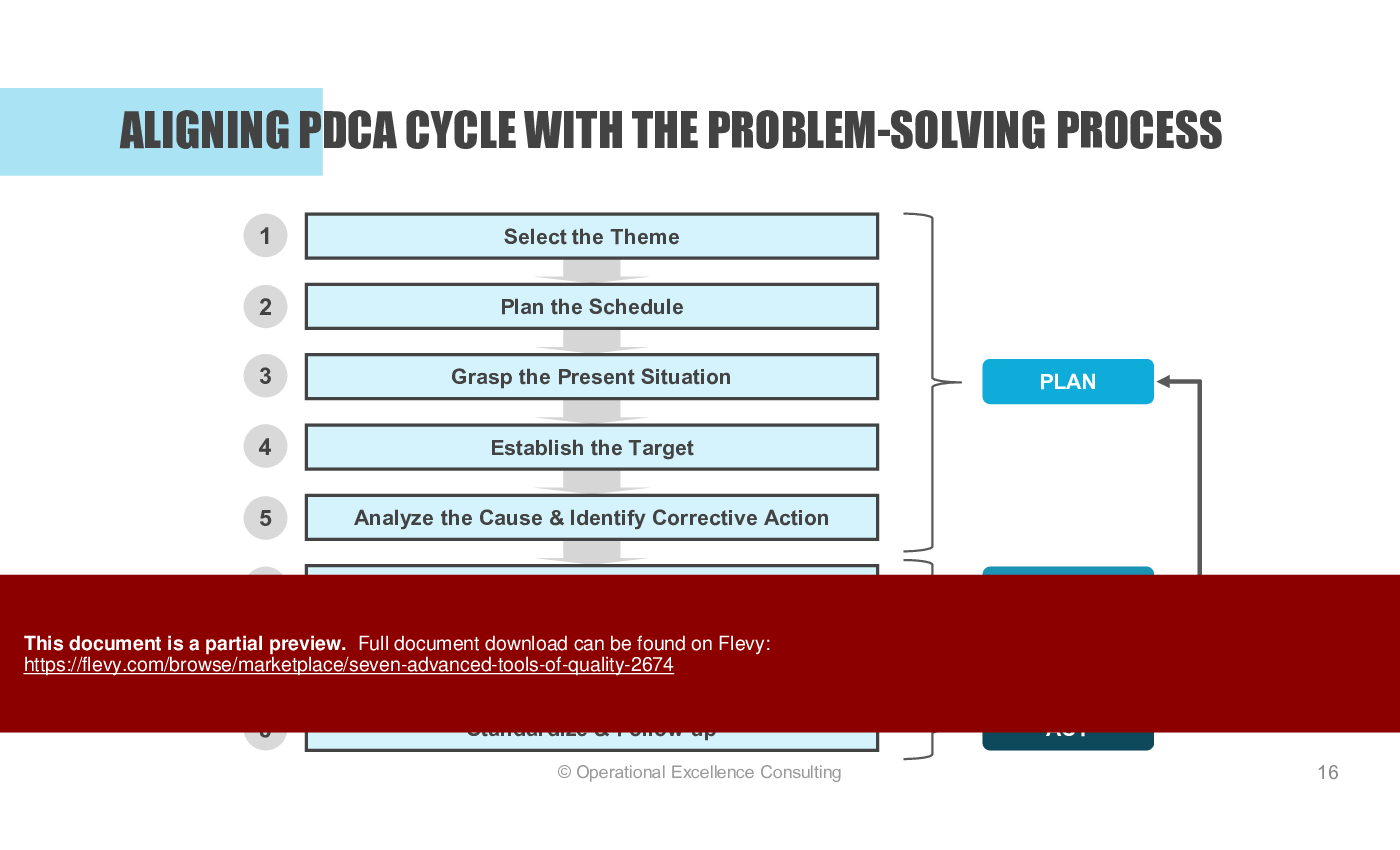
1. PDCA Problem Solving
2. Affinity Diagram (KJ Method)
3. Relations Diagram (Interrelationship Diagram)
4. Tree Diagram
5. Matrix Diagram
6. Matrix Data Analysis Chart
7. Arrow Diagram
8. Process Decision Program Chart (PDPC)
Got a question about the product? Email us at support@flevy.com or ask the author directly by using the "Ask the Author a Question" form. If you cannot view the preview above this document description, go here to view the large preview instead.
Executive Summary
The "Seven Advanced Tools of Quality" presentation is a meticulously crafted resource designed to enhance project planning and management capabilities through the application of advanced quality tools. Developed by a Certified Lean Six Sigma Black Belt with extensive experience at leading organizations, this presentation provides actionable insights into problem-solving methodologies, including the PDCA cycle and various diagrammatic tools. Users will gain the ability to systematically analyze complex issues, improve communication, and implement effective quality management strategies.
Who This Is For and When to Use
• Quality Assurance Managers seeking to enhance their problem-solving toolkit
• Project Managers looking to streamline project planning and execution
• Continuous Improvement Teams focused on process optimization
• Training and Development Professionals aiming to educate staff on quality tools
Best-fit moments to use this deck:
• During quality improvement initiatives to introduce advanced tools
• In training sessions for new team members on quality management
• When addressing complex project challenges requiring structured analysis
Learning Objectives
• Acquire knowledge on the 7 advanced quality tools for project planning and management
• Learn how to apply the 7 management and planning tools to problem-solving, projects, communication, and daily management work
• Understand the PDCA cycle and its application in quality improvement
• Develop skills in creating and utilizing various diagrams for effective analysis
• Enhance team collaboration through structured problem-solving techniques
• Foster a culture of continuous improvement within the organization
Table of Contents
• PDCA Problem-Solving (page 5)
• Affinity Diagram (page 22)
• Relations Diagram (page 28)
• Tree Diagram (page 34)
• Matrix Diagram (page 42)
• Matrix Data Analysis Chart (MDAC) (page 50)
• Arrow Diagram (page 57)
• Process Decision Program Chart (PDPC) (page 64)
Primary Topics Covered
• PDCA Problem-Solving - A structured approach to problem-solving that emphasizes continuous improvement through the Plan-Do-Check-Act cycle.
• Affinity Diagram - A tool for organizing and categorizing ideas generated during brainstorming sessions to identify patterns and relationships.
• Relations Diagram - Used to visualize and analyze interconnections among various factors affecting a problem or project.
• Tree Diagram - A hierarchical tool for mapping out decisions and their potential outcomes, aiding in complex issue analysis.
• Matrix Diagram - Facilitates comparative assessments and structured decision-making by analyzing relationships between multiple factors.
• Matrix Data Analysis Chart (MDAC) - A tool for identifying patterns and relationships between 2 sets of data, enhancing comparative analysis.
• Arrow Diagram - Visualizes task dependencies and sequences in project management, crucial for critical path analysis.
• Process Decision Program Chart (PDPC) - A contingency planning tool that identifies potential risks and develops strategies to address them.
Deliverables, Templates, and Tools
• PDCA cycle template for structured problem-solving
• Affinity Diagram template for organizing ideas
• Relations Diagram framework for mapping interconnections
• Tree Diagram template for decision mapping
• Matrix Diagram template for comparative analysis
• MDAC template for data relationship analysis
• Arrow Diagram template for project task sequencing
• PDPC template for risk management and contingency planning
Slide Highlights
• Overview of the PDCA cycle illustrating its role in continuous improvement
• Affinity Diagram example showcasing late order issues and their causes
• Relations Diagram visualizing factors contributing to low customer satisfaction
• Tree Diagram examples for risk breakdown and root cause analysis
• Matrix Diagram examples comparing product features and tenant complaints
• Arrow Diagram demonstrating critical path analysis in project management
• PDPC outlining potential risks and countermeasures for effective planning
Potential Workshop Agenda
Introduction to Quality Tools (30 minutes)
• Overview of the presentation and learning objectives
• Discussion on the importance of quality tools in project management
Hands-On Session: Affinity Diagram (60 minutes)
• Group brainstorming to generate ideas
• Organizing ideas into an Affinity Diagram
Exploring the PDCA Cycle (45 minutes)
• Detailed explanation of the PDCA process
• Case study analysis using the PDCA framework
Using the Relations Diagram (45 minutes)
• Identifying interconnections in a real-world scenario
• Creating a Relations Diagram as a group activity
Customization Guidance
• Tailor the presentation to reflect specific organizational challenges and goals
• Adjust terminology and examples to align with industry-specific language
• Incorporate company-specific data and case studies for relevance
• Modify templates to fit unique project management frameworks and processes
Secondary Topics Covered
• Basic tools of quality, including stratification and control charts
• Techniques for effective brainstorming and idea generation
• Methods for analyzing customer feedback and satisfaction
• Strategies for fostering a culture of continuous improvement
• Best practices for team collaboration in quality management
FAQ
What are the 7 advanced tools of quality?
The 7 advanced tools include the Affinity Diagram, Relations Diagram, Tree Diagram, Matrix Diagram, Matrix Data Analysis Chart, Arrow Diagram, and Process Decision Program Chart (PDPC).
How can I apply the PDCA cycle in my organization?
The PDCA cycle can be applied by identifying issues, planning corrective actions, executing the plan, checking results, and standardizing successful processes for continuous improvement.
When should I use an Affinity Diagram?
Use an Affinity Diagram during brainstorming sessions or when analyzing complex issues that require structured organization of ideas.
What is the purpose of a Relations Diagram?
A Relations Diagram helps visualize and analyze the interconnections among various factors, aiding in complex issue analysis and decision-making.
How do I create a Matrix Diagram?
To create a Matrix Diagram, define the purpose, identify criteria for comparison, select the appropriate matrix type, label rows and columns, and evaluate relationships between criteria.
What is the significance of the Arrow Diagram in project management?
The Arrow Diagram is essential for visualizing task dependencies and sequences, enabling effective critical path analysis for project completion.
How does the PDPC assist in risk management?
The PDPC helps identify potential risks in a project and develop contingency plans to address those risks, ensuring proactive management.
Can I customize the templates provided in this presentation?
Yes, the templates can be customized to fit your organization's specific needs and application areas.
Glossary
• PDCA - Plan-Do-Check-Act, a continuous improvement methodology.
• Affinity Diagram - A tool for organizing ideas into related groups.
• Relations Diagram - A visual representation of interconnections among factors.
• Tree Diagram - A hierarchical tool for mapping decisions and outcomes.
• Matrix Diagram - A comparative analysis tool for evaluating relationships.
• Matrix Data Analysis Chart (MDAC) - A chart for analyzing relationships between 2 data sets.
• Arrow Diagram - A diagram illustrating task dependencies and sequences.
• Process Decision Program Chart (PDPC) - A tool for contingency planning and risk management.
• Quality Improvement - The ongoing effort to enhance products, services, or processes.
• Continuous Improvement - An ongoing effort to improve products, services, or processes.
• Problem-Solving - The process of identifying and addressing issues to prevent recurrence.
• Root Cause Analysis - A method for identifying the underlying causes of problems.
• Critical Path - The sequence of stages determining the minimum time needed for an operation.
• Stakeholder - An individual or group with an interest in the outcome of a project.
• Data Analysis - The process of inspecting and interpreting data to uncover insights.
• Project Management - The discipline of planning, executing, and closing projects.
• Collaboration - Working together to achieve a common goal.
• Innovation - The introduction of new ideas, products, or processes.
• Lean Management - A methodology focused on minimizing waste while maximizing productivity.
• Quality Control - The process of ensuring products meet specified requirements.
• Training and Development - Programs designed to enhance employee skills and knowledge.
Source: Seven Advanced Tools of Quality PowerPoint (PPTX) Presentation Slide Deck, Operational Excellence Consulting
This document is available as part of the following discounted bundle(s):
Save %!
Basic & Advanced Tools of Quality ("QC Tools")
This bundle contains 2 total documents. See all the documents to the right.
|
Download our FREE Strategy & Transformation Framework Templates
Download our free compilation of 50+ Strategy & Transformation slides and templates. Frameworks include McKinsey 7-S, Balanced Scorecard, Disruptive Innovation, BCG Curve, and many more. |