
 Click main image to view in full screen. Unlock all 10 preview images:
Physical Therapy Practice Financial Model 5-Year – PDF
PDF document + Zip archive file (ZIP) 19 Pages


BENEFITS OF THIS DOWNLOADABLE PDF DOCUMENT
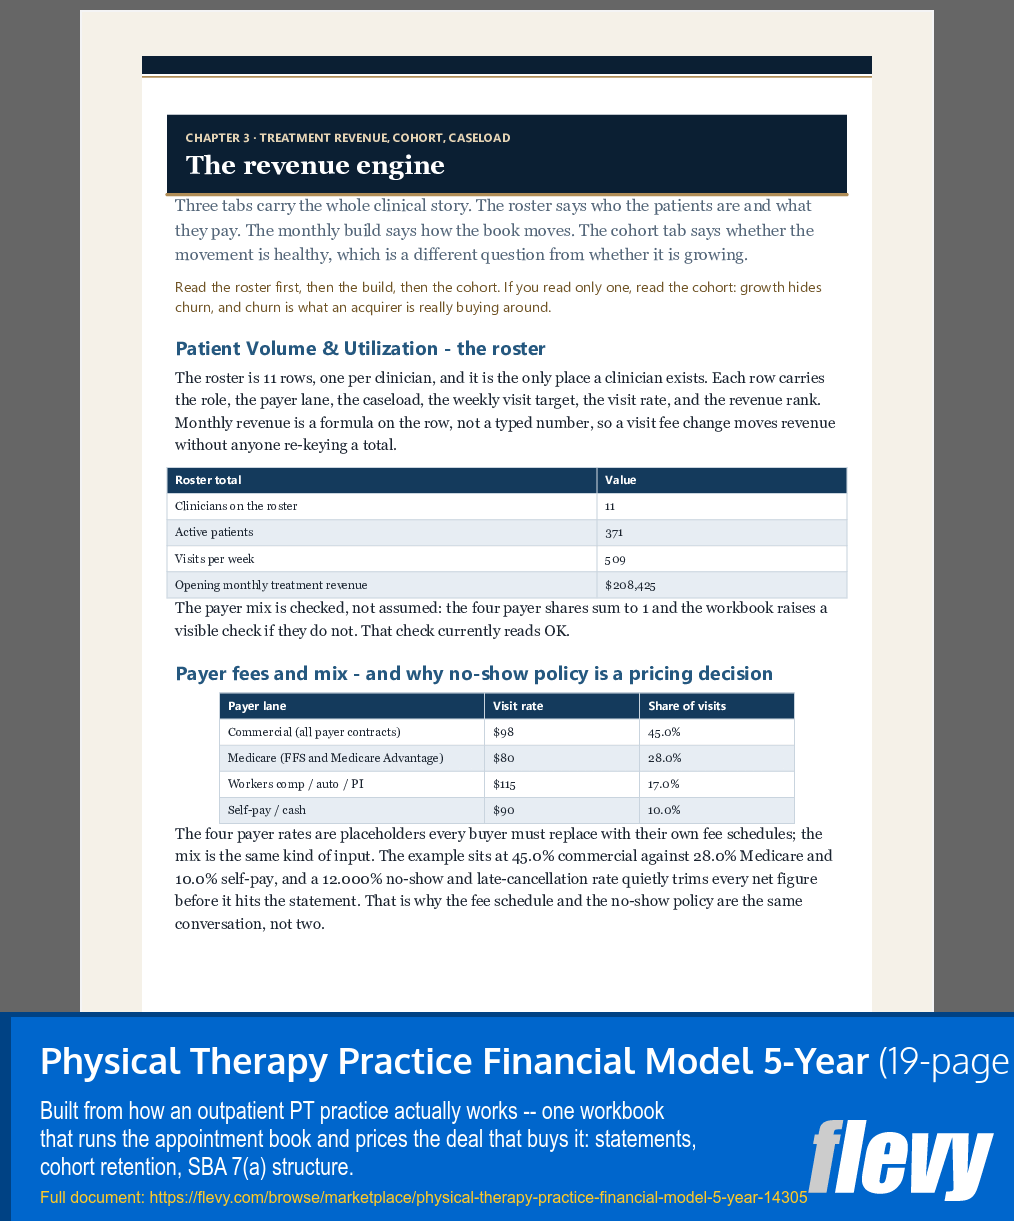
- Turns one 371-patient roster into the full five-year picture - statements, ratios, therapist capacity, patient retention - with every number tied to a named range a reviewer can audit.
- Prices the acquisition you would actually do - SBA 7(a) sources and uses, DSCR per year, equity injection gate - instead of a bare EBITDA multiple.
- Tells you which assumption moves the answer before you argue about it - Downside, Base, Upside, plus six elasticities measured against the live model.
HEALTHCARE PDF DESCRIPTION
Most practice financial models are a P&L with a referral line. This one is an engine.
It starts where the business actually starts: the clinician roster. Role, payer lane, caseload, weekly visit target, rate – every treating clinician, one row, live formulas. The appointment book builds forward month by month for 60 months and annually for five years: new patients, expansion, reactivation, contraction, churn, annual rate increases. Every rate is named, visible and replaceable.
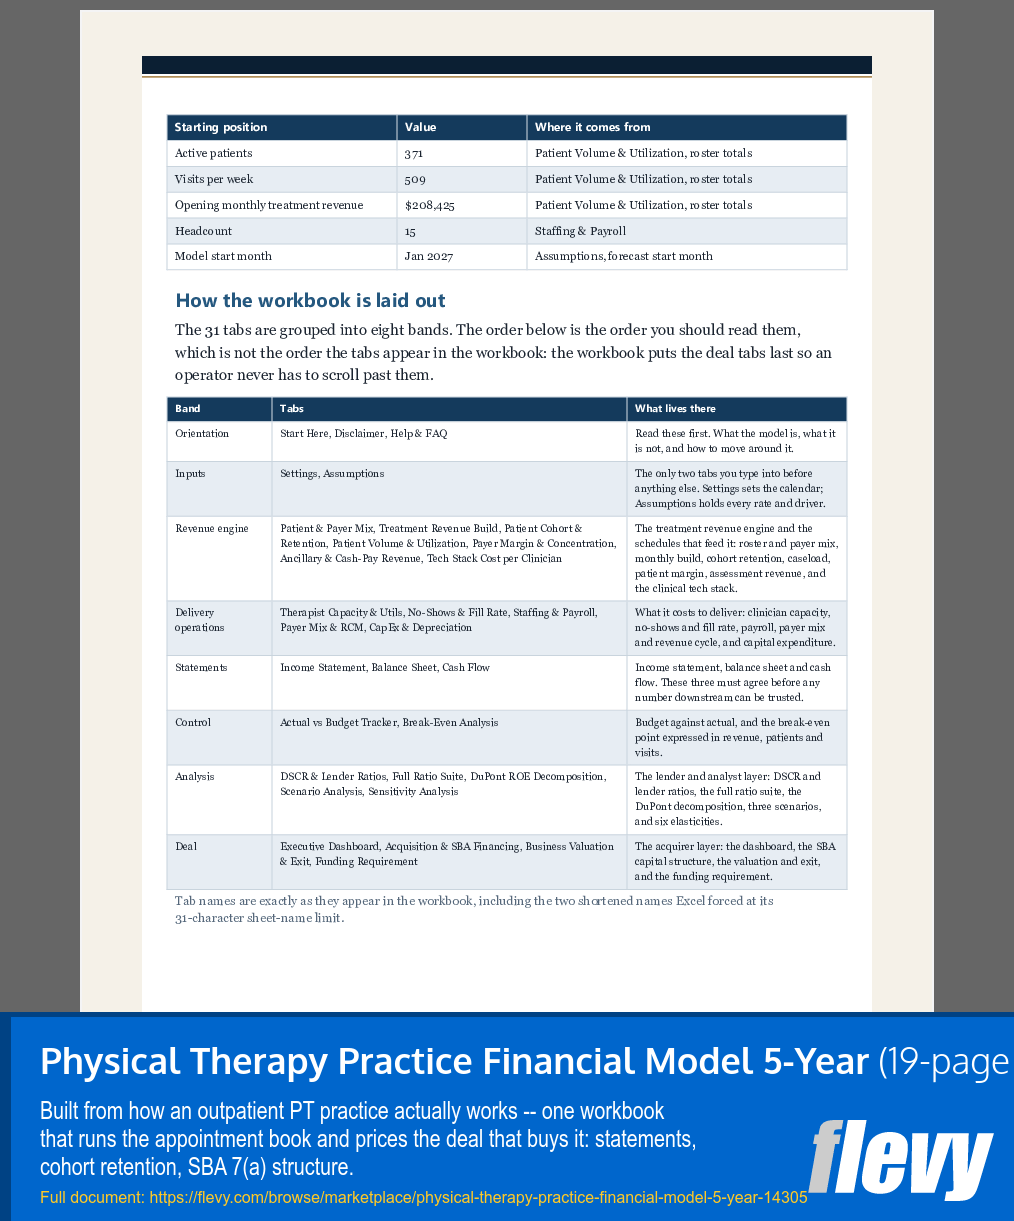
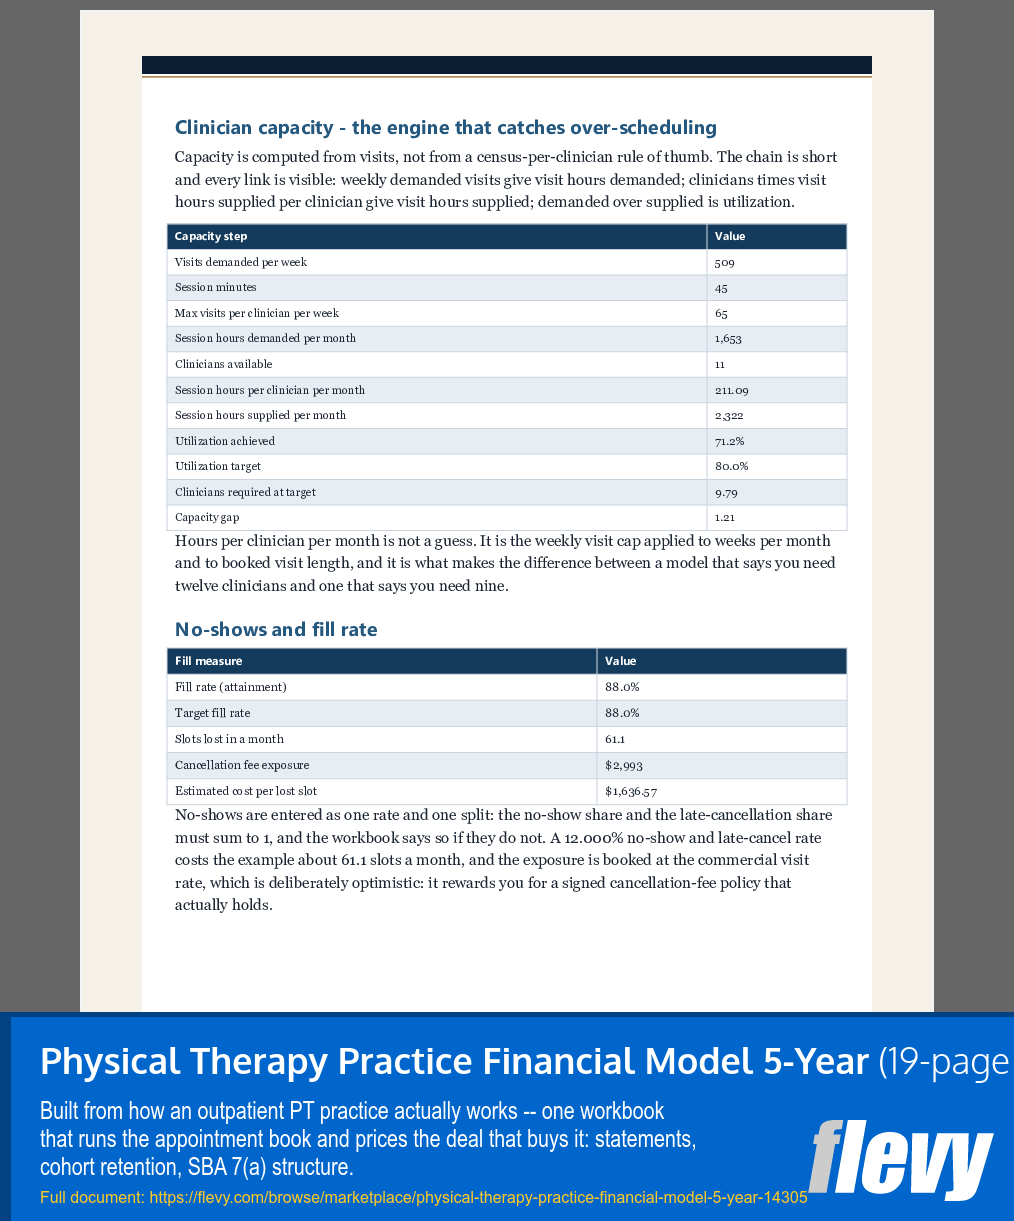
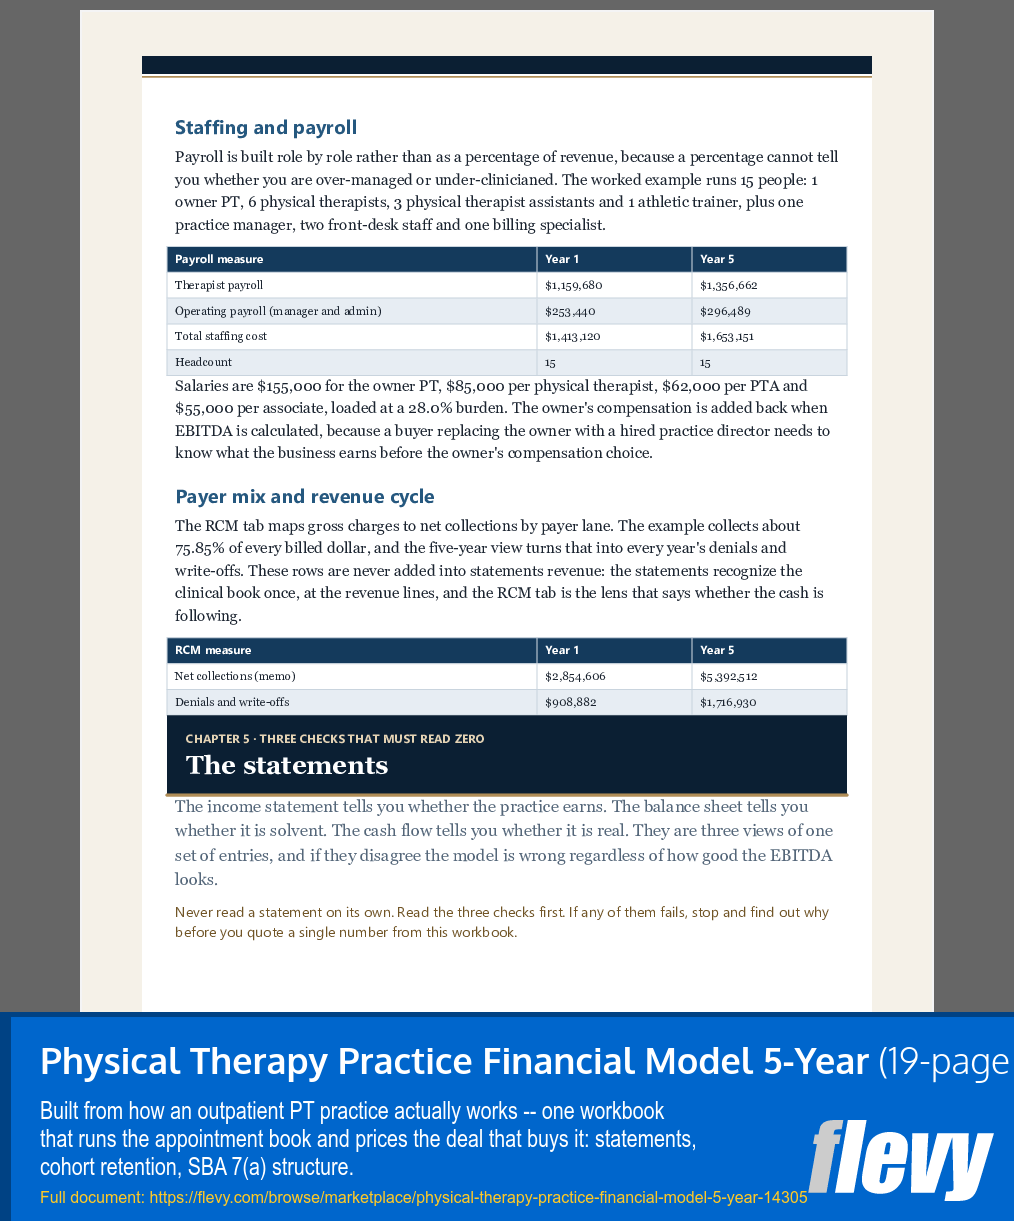
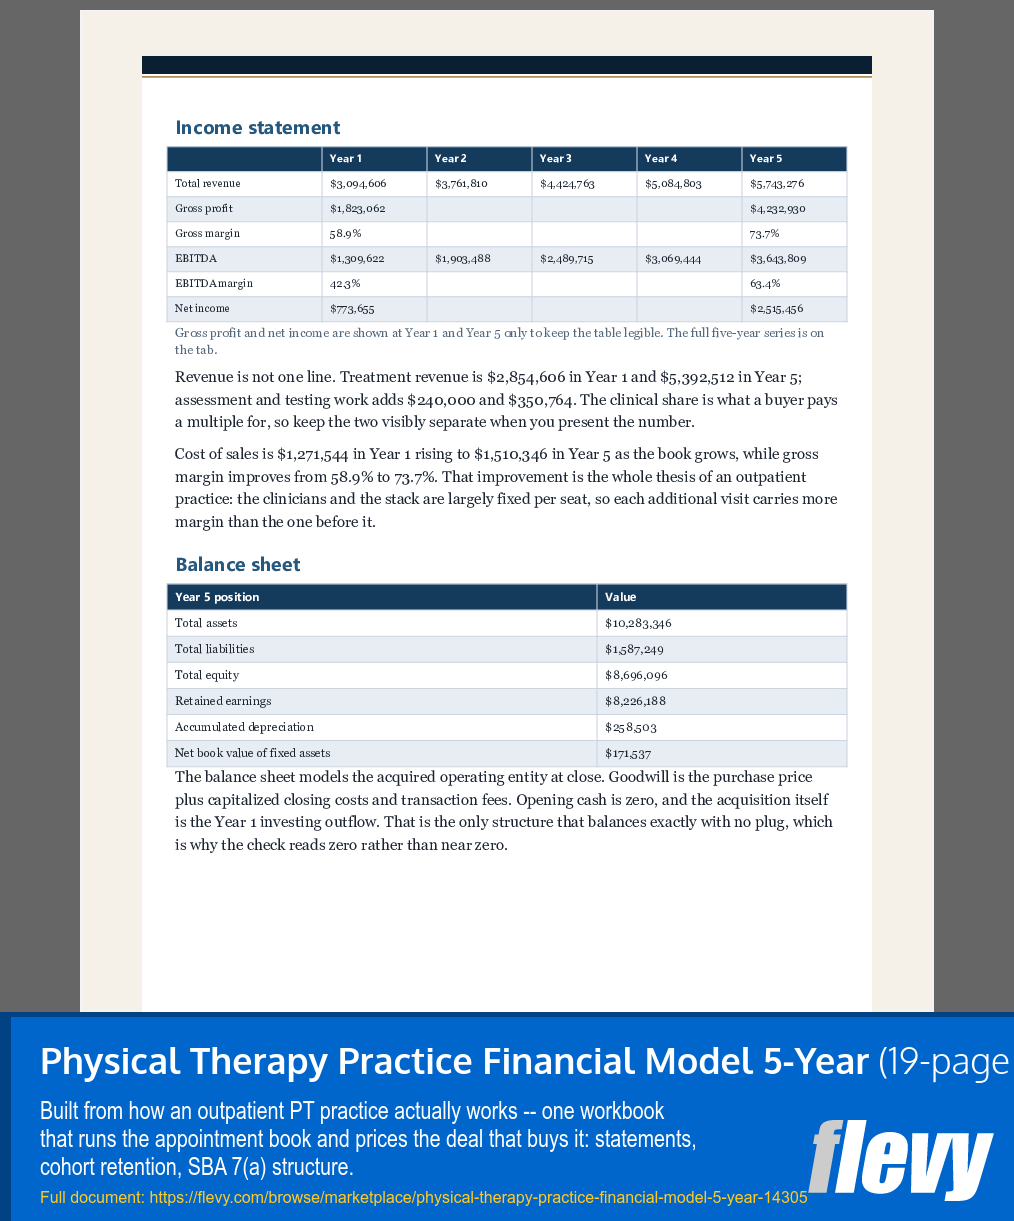
The delivery side is priced the way an outpatient PT practice actually costs money. The clinical stack is line by line – EMR, e-prescribing, clearinghouse, claims submission, telehealth, outcome tracking – not a lump cost of sales. Therapist capacity comes from booked visit hours with an 80% utilization target, so over-selling shows up as a number, not a surprise. No-shows and cancellations are one rate with a shared split, and fill rate is tracked against an 88% target. Payroll is built role by role – owner PT, PTs, PTAs, athletic trainer, practice manager, front desk and billing – with the owner compensation addback stated explicitly. Three statements – income, balance sheet, cash flow – tie out to zero in every one of the five years.
The deal side answers the questions a buyer and a lender actually ask. The acquisition tab builds the SBA 7(a) capital structure from the purchase price outward: 120-month amortization, guaranty fee, packaging fee, seller note with a standby period, working capital injection, and a sources and uses table that balances. Five compliance gates are computed and labeled, never approximated: equity injection at 10% of project cost, the $5,000,000 program maximum, the base-plus-3.0% rate cap, the sources and uses tie, and post-close liquidity. DSCR is computed per year against the 1.25x floor – not just in Year 1.
The valuation tabs lead with the exit multiple applied to Year-5 EBITDA – how lower-middle-market service practices are commonly priced – and keep Gordon growth beside it as a cross-check. Enterprise value is a value today: debt is netted at closing, not at exit, and all three terminal methods are discounted to today before they are blended. Returns are expressed both ways – equity MOIC on the cheque, and MOIC on total capital for the lender's committee.
A named scenario switch runs the same monthly recursion in Downside, Base and Upside, each tied back to the live model. Six elasticities tell you which assumption moves the answer before you argue about it.
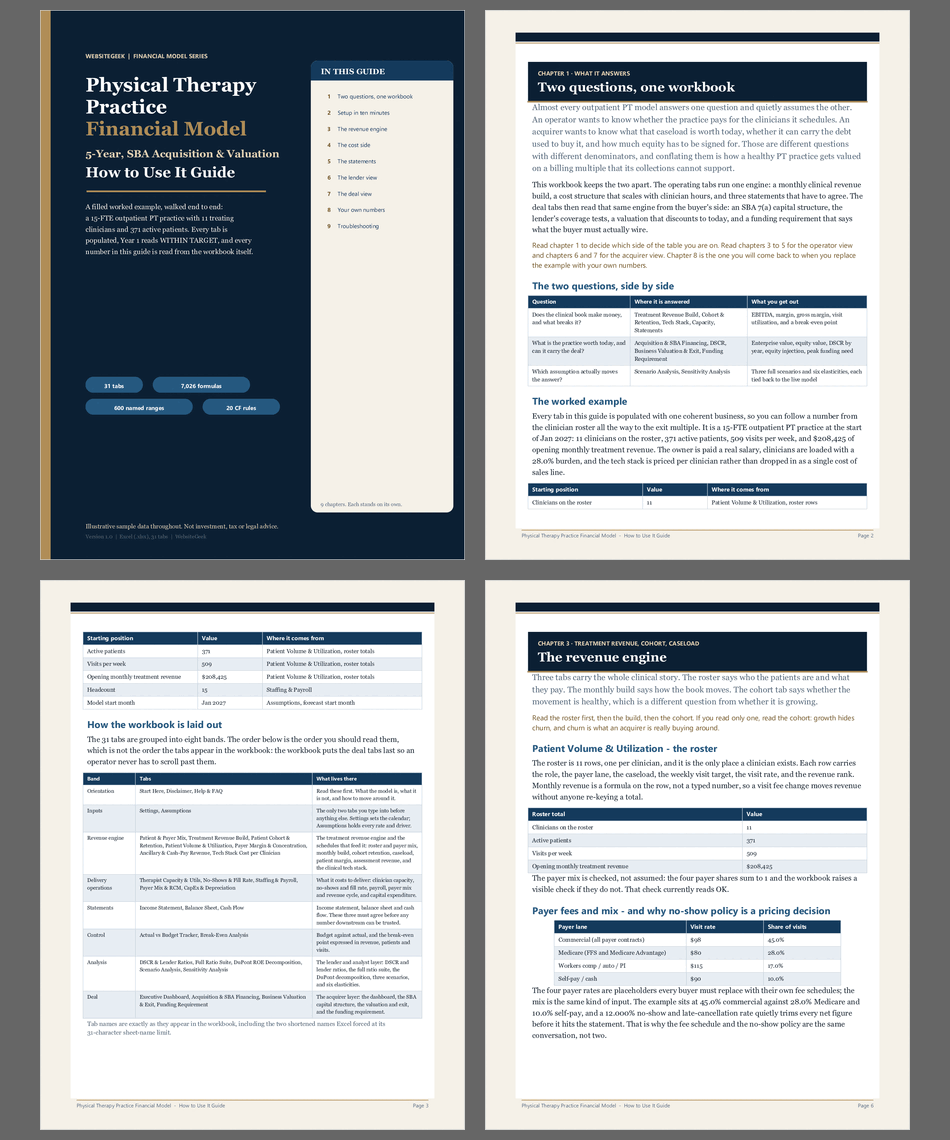
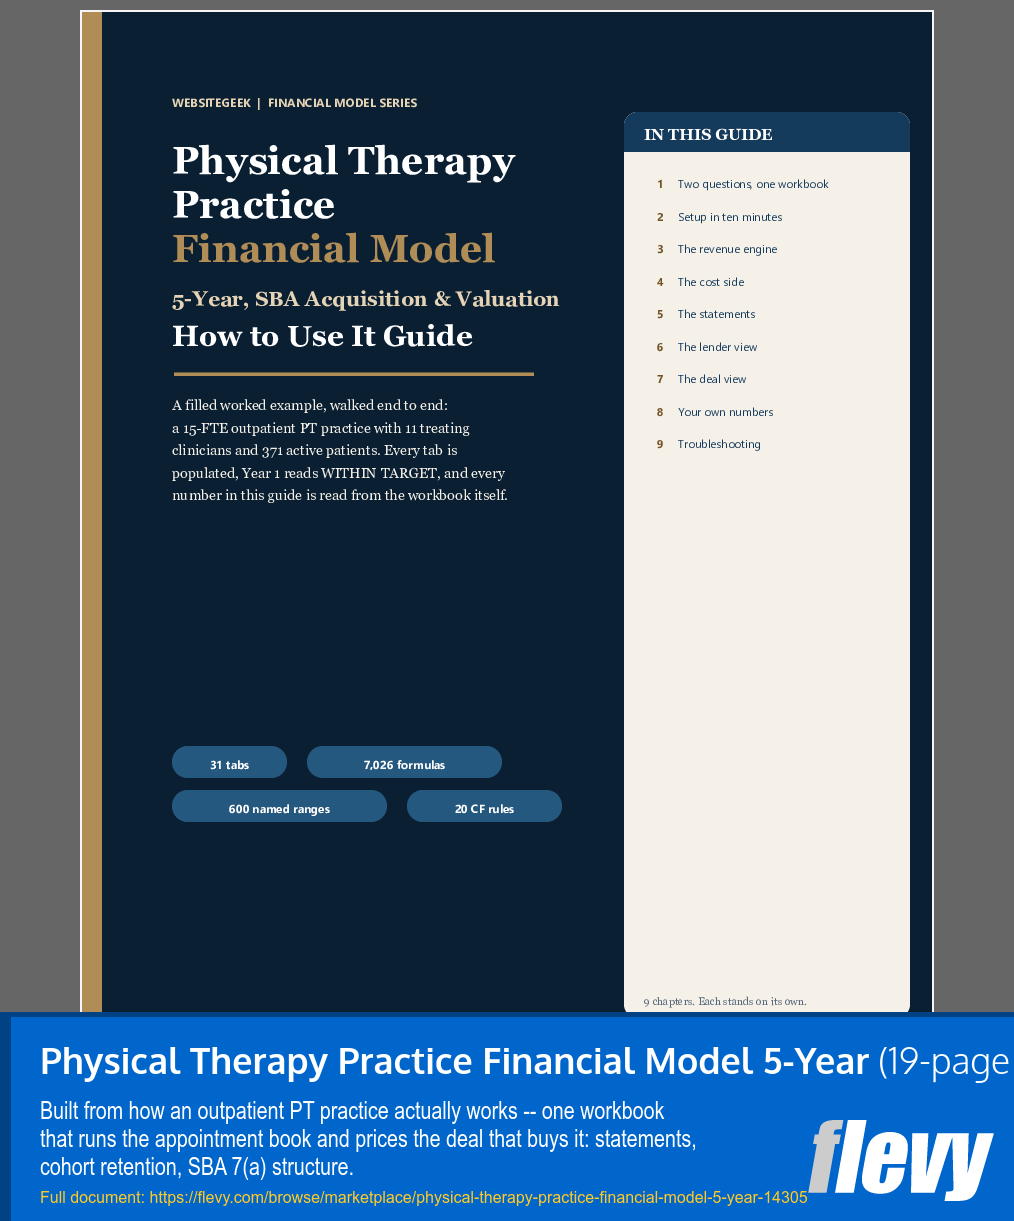
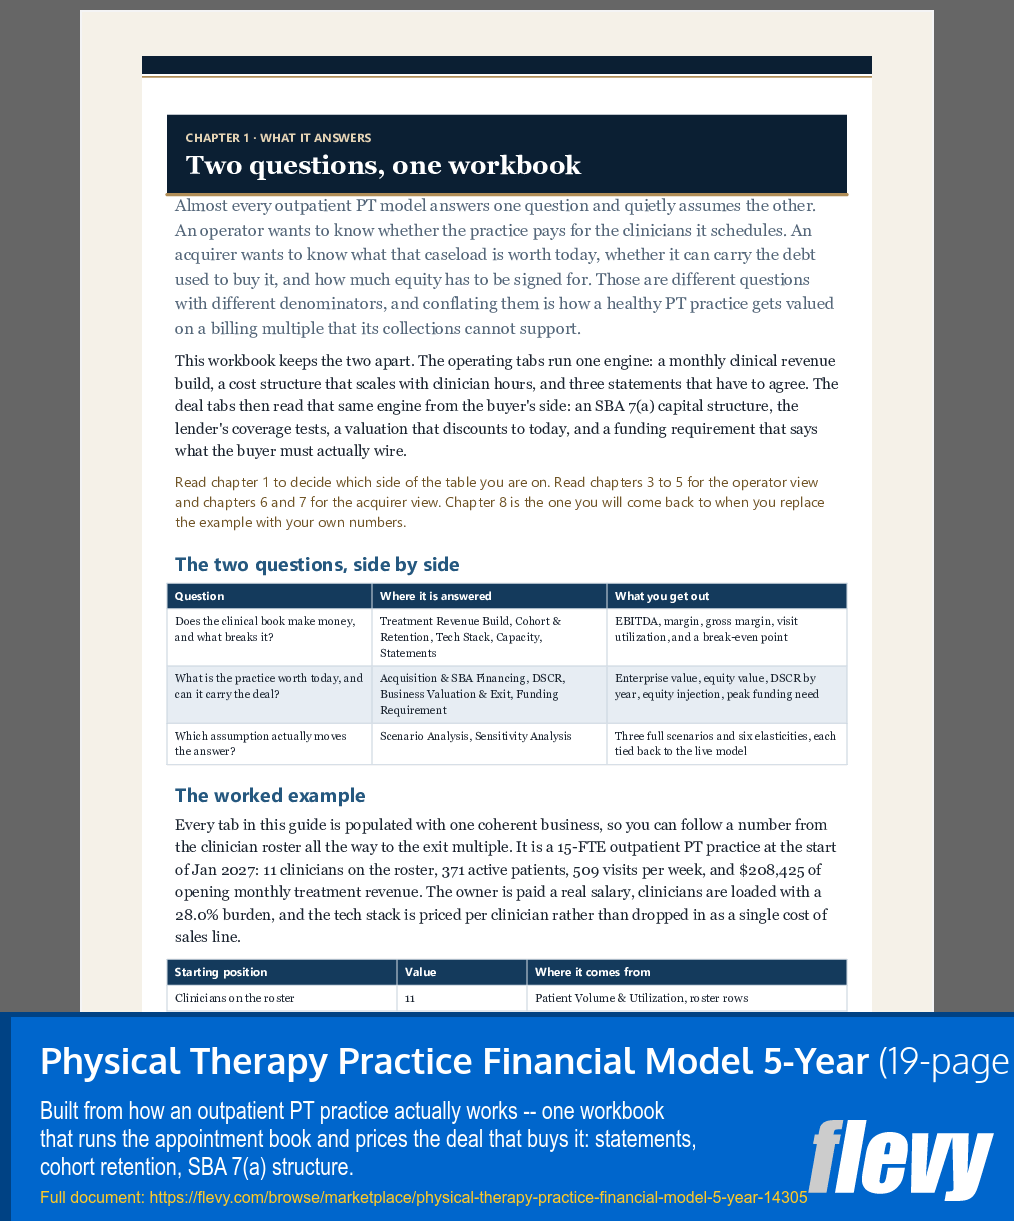
What you get: 31 live tabs, 7,026 formulas, 600 named ranges, no macros and no add-ins, plus a 19-page How-To guide that walks the filled example end to end – a 15-FTE outpatient PT practice with 11 treating clinicians and 371 active patients. Year 1 reads WITHIN TARGET; Years 2-5 flag over-capacity at a static 15-FTE roster, so the model surfaces the hiring decision rather than hiding it. Every number in the guide is read from the workbook, not typed.
Who it is for: practice owners who want to know whether the caseload pays and what breaks it; acquirers and search funds pricing an outpatient PT practice; lenders and brokers who need the structure, not the pitch; consultants who advise both sides.
Educational material, not investment, tax or legal advice. SBA fee percentages are editable inputs because SBA publishes the fee schedule annually and it changes; the guaranty fee ships with a confirmation footnote, not a frozen number. Medicare KX therapy threshold is exposed as an editable convention and must be verified against the current CMS Physician Fee Schedule before reliance.
Got a question about the product? Email us at support@flevy.com or ask the author directly by using the "Ask the Author a Question" form. If you cannot view the preview above this document description, go here to view the large preview instead.
Source: Best Practices in Healthcare, Integrated Financial Model PDF: Physical Therapy Practice Financial Model 5-Year PDF (PDF) Document, WebsiteGeek
ABOUT THE AUTHOR

We provide ready-to-use digital tools and business solutions for small businesses, entrepreneurs, and professionals to improve business performance, manage finances, streamline operations, and simplify compliance -- saving your time and effort.
Ask the Author a Question
You must be logged in to contact the author.