 Click main image to view in full screen. Unlock all 10 preview images:
Residential Development Financial Model - 10-Year Excel – Excel XLSX
Excel (XLSX) + supplemental PDF


BENEFITS OF THIS DOWNLOADABLE EXCEL DOCUMENT
- ntify when the project needs the most funding by linking construction spend, deposits and closing receipts to senior debt and sponsor equity.
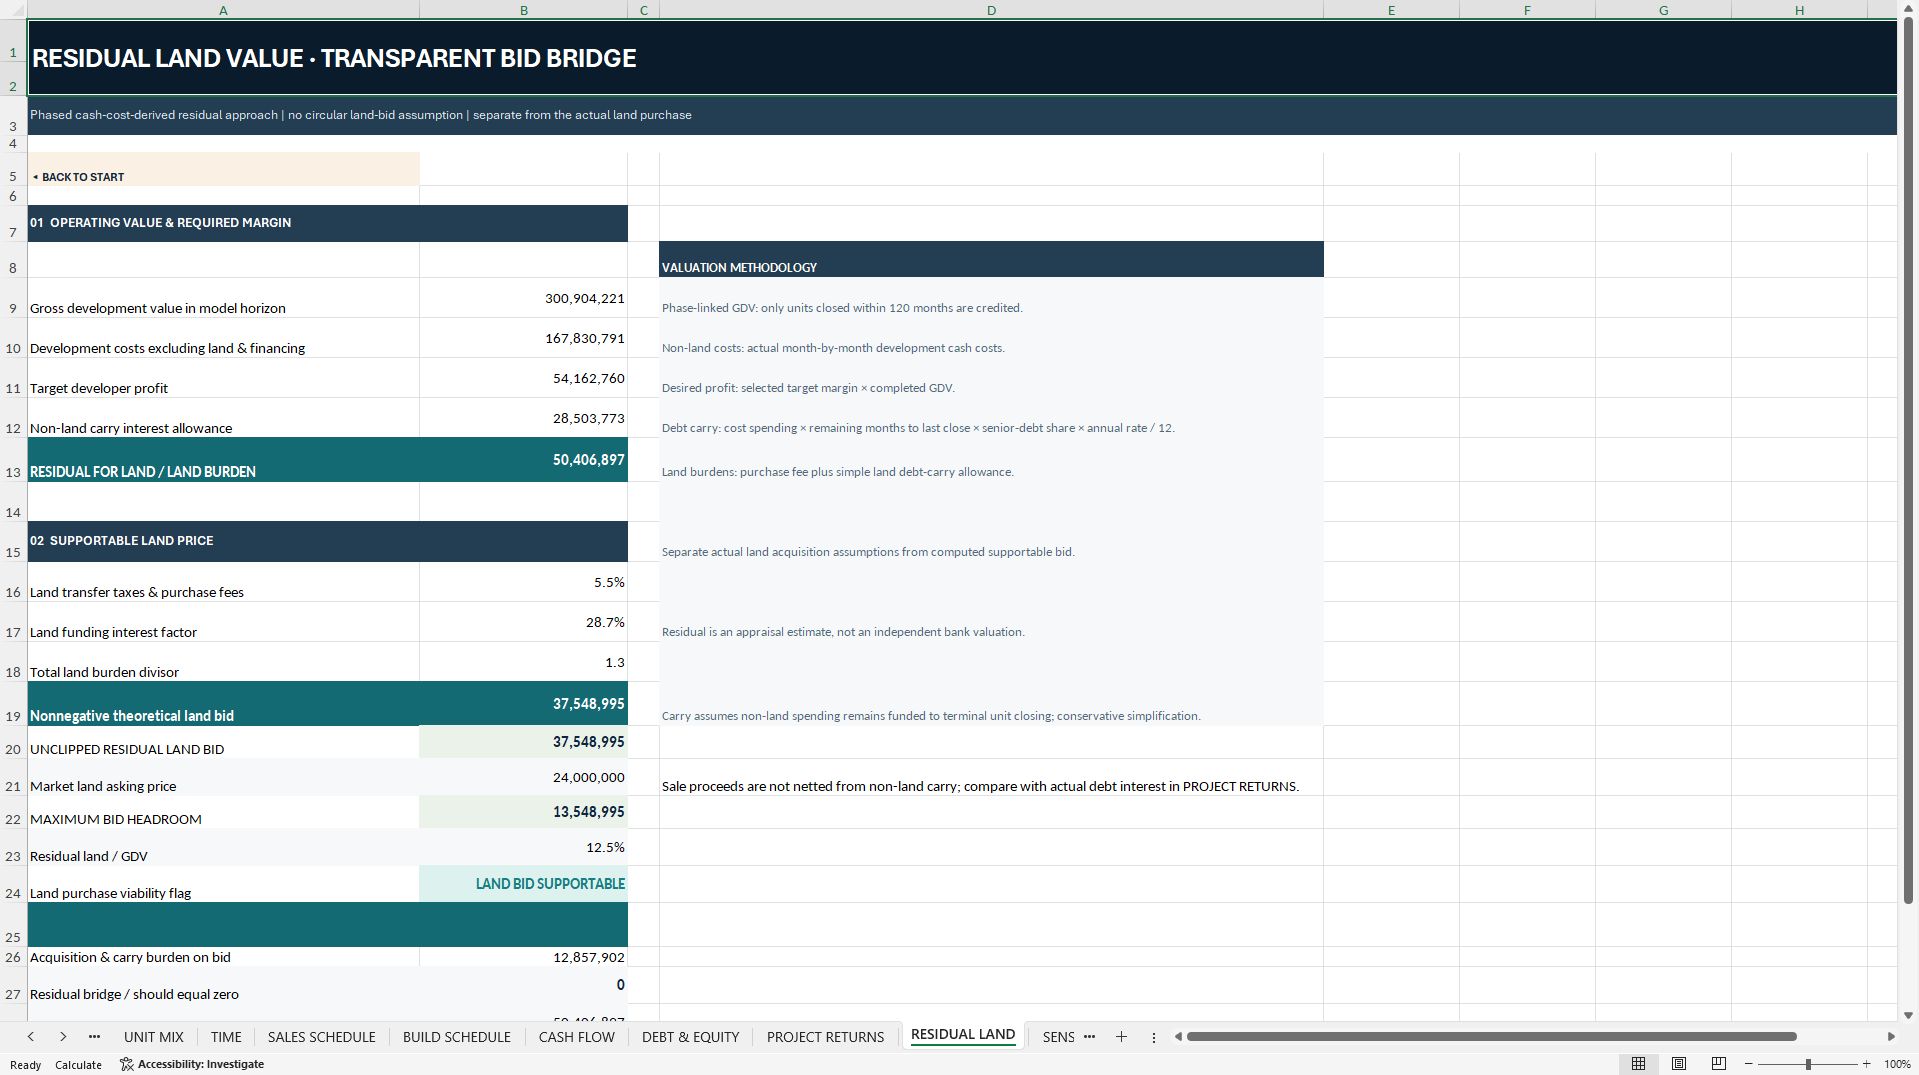
- Evaluate a land asking price against a supportable bid based on development value, project costs and your target developer profit.
- est how pricing, costs, delays and absorption affect equity returns across four scenarios, then isolate their price-and-cost effects on land value in a 49-cell sensitivity grid.
REAL ESTATE EXCEL DESCRIPTION
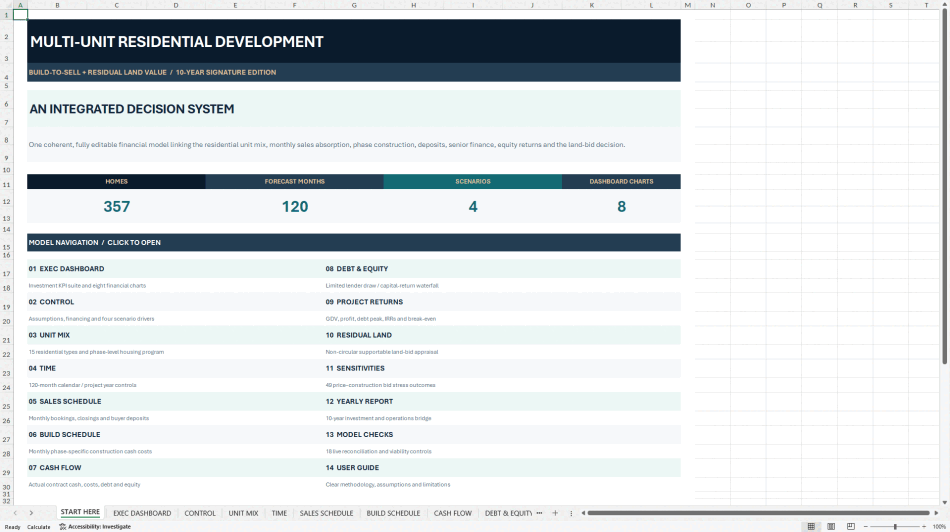
Evaluate a residential build-to-sell project from land acquisition through construction, unit sales and final closings. This editable Excel model connects sales absorption, buyer deposits, construction spending and senior debt across 120 monthly periods, so you can see when funding is needed, what equity earns and how much the project can support as a land bid.
🏘️ BUILD THE UNIT MIX AND SALES FORECAST
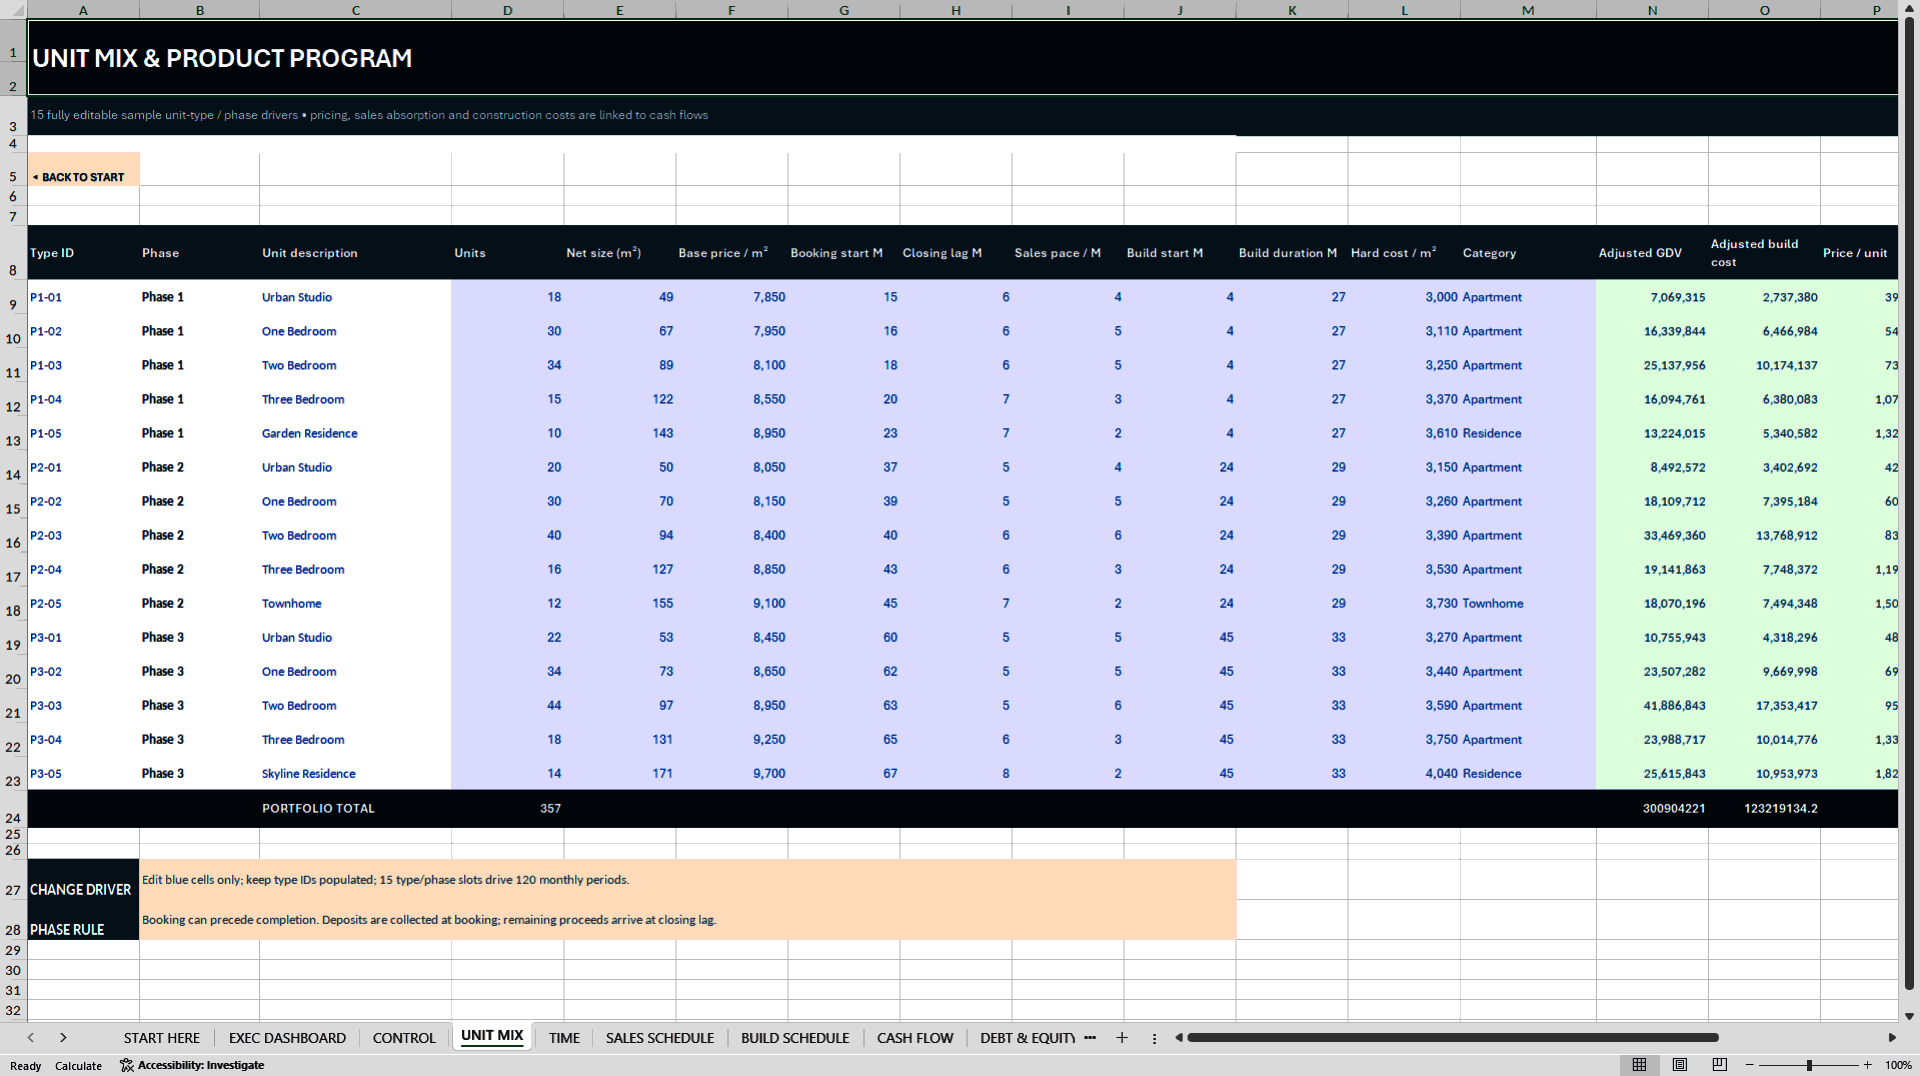
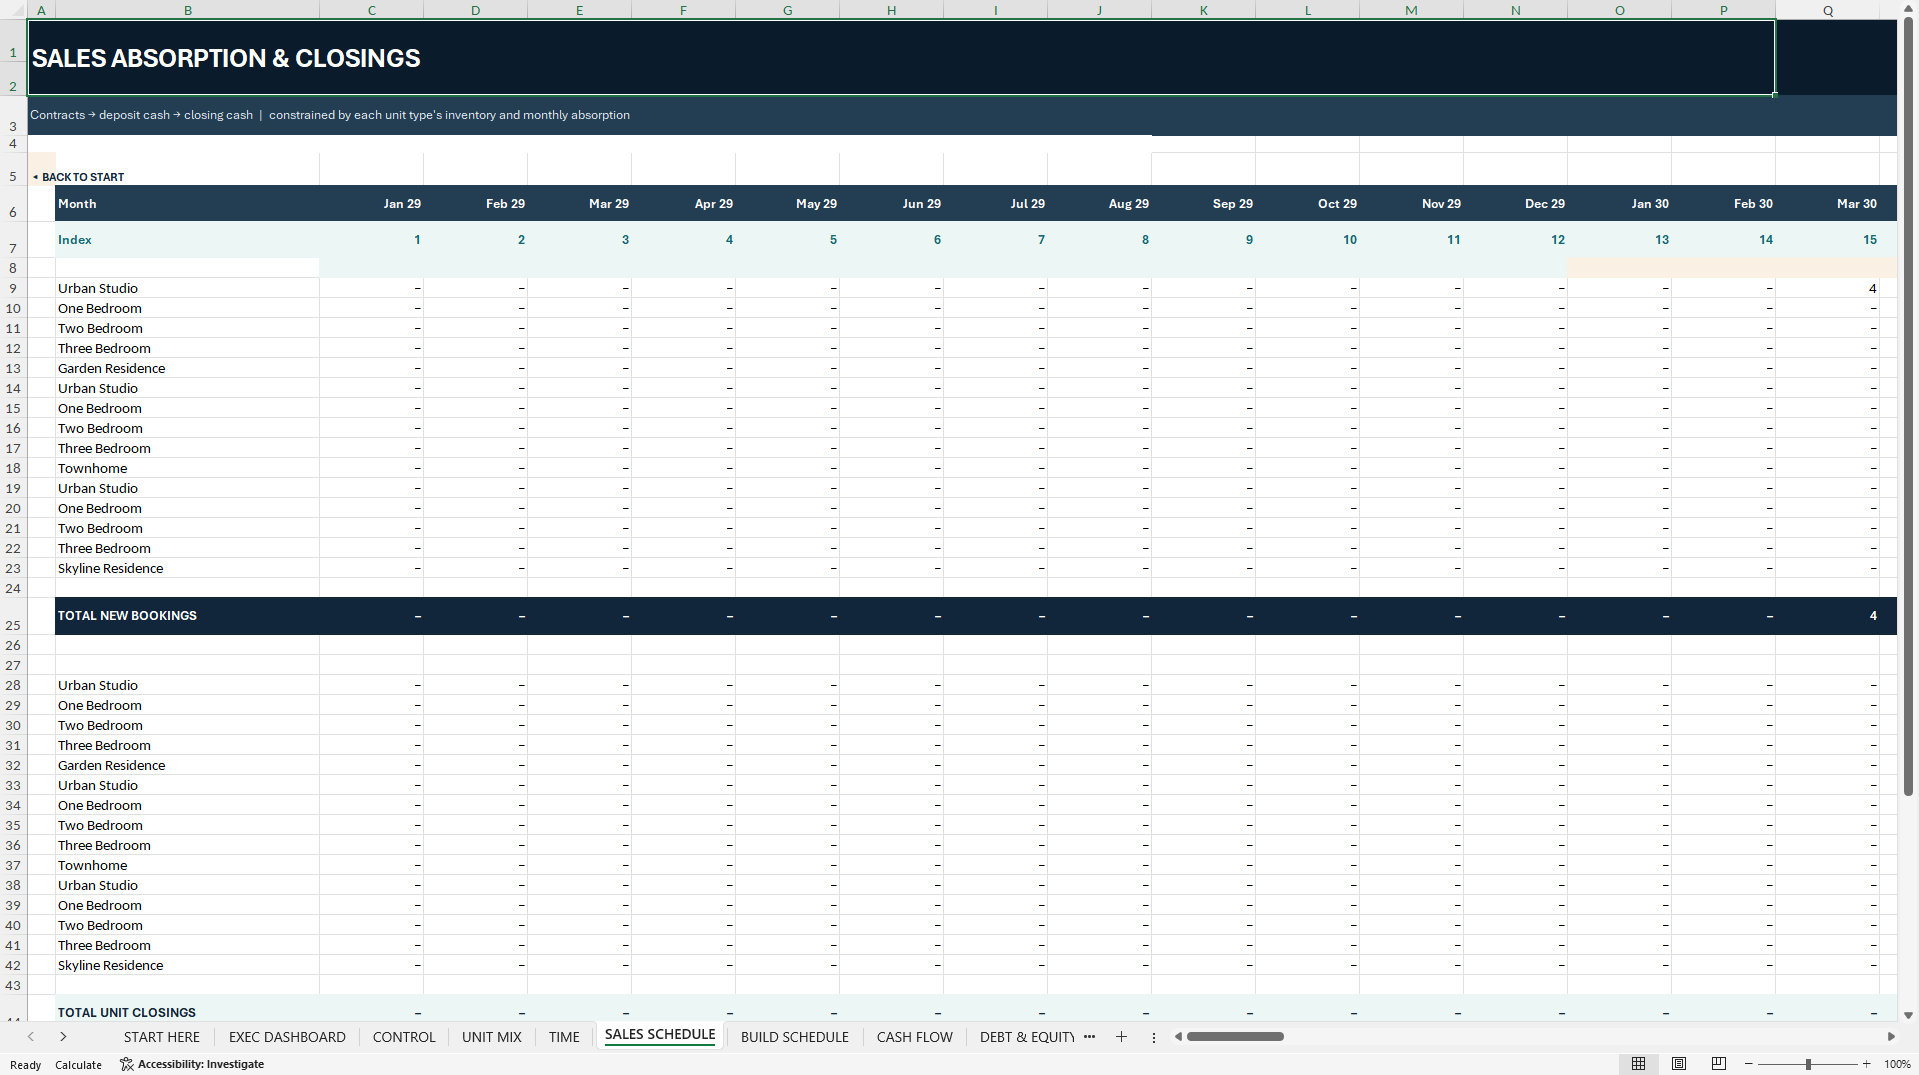
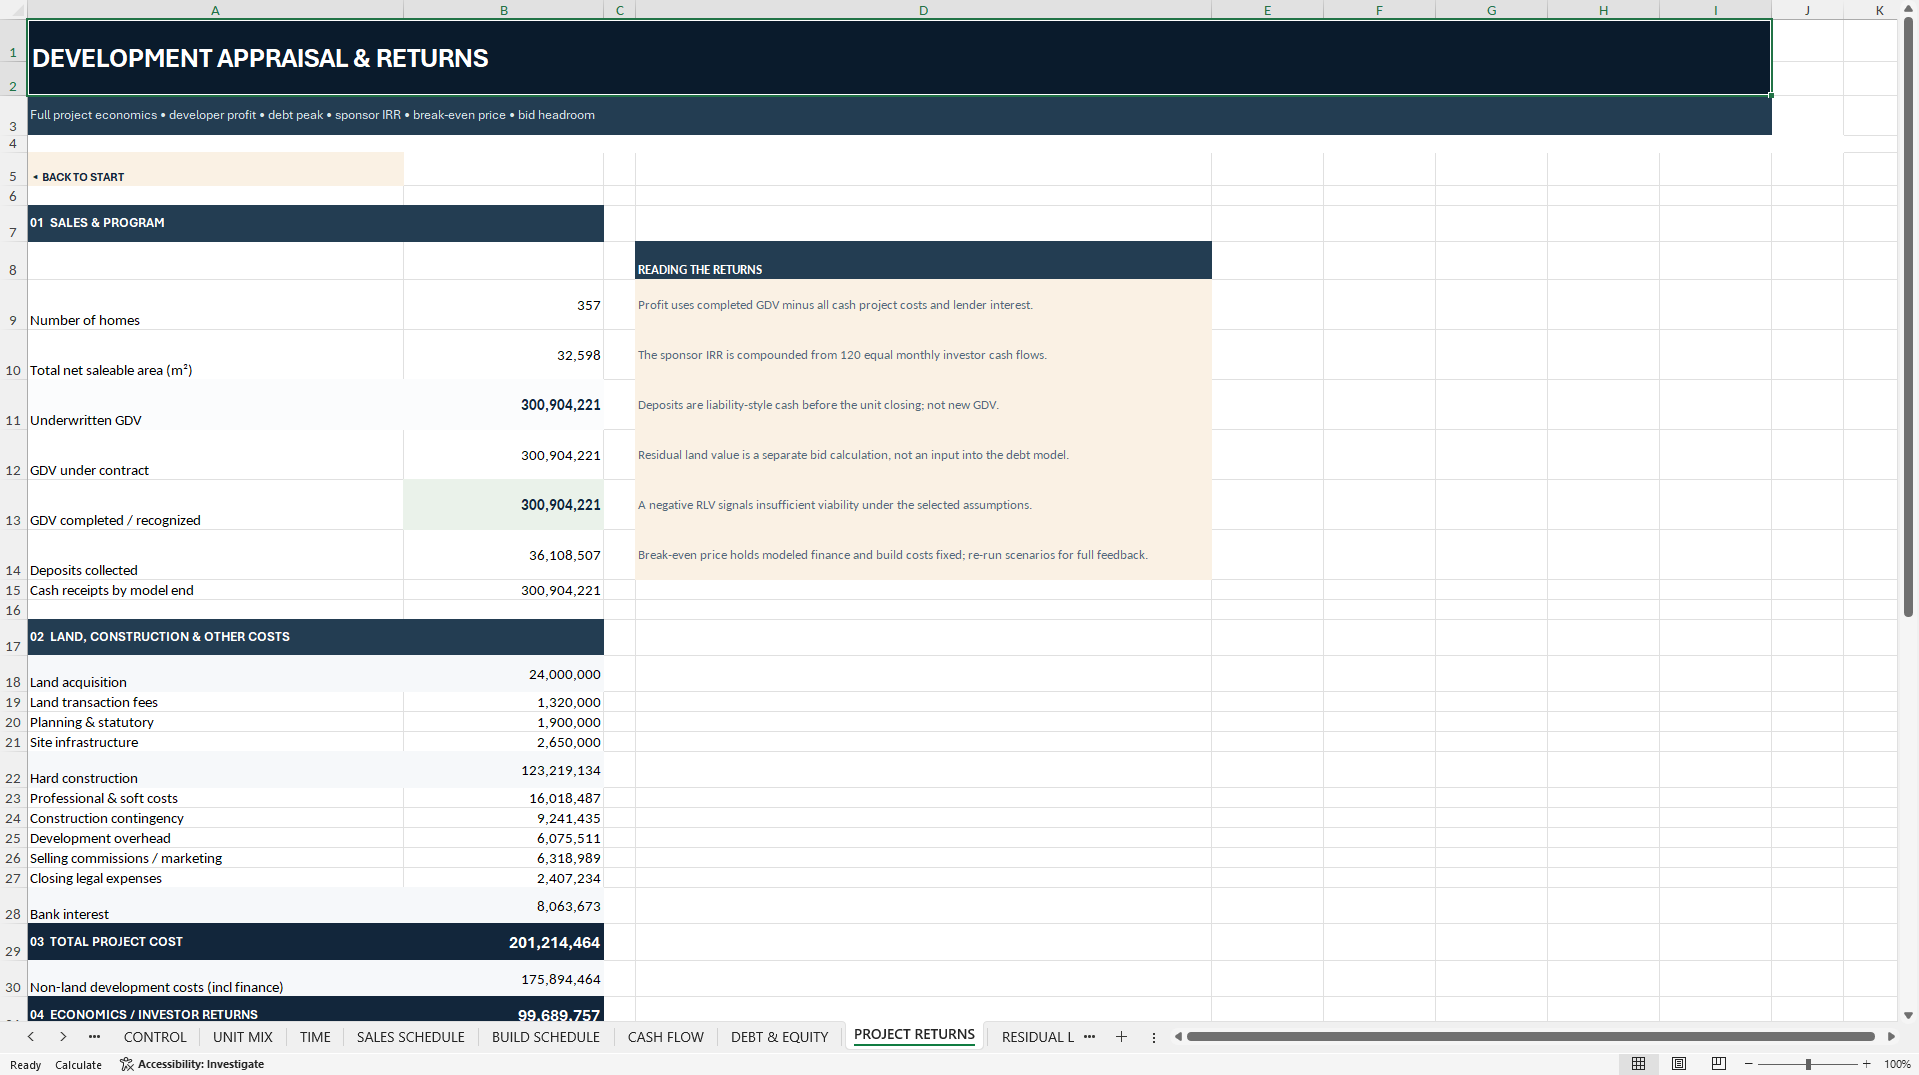
Configure up to 15 unit types or development phases. Edit unit counts, sizes, selling prices per square metre, booking dates, sales absorption, closing lags, construction timing and hard costs. The fictional example includes 357 homes and 32,598 m² of net saleable area.
Track bookings, deposits and closing proceeds separately. Deposits are credited against the final payment, and closing proceeds are scheduled no earlier than construction completion for the relevant unit type or phase.
🏗️ PLAN CONSTRUCTION SPEND AND FUNDING
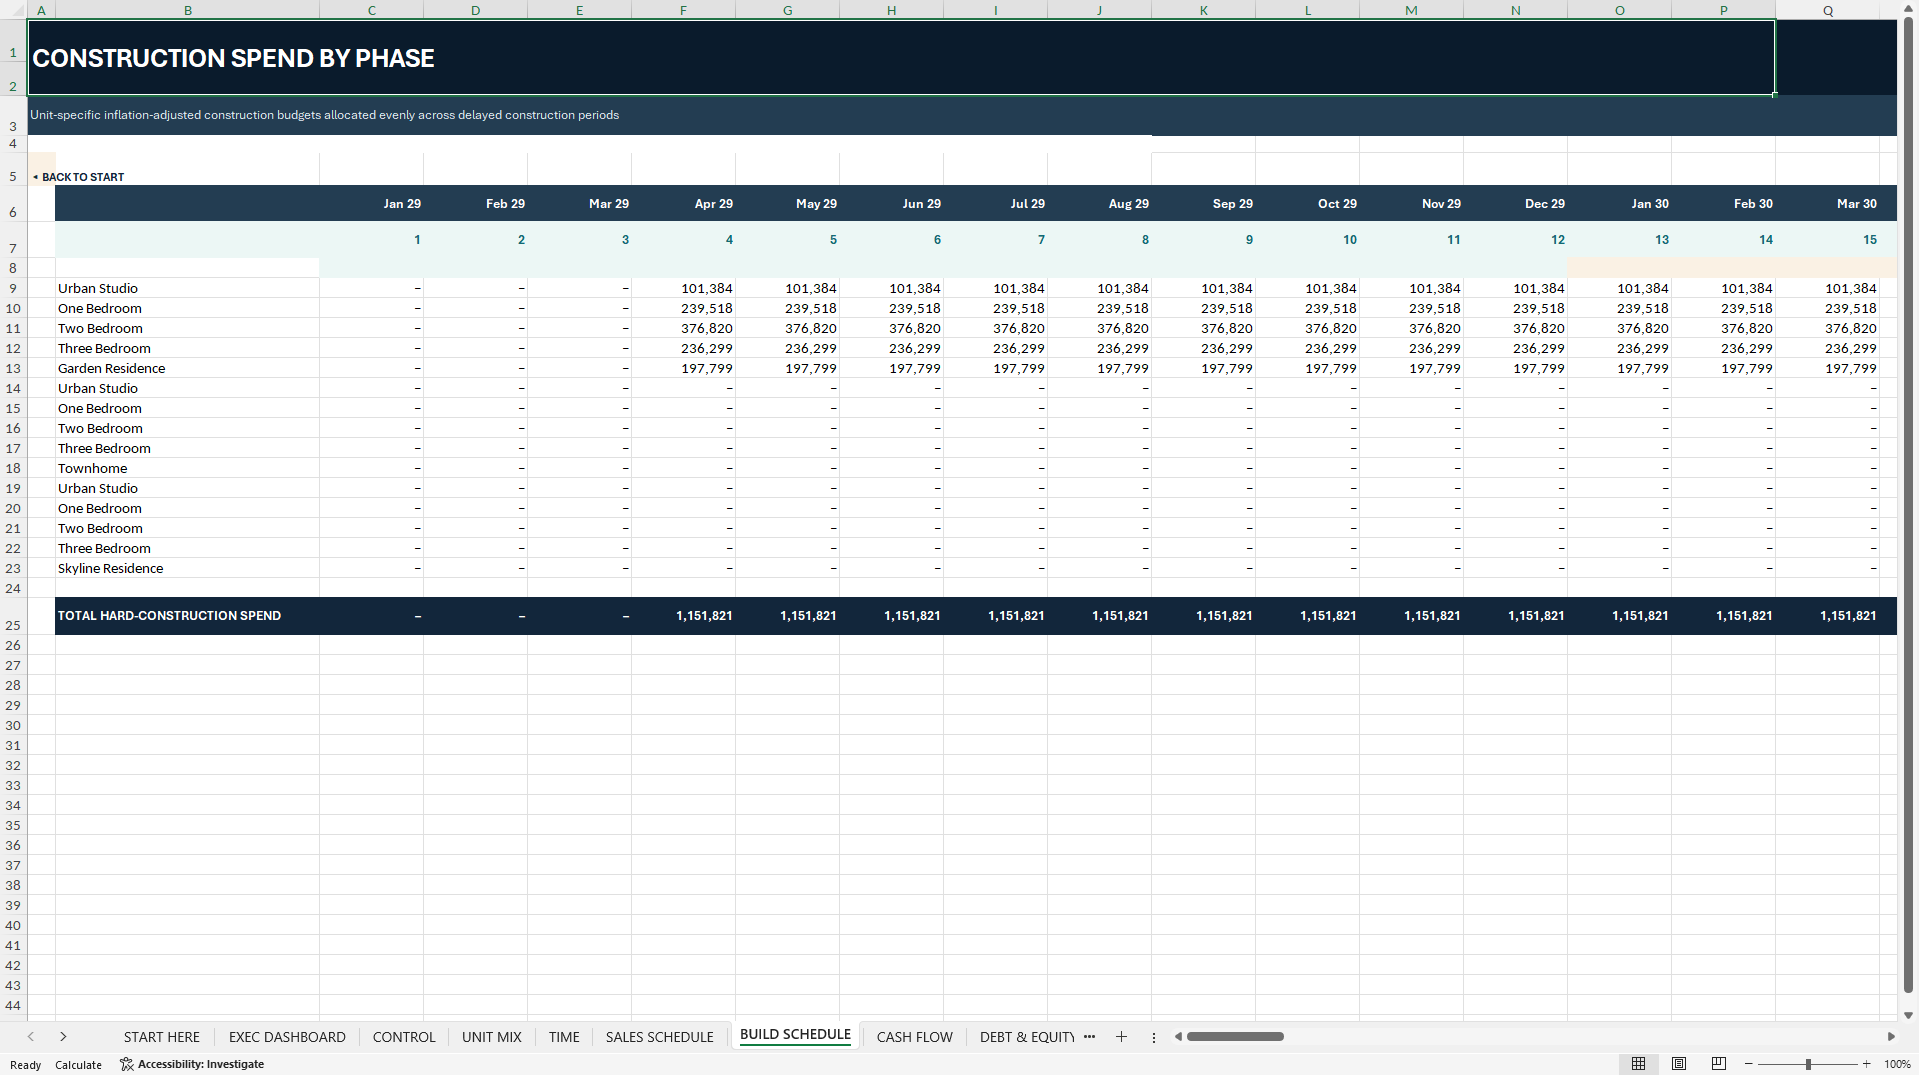
Schedule land acquisition costs, planning and permits, site works, hard and soft costs, contingencies, overhead and selling expenses. Review monthly project cash flow and ten annual reporting periods.
Follow senior debt draws, interest, repayments, sponsor equity contributions and distributions through a simplified financing waterfall. Review annualised equity IRR, unlevered project IRR, the equity multiple, peak senior debt and any debt remaining at project completion.
💰 TEST THE LAND BID
Estimate residual land value by deducting non-land costs, required developer profit and simplified financing allowances from completed development value. Compare the supportable land bid with the asking price. Negative residual values remain visible, so an unfavourable result is not hidden.
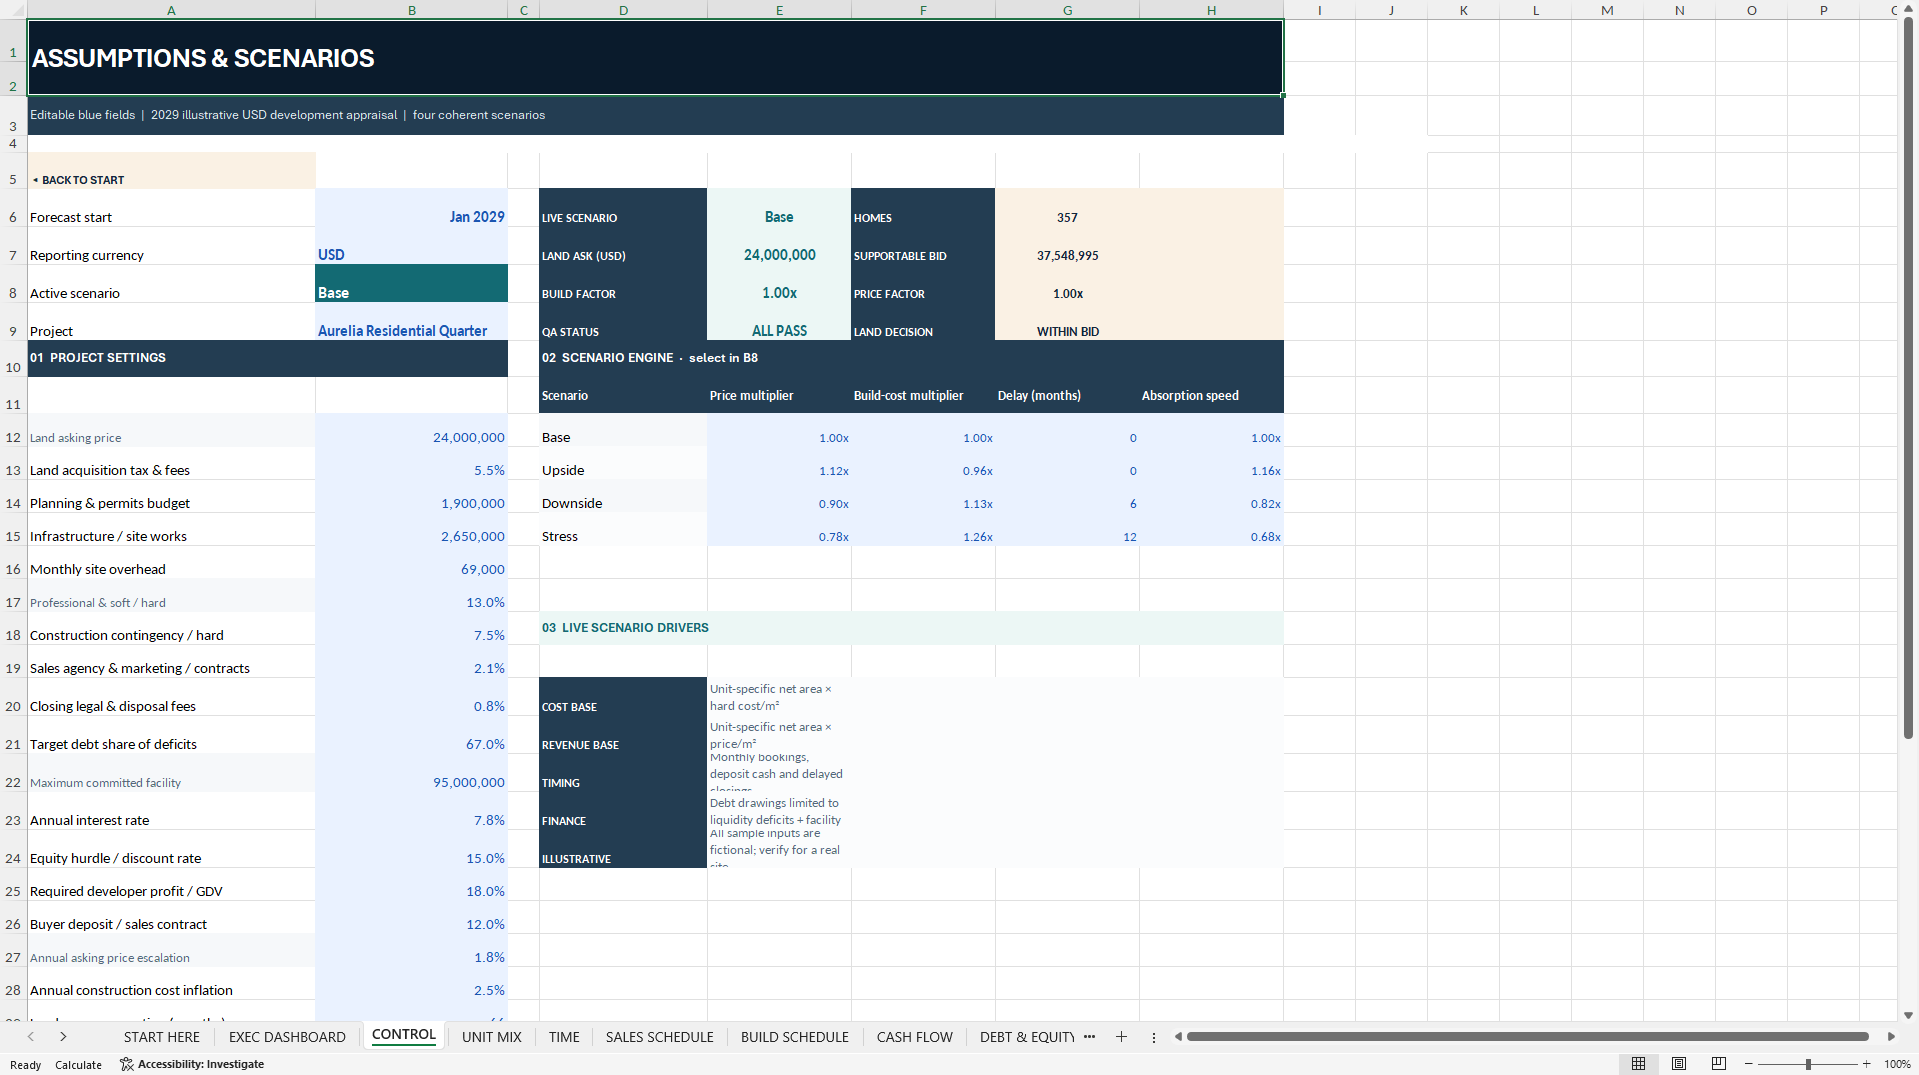
Switch between Base, Upside, Downside and Stress to test changes in selling prices, construction costs, timing and sales absorption. A separate 7 × 7 sensitivity matrix estimates residual land value across 49 price and cost combinations. The matrix does not rerun the full monthly financing schedule for every combination.
📊 REVIEW THE DASHBOARD AND MODEL CHECKS
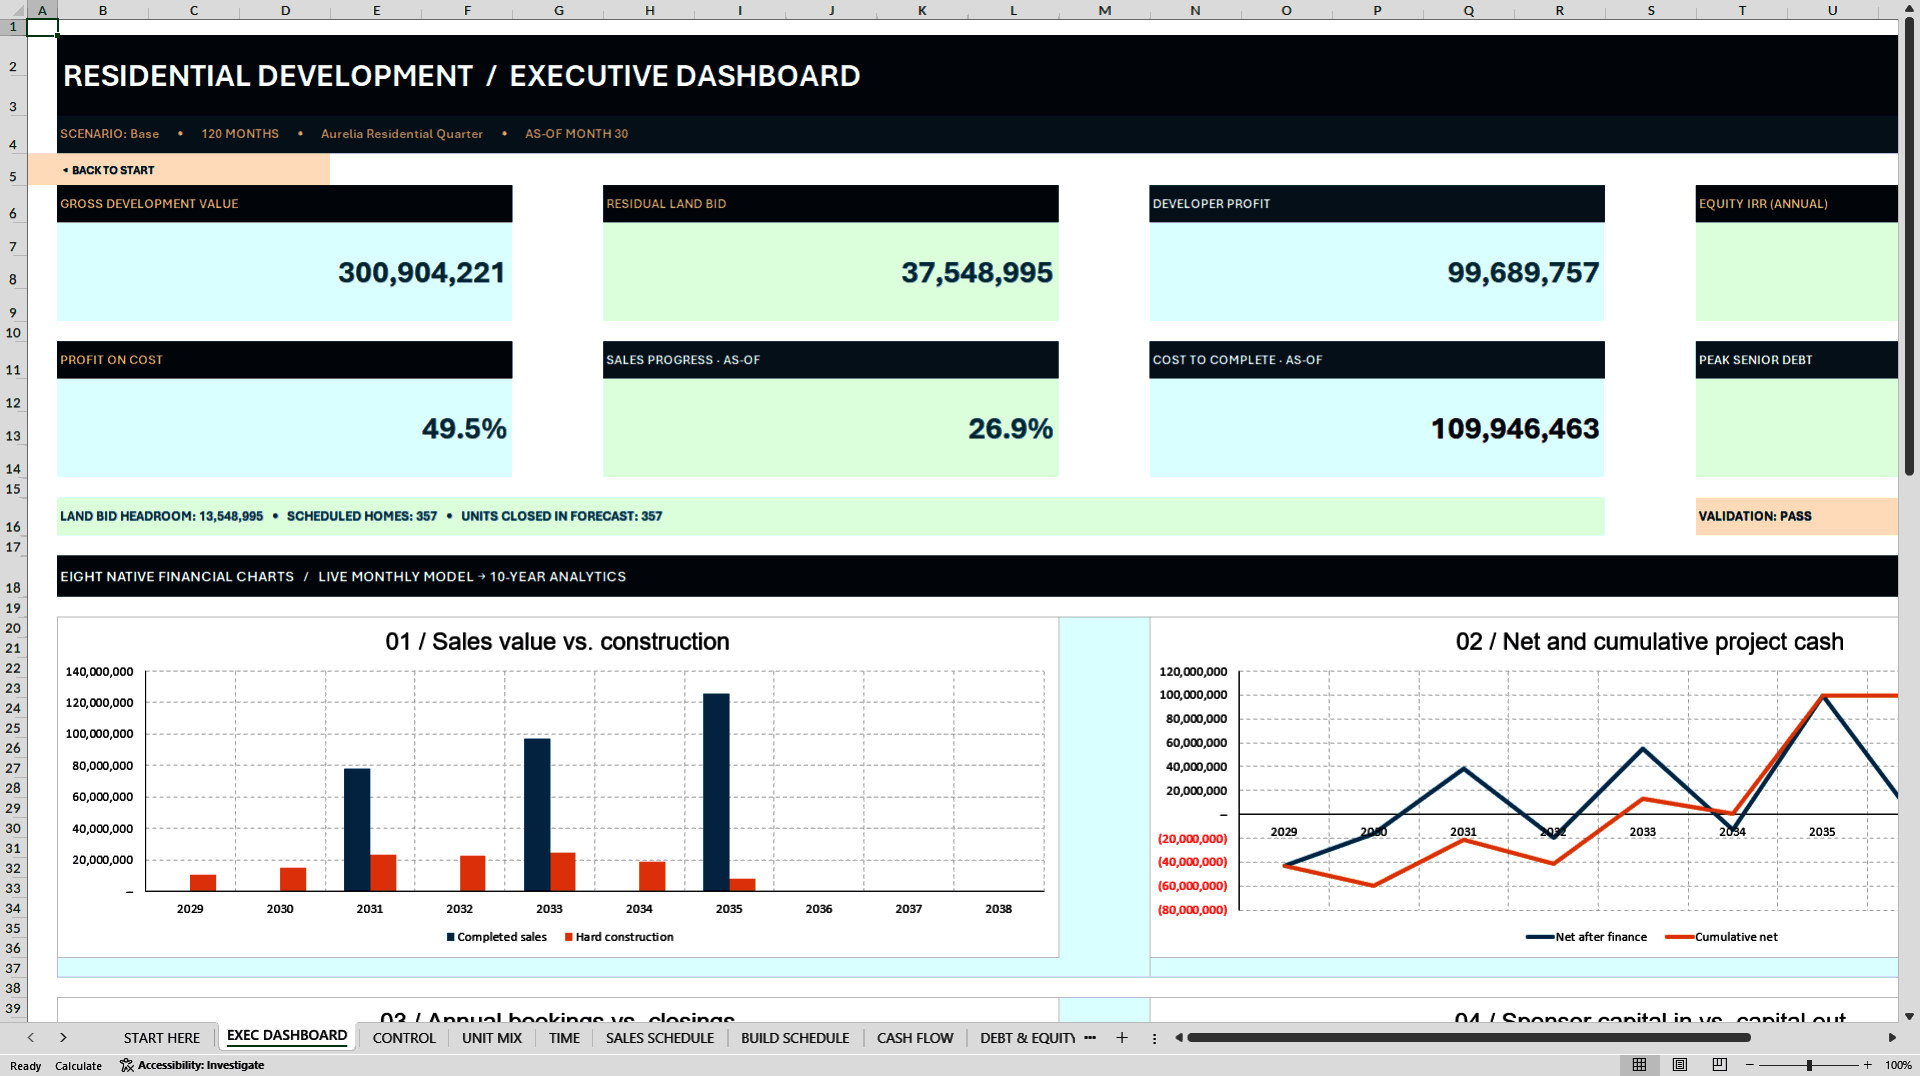
Use eight native Excel charts and eight headline indicators to review development value, profitability, sales progress, cost-to-complete, debt and land-value sensitivity. The 18 model checks help identify calculation inconsistencies and flag issues such as unsold units, outstanding debt, land-price shortfalls and below-target developer margins.
📦 WHAT YOU RECEIVE
Primary Document – Editable, macro-free Excel workbook with 15 worksheets, 120 monthly periods, ten annual reporting periods, four scenarios, eight native charts and a 49-cell residual land sensitivity matrix.
Supplementary Document – 27-page English PDF guide covering setup, assumptions, sales and construction schedules, financing, returns, land valuation and troubleshooting.
⚙️ COMPATIBILITY AND SCOPE
Microsoft Excel Desktop is recommended. The workbook was recalculated in LibreOffice Calc. Microsoft Excel Desktop and Google Sheets import were not tested. No external data connections are required. The illustrative period is 2029–2038. Changing the currency label does not convert amounts.
Designed for one residential build-to-sell project. It does not model rental operations, escrow restrictions, full three-statement accounting, jurisdiction-specific taxes or advanced lender covenants.
This independent, unofficial SheetworksStudio template uses fictional sample data. It is not an appraisal, lender approval or investment recommendation. A passing model check does not establish project feasibility or guarantee returns. Digital product only.
Got a question about the product? Email us at support@flevy.com or ask the author directly by using the "Ask the Author a Question" form. If you cannot view the preview above this document description, go here to view the large preview instead.
Source: Best Practices in Real Estate, Integrated Financial Model Excel: Residential Development Financial Model - 10-Year Excel Excel (XLSX) Spreadsheet, SheetworksStudio
ABOUT THE AUTHOR

SheetworksStudio creates premium Excel-based business templates, dashboards, trackers, financial models, and management systems for professionals, consultants, entrepreneurs, and organizations.
Our portfolio covers finance, project management, operations, risk management, compliance, AI governance, HR, supply chain, performance management, and business planning. Each product is designed to
... [read more]
Ask the Author a Question
You must be logged in to contact the author.