 Click main image to view in full screen. Unlock all 12 preview images:
Private School Financial Model – Excel XLSX
Excel (XLSX) + supplemental PDF


BENEFITS OF THIS DOWNLOADABLE EXCEL DOCUMENT
- 🎓 Forecast admissions and retention across 15 grade levels while keeping enrollment and tuition within available classroom capacity.
- 🏫 See how scholarships, stepwise teacher hiring and campus expansion affect operating margins, working capital and funding across three linked financial statements.
- 📊 Test four scenarios and review cash shortfalls, break-even enrollment, DCF enterprise value and illustrative equity IRR in one ten-year model.
EDUCATION EXCEL DESCRIPTION
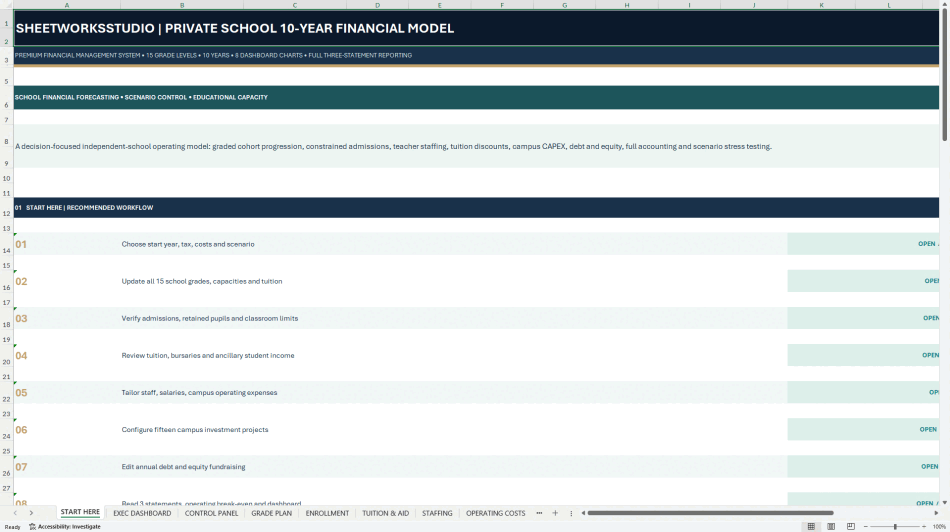
🎓 PRIVATE SCHOOL FINANCIAL MODEL
Connect enrollment, classroom capacity and tuition to ten years of financial performance.
How many students can your school accommodate, how many teachers will it need, and can tuition and other revenue cover the cost of expansion? This editable Excel model brings those decisions into one annual forecast. It links grade-by-grade enrollment, scholarships, staffing, campus investment and financing to three financial statements, break-even enrollment and illustrative valuation.
Designed for private school founders, operators, finance directors and education consultants, the workbook uses fictional inputs you can replace with your own admissions assumptions, fee schedules, staffing plans and funding terms.
🏫 ENROLLMENT, RETENTION & CLASSROOM CAPACITY
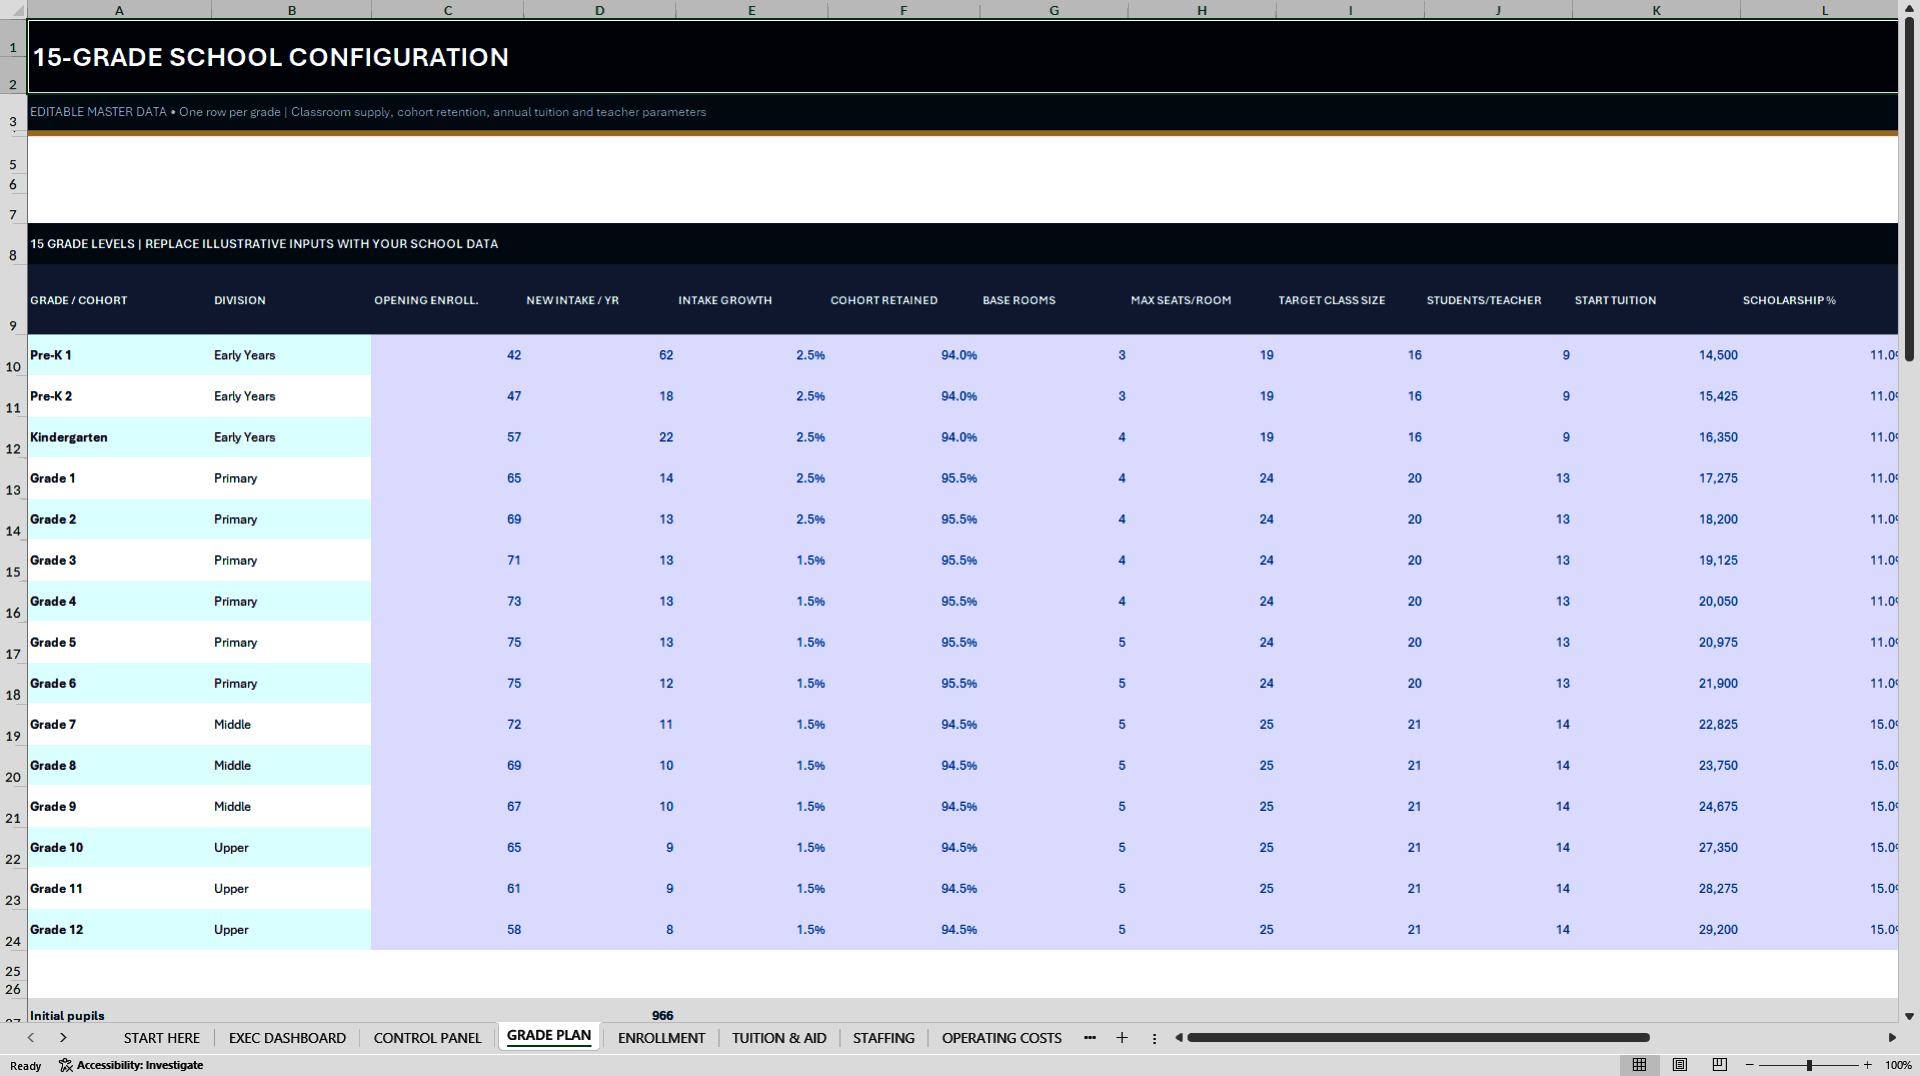
Plan 15 grade levels from Pre-K 1 and Pre-K 2 through Kindergarten and Grade 12. Enter opening enrollment, new intake, admissions growth, retention, classrooms, seats and planned classroom additions.
Follow student progression between grades and see where demand exceeds available places. Admissions are capped by grade-level capacity. Excess demand is shown as potential waitlist demand and does not become enrollment or tuition revenue.
💳 TUITION, SCHOLARSHIPS & OPERATING REVENUE
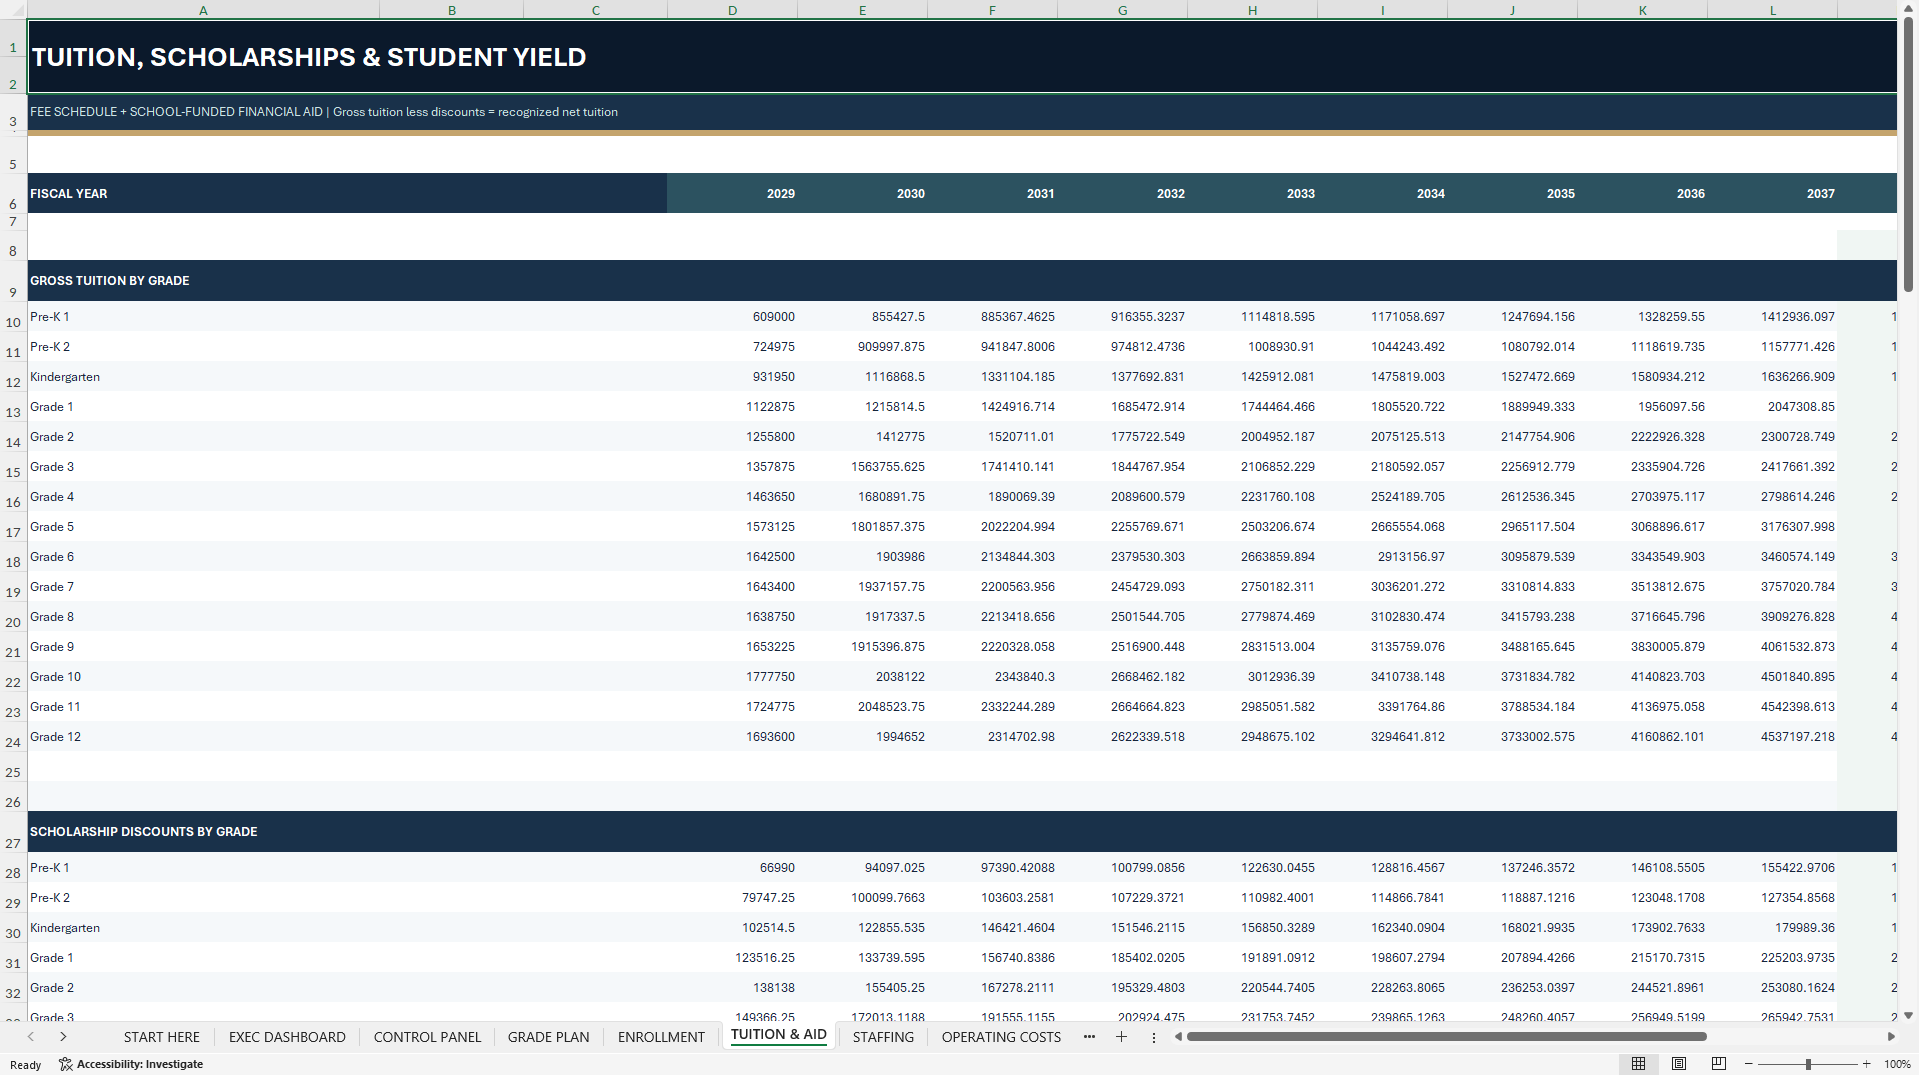
Set grade-level tuition and annual fee escalation. Review gross tuition, scholarship deductions, net recognized tuition, ancillary student-service fees and operating grant revenue.
School-funded scholarships reduce recognized tuition rather than being counted again as an operating expense. Net tuition per student helps you assess how fee increases and financial aid affect the revenue actually earned per enrolled pupil.
👥 FACULTY, SUPPORT STAFF & OPERATING COSTS
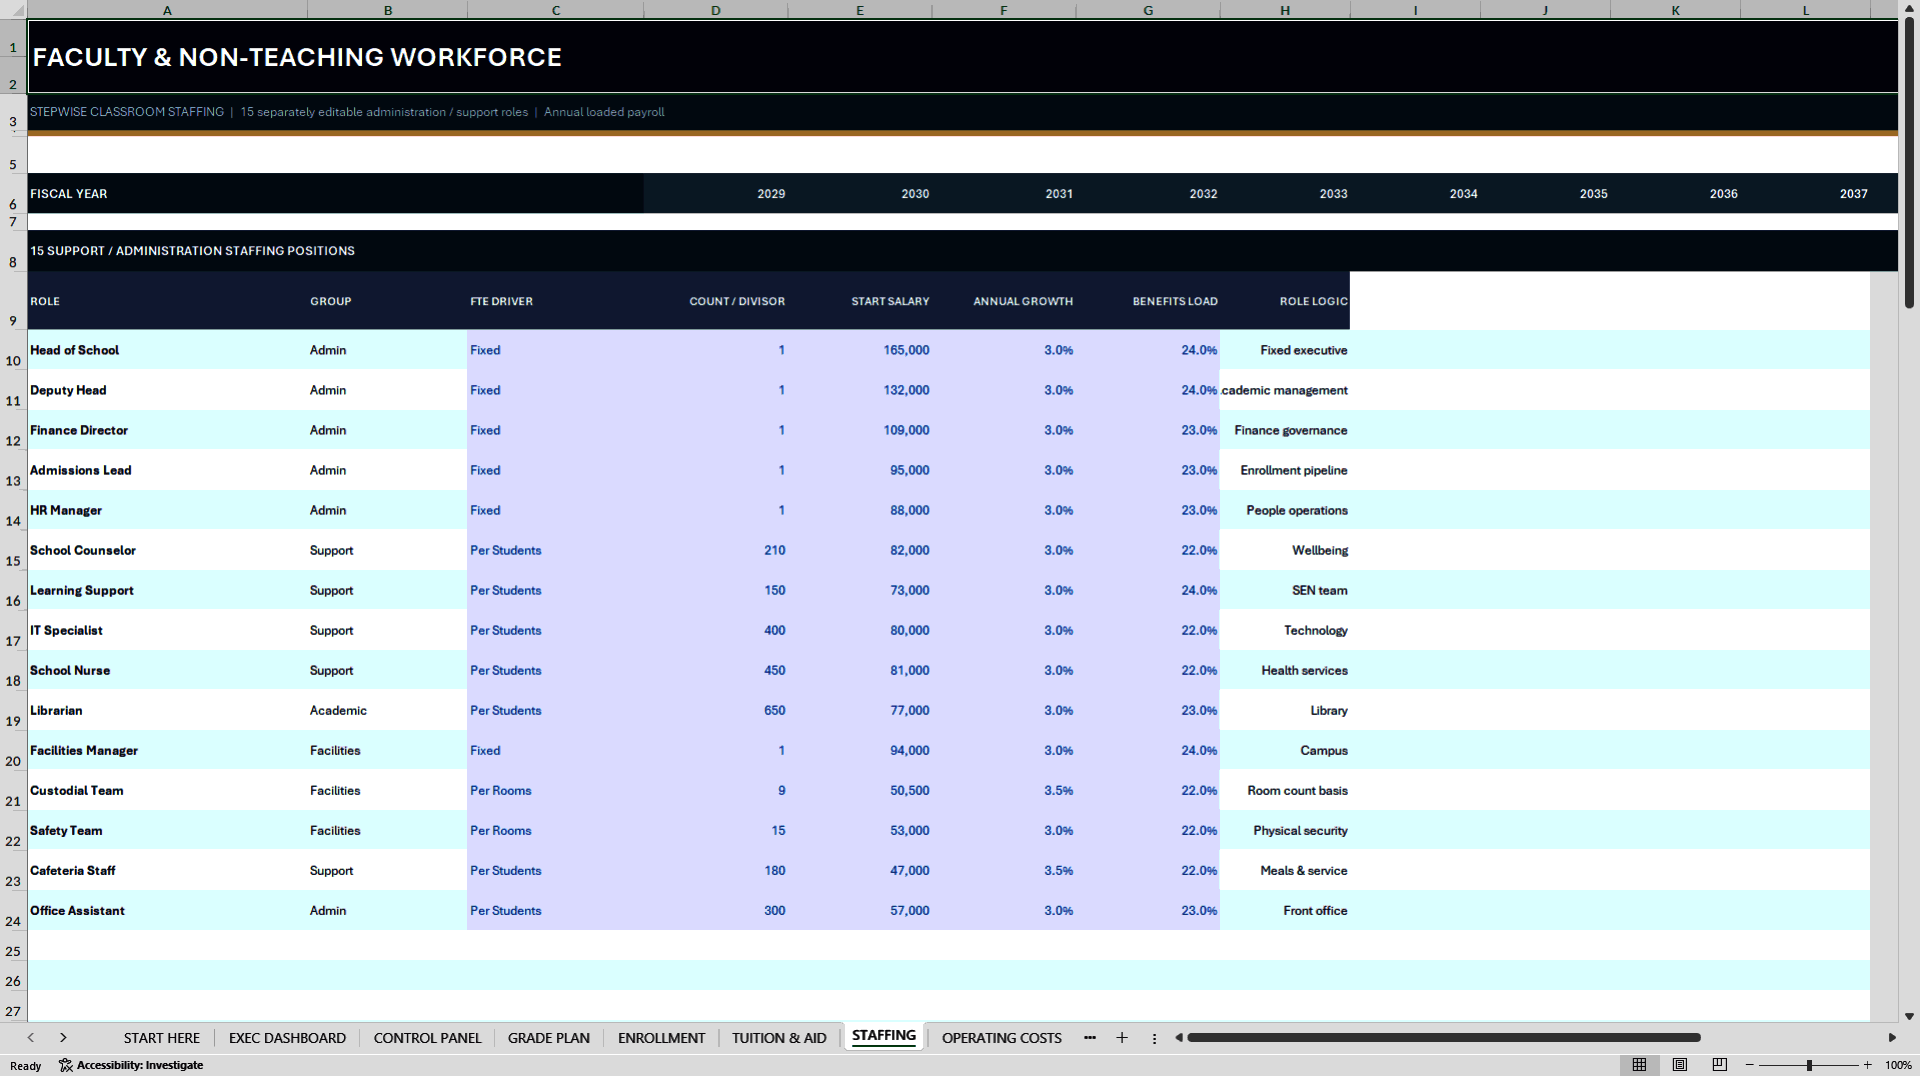
Estimate teacher full-time equivalents (FTE) from classroom coverage and target student-to-teacher ratios. Faculty requirements change in steps, so opening another classroom can trigger a staffing increase even when enrollment grows gradually.
The workbook includes 15 editable administrative and support-role profiles and 15 operating-cost categories. Set expenses using fixed amounts or drivers tied to pupils, classrooms, staff or tuition, depending on the cost category.
🏗️ CAMPUS CAPEX, DEBT & FUNDING
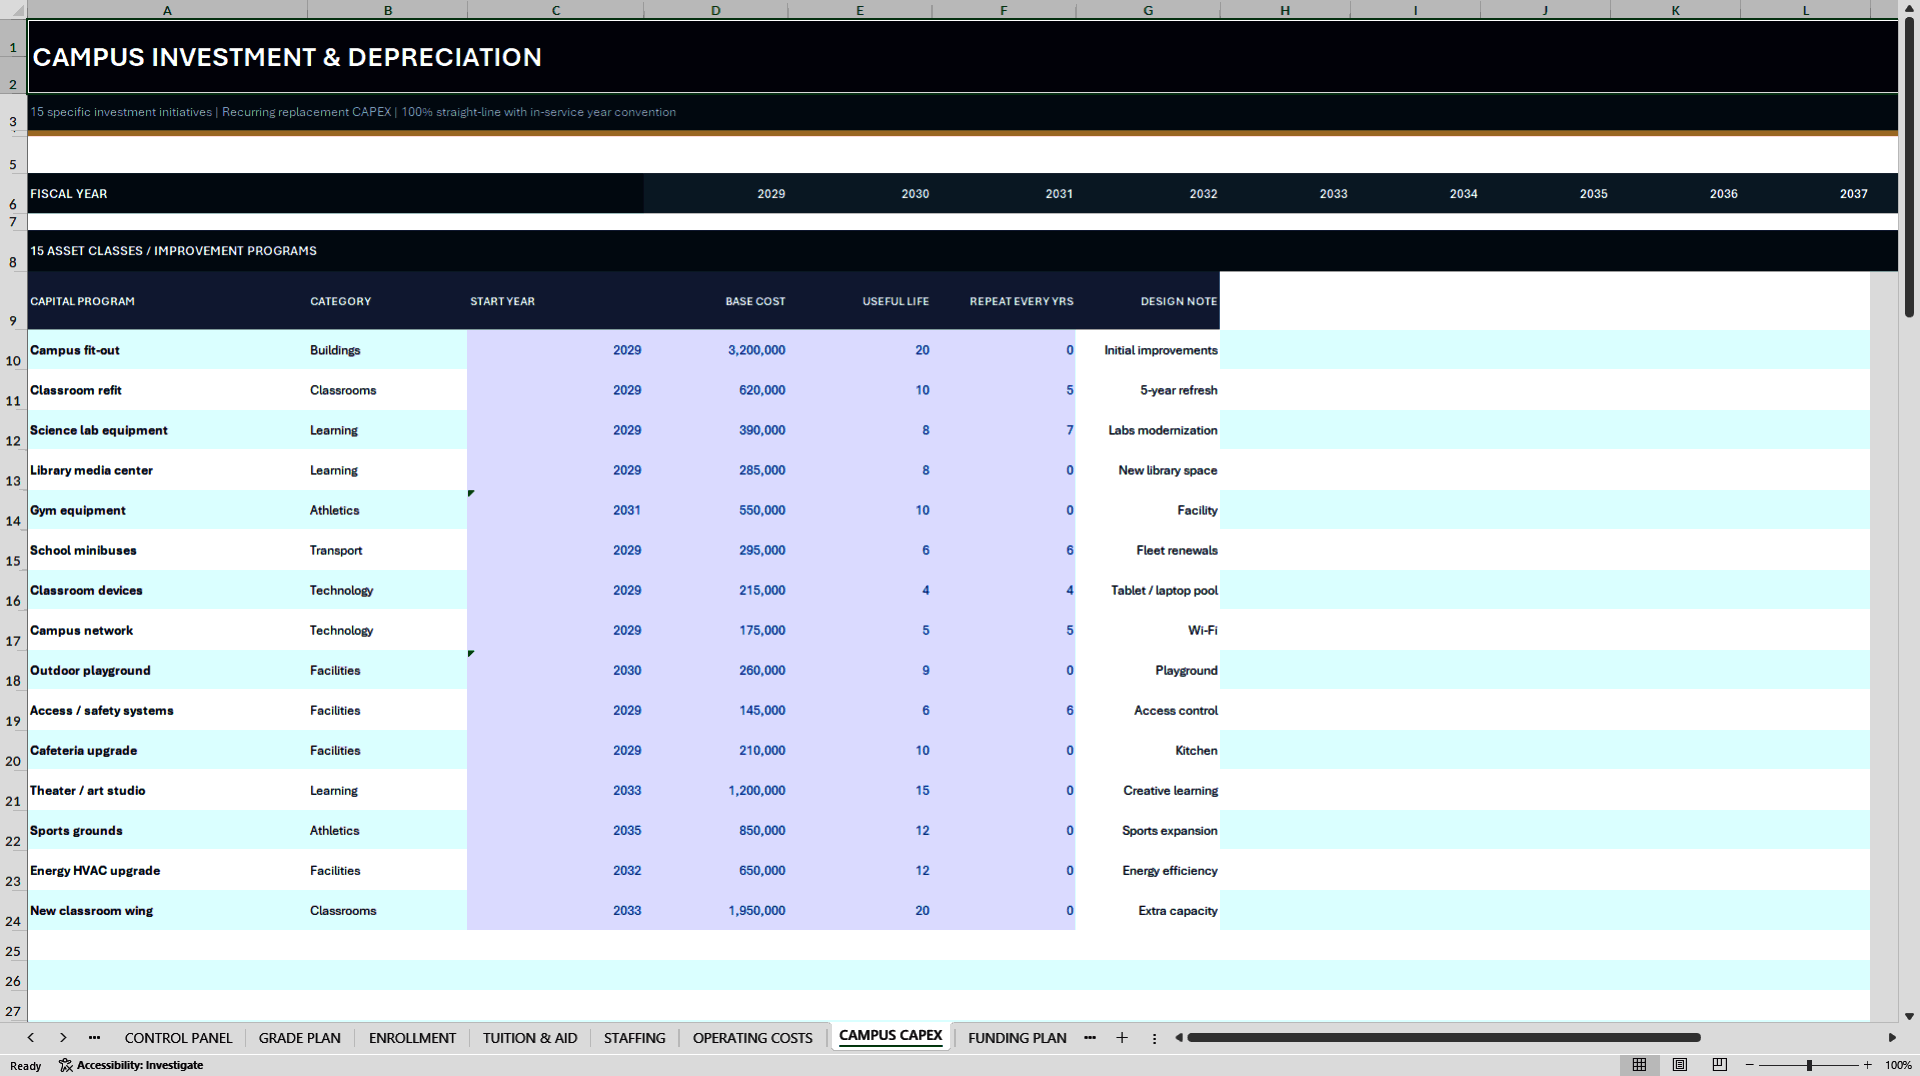
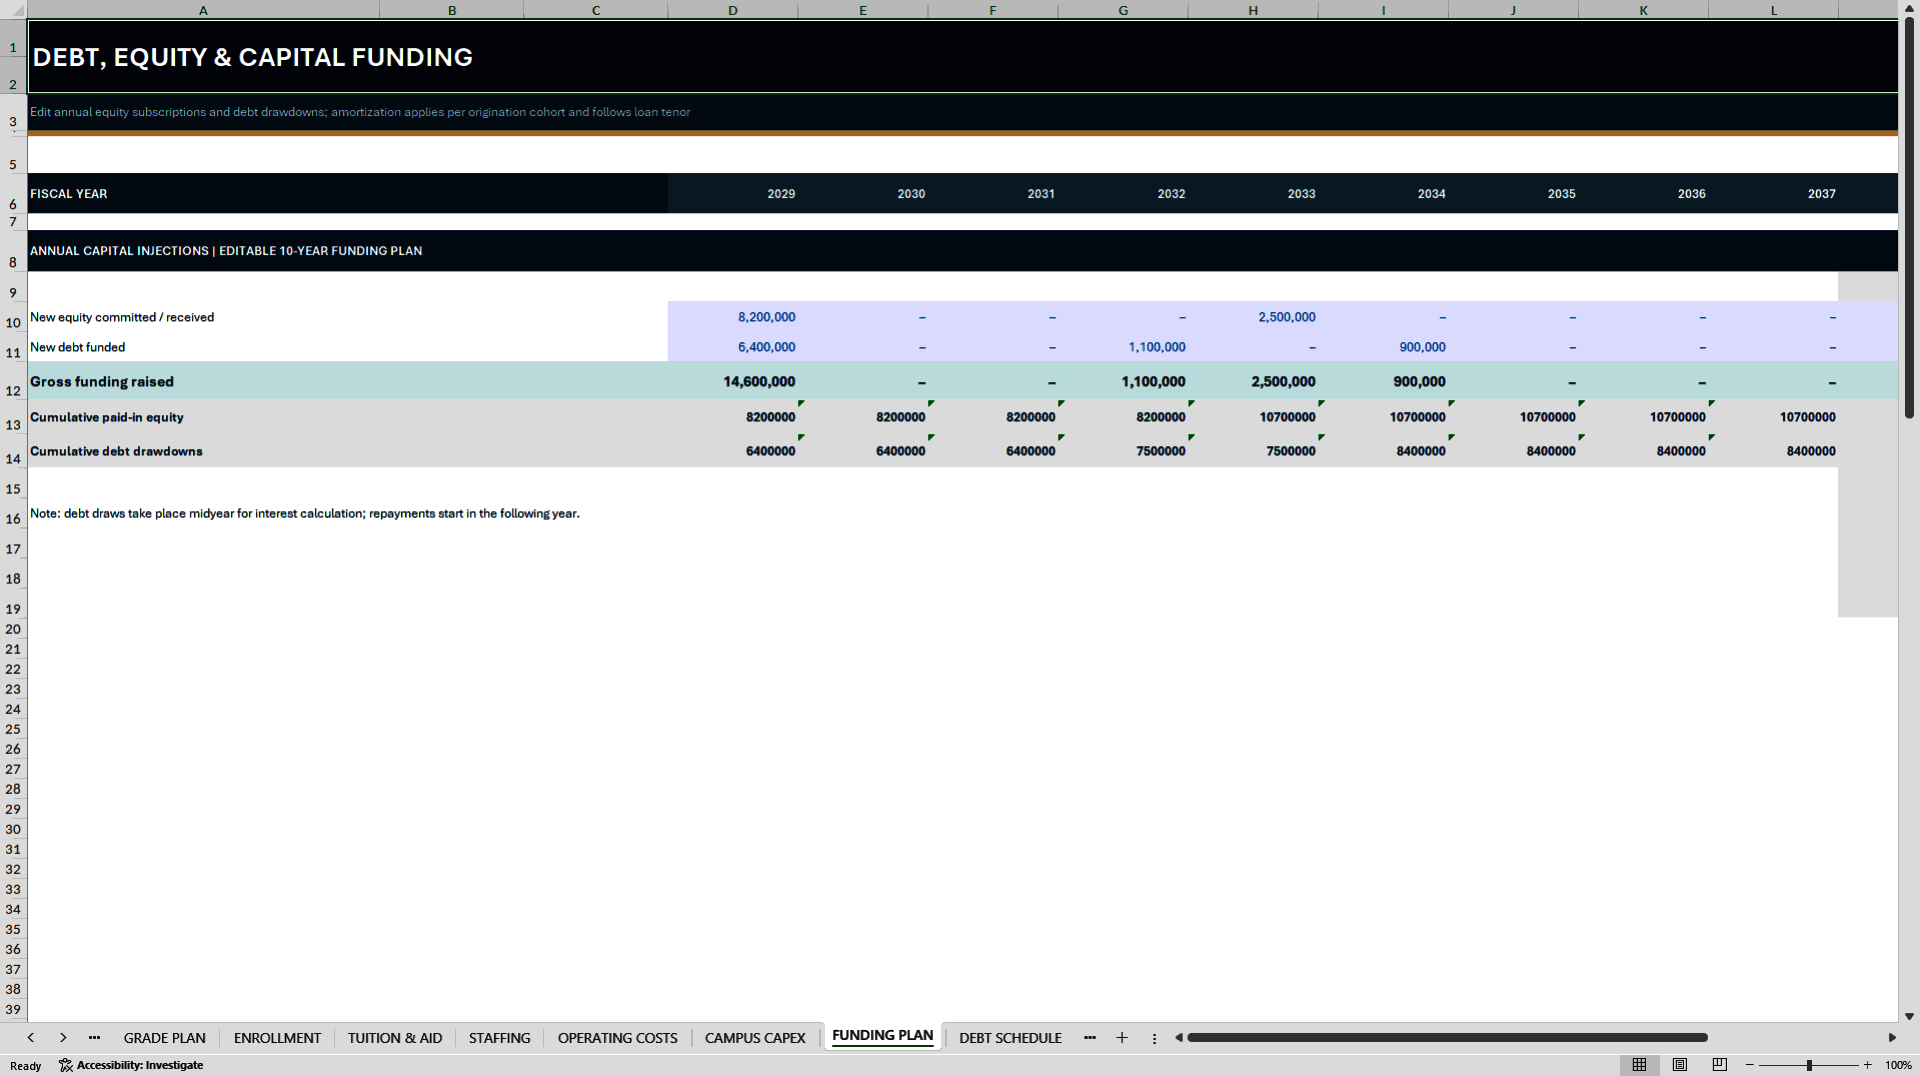
Plan capital outlays using 15 illustrative campus investment programs covering facilities, classrooms and educational equipment. Track capital spending and depreciation through the financial statements. Model annual equity contributions, loan drawdowns by borrowing vintage, scheduled principal repayment and interest.
Campus spending and physical seat capacity are separate assumptions. To add seats, enter the classroom expansion in GRADE PLAN as well as budgeting the investment. The debt-service coverage indicator is simplified and does not represent a lender-defined covenant calculation.
📑 THREE LINKED FINANCIAL STATEMENTS
• Income Statement – Tuition, ancillary and grant revenue, personnel, operating expenses, EBITDA, depreciation, interest, tax and net income.
• Cash Flow Statement – Cash from operations, working-capital movements, campus investment, equity funding, borrowing, debt repayment and closing cash.
• Balance Sheet – Cash, tuition receivables, net fixed assets, payables, tuition received in advance, debt and shareholder equity.
The statements cover ten annual periods. They do not model month-by-month tuition collections.
🔀 FOUR EDITABLE SCENARIOS
Switch between Base, Upside, Downside and Stress. The selected case changes enrollment demand, tuition, scholarship levels, retention, staffing costs, operating expenses and campus CAPEX assumptions. One scenario is calculated at a time.
With the included fictional assumptions, Downside has six years of negative closing cash. Stress has nine, and its indicative break-even enrollment exceeds physical capacity throughout the forecast. These results illustrate funding and operating risk. The model does not automatically add funding to cover deficits.
📈 BREAK-EVEN, DCF & ILLUSTRATIVE EQUITY RETURNS
Compare the estimated break-even student count with available seats and modeled enrollment. The break-even estimate uses average student contribution and smooths the effect of teacher hiring thresholds. Read it alongside the classroom and staffing schedules.
Review the unlevered free cash flow proxy, discounted enterprise value, an EBITDA-multiple terminal value, estimated exit equity proceeds and illustrative investor IRR. Equity IRR incorporates modeled equity funding, distributions and terminal proceeds. If the cash flow series does not support a calculable IRR, the workbook displays 0% as a fallback, not as a measured return.
📊 EXECUTIVE DASHBOARD & MODEL CHECKS
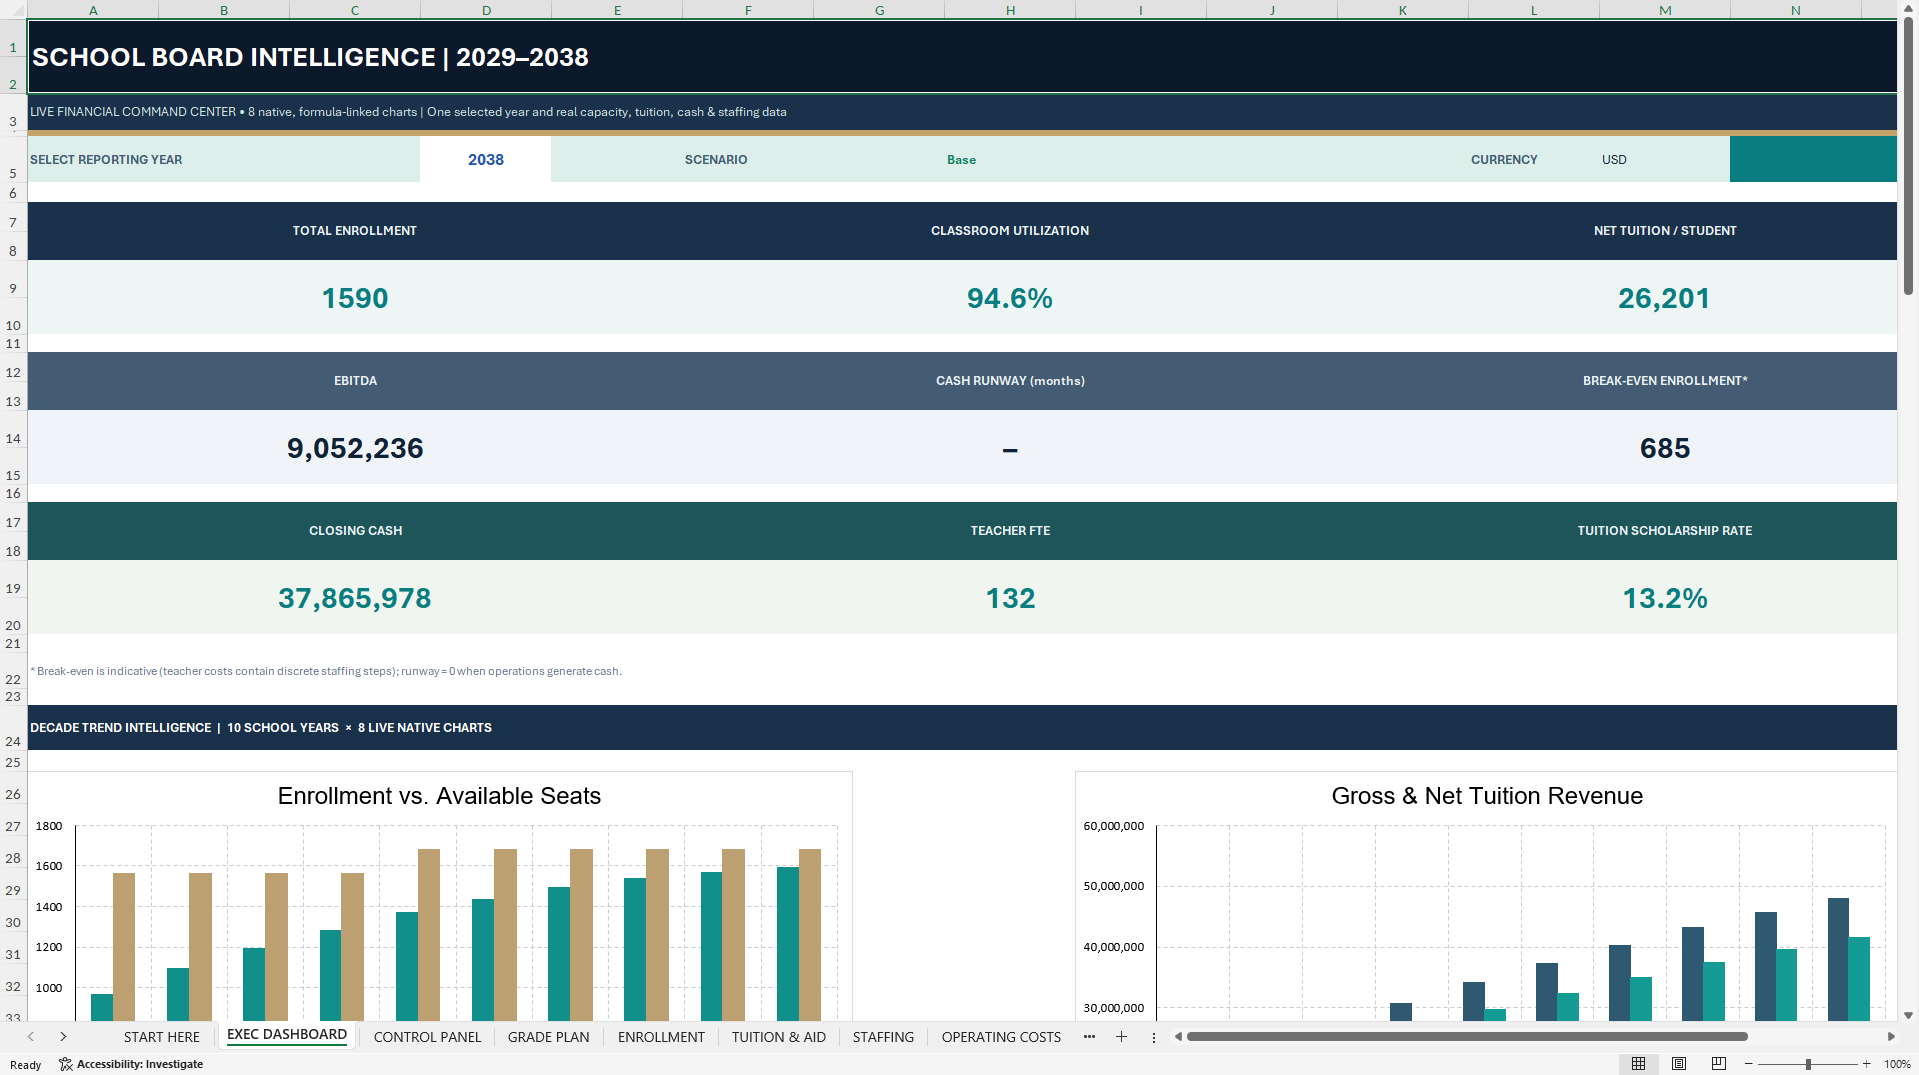
Nine KPIs show enrollment, classroom utilization, net tuition per student, EBITDA, cash runway, break-even enrollment, closing cash, teacher FTE and the tuition scholarship rate. Change the selected reporting year to review its KPIs without changing the forecast.
Eight native Excel charts cover enrollment versus seats, gross versus net tuition, scholarships versus grants, EBITDA versus net income, closing cash versus debt, instructional versus support staffing, classroom utilization versus tuition discounts, and campus CAPEX versus equity and debt raised.
MODEL CHECKS tests accounting identities, cash and debt movements, fixed assets, grade-level capacity, faculty requirements, tuition recognition, funding and working capital. Separate warning rows flag negative cash, operating losses, waitlist pressure and break-even enrollment above capacity. An internal PASS does not establish operational or financial viability.
📦 WHAT YOU RECEIVE
• One editable, macro-free Excel workbook with 19 worksheets, 10 annual forecast periods, 15 grade levels, 4 scenarios, 3 linked financial statements and 8 native dashboard charts.
• One 25-page English PDF guide covering setup, grade progression, tuition and aid, staffing, operating costs, CAPEX, debt, valuation, dashboard interpretation and troubleshooting.
🧭 GETTING STARTED
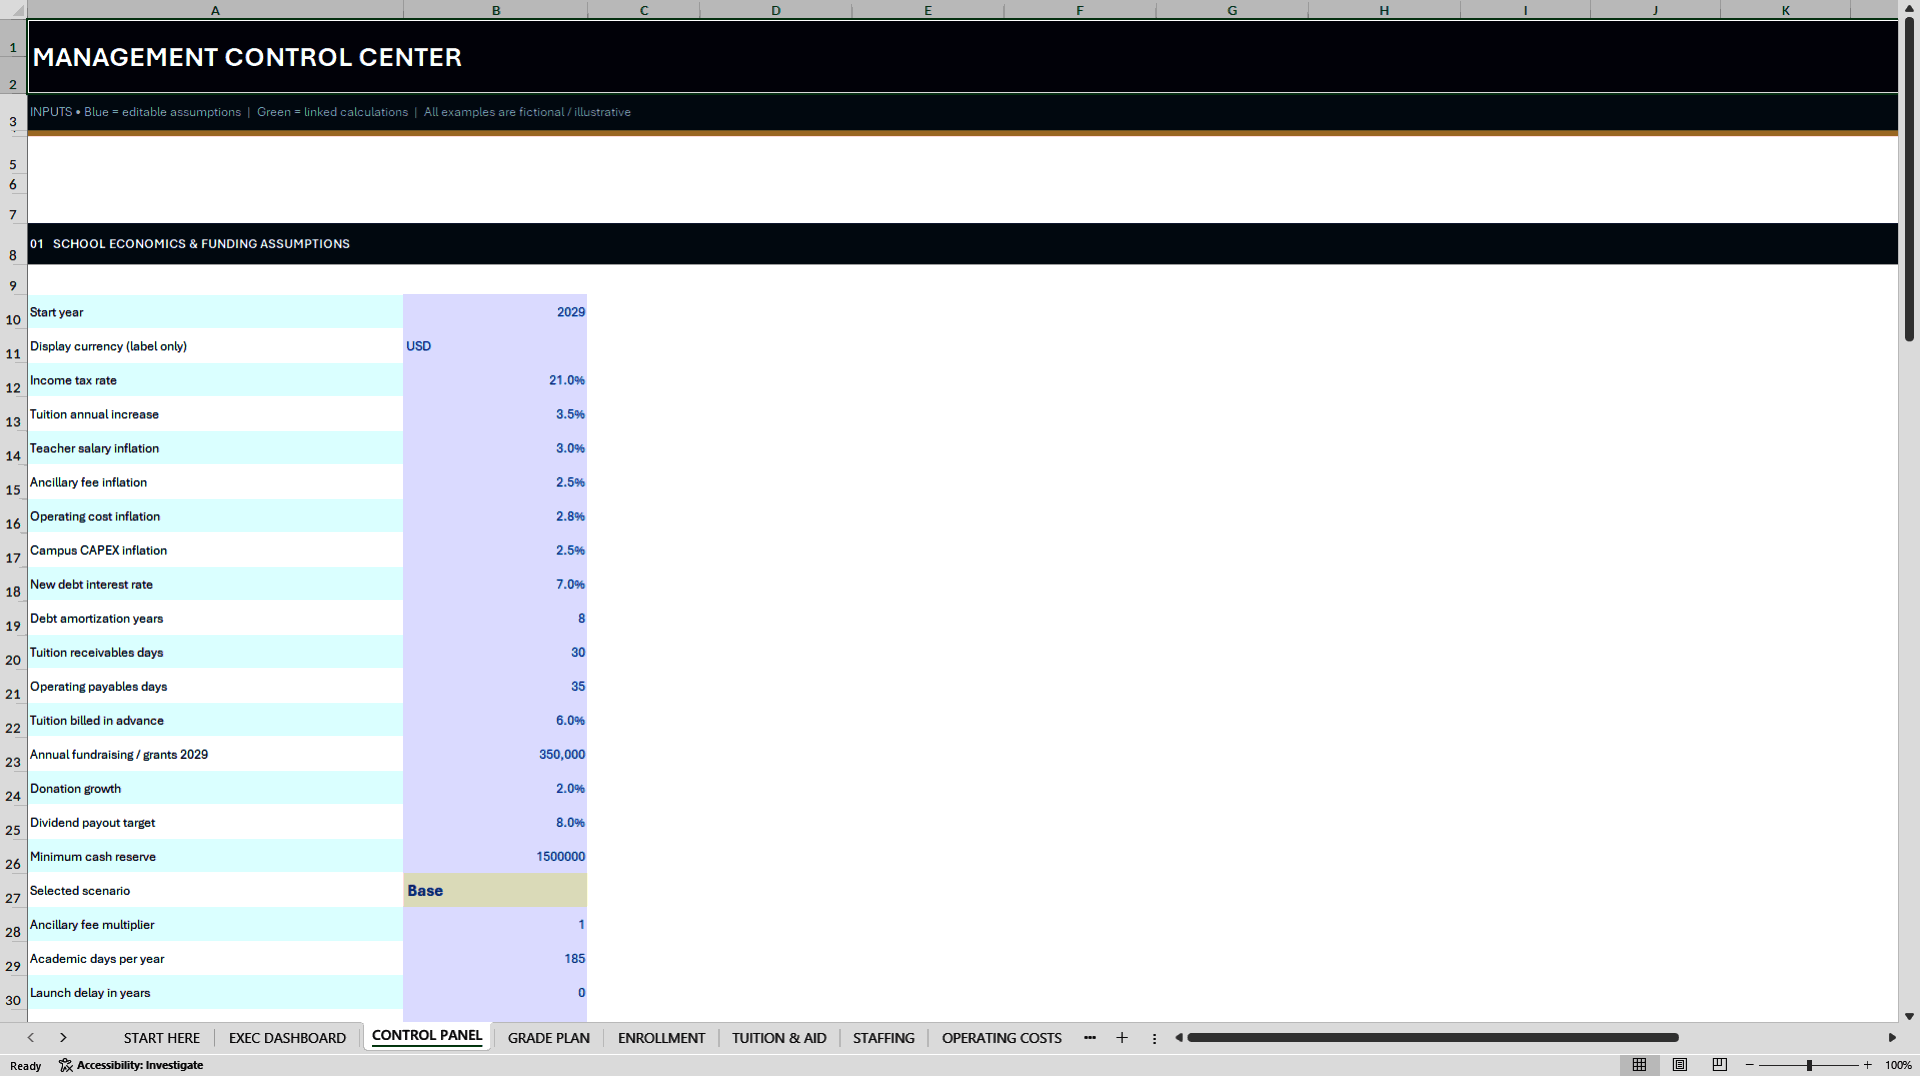
Save a working copy and open START HERE. In CONTROL PANEL, select your forecast year and scenario. Replace the fictional grade, tuition, staffing and cost inputs, then update the campus investment and funding plans. Review enrollment, cash flow, break-even and MODEL CHECKS together after each major change.
⚙️ COMPATIBILITY & SCOPE
The default example runs from 2029 to 2038. The start year is editable. The currency setting changes the display label only and does not convert amounts. The XLSX requires no VBA macros or live external data connections. Microsoft Excel Desktop is recommended. Native Excel Desktop behavior and Google Sheets import have not been independently verified.
The workbook does not include a student CRM, a certified classroom-safety assessment, full restricted-fund accounting, a comprehensive historical opening balance sheet or jurisdiction-specific tax schedules.
🛡️ INDEPENDENT TEMPLATE
Developed by SheetworksStudio as an independent, unofficial financial planning template. All sample data and projections are fictional. This is not an audited forecast, independent appraisal, regulatory certification or lender-approved model. It does not provide individualized financial, investment, accounting, tax, legal or educational regulatory advice. Validate school-specific assumptions before relying on the outputs.
Got a question about the product? Email us at support@flevy.com or ask the author directly by using the "Ask the Author a Question" form. If you cannot view the preview above this document description, go here to view the large preview instead.
Source: Best Practices in Education, Integrated Financial Model Excel: Private School Financial Model Excel (XLSX) Spreadsheet, SheetworksStudio
ABOUT THE AUTHOR

SheetworksStudio creates premium Excel-based business templates, dashboards, trackers, financial models, and management systems for professionals, consultants, entrepreneurs, and organizations.
Our portfolio covers finance, project management, operations, risk management, compliance, AI governance, HR, supply chain, performance management, and business planning. Each product is designed to
... [read more]
Ask the Author a Question
You must be logged in to contact the author.