 Click main image to view in full screen. Unlock all 12 preview images:
Live Value Stream Mapping Toolkit with Guide Book – Excel XLSX
Excel (XLSX) + supplemental PDF


BENEFITS OF THIS DOWNLOADABLE EXCEL DOCUMENT
- Keeps the value stream map alive by redrawing the current, running and future state from the data the team logs every week.
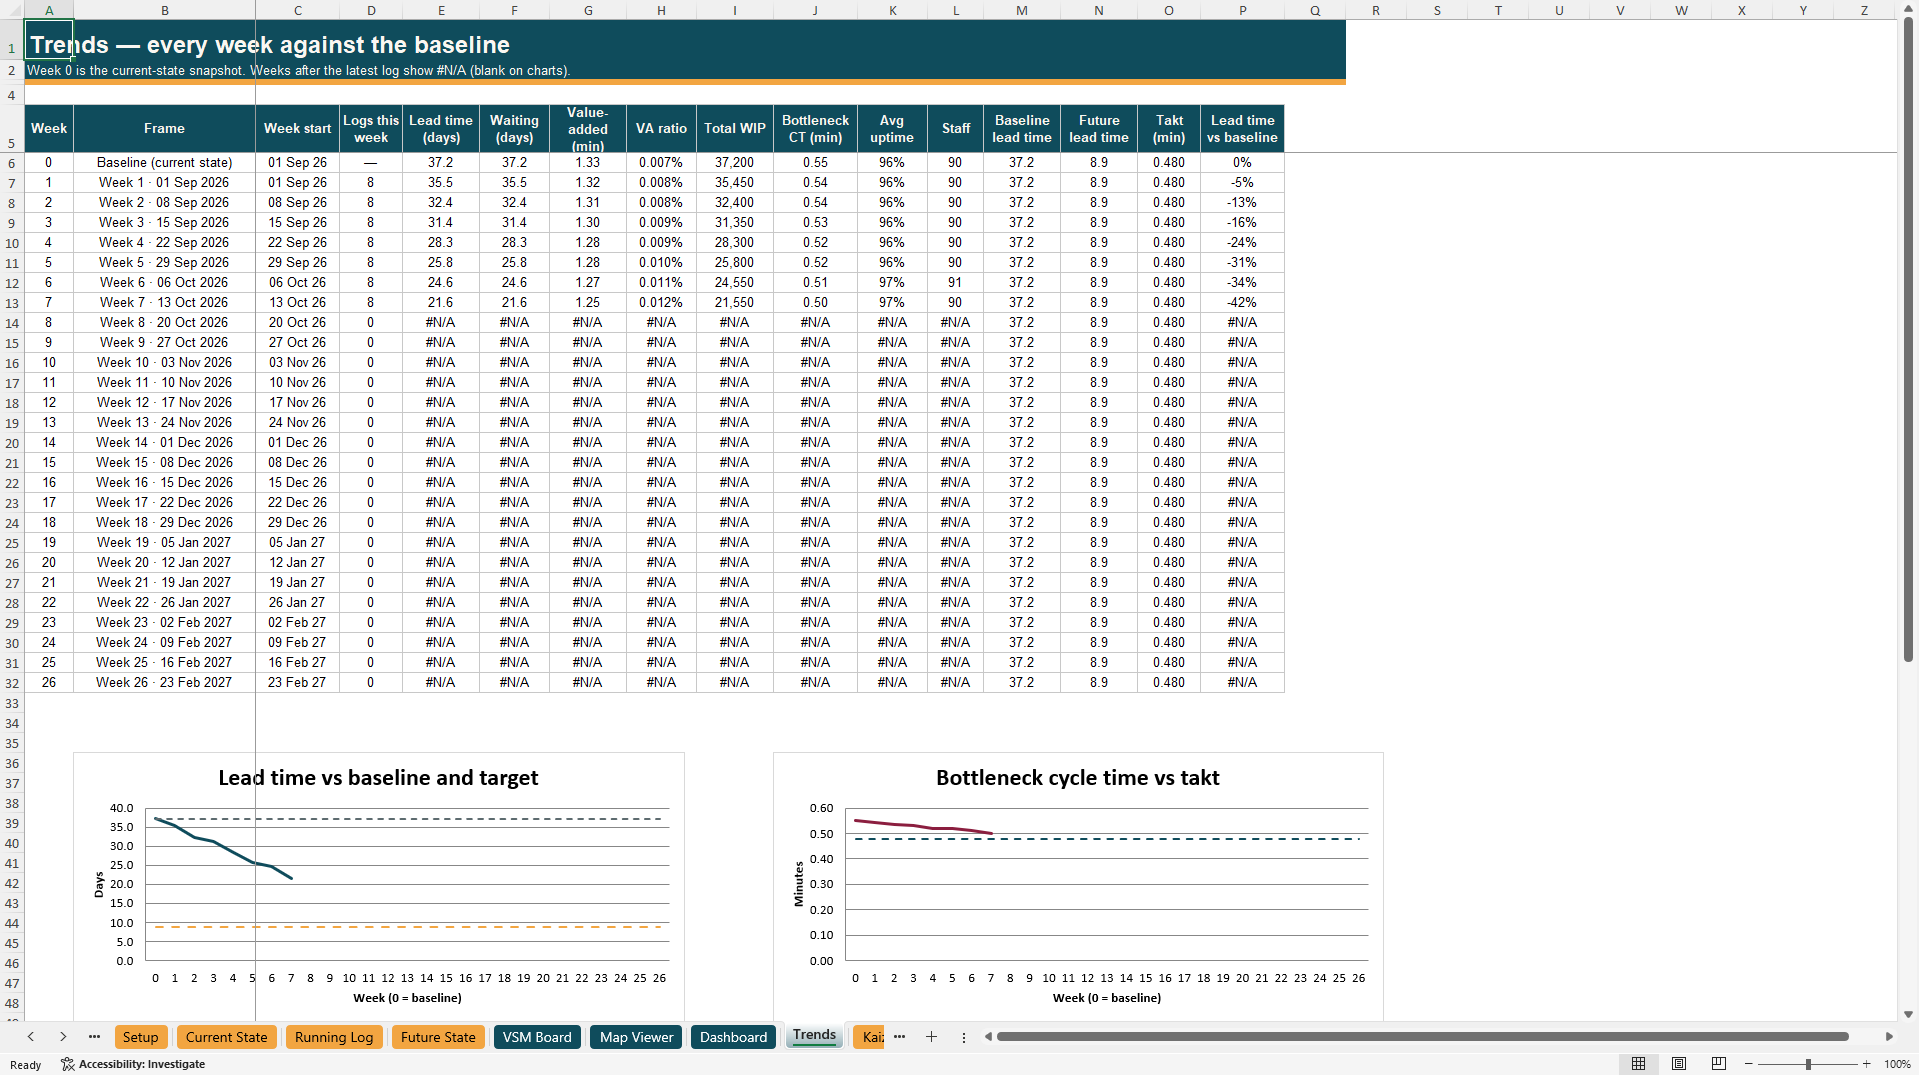
- Shows week-by-week trends against the original baseline for lead time, waiting, value-added ratio, WIP, bottleneck and uptime.
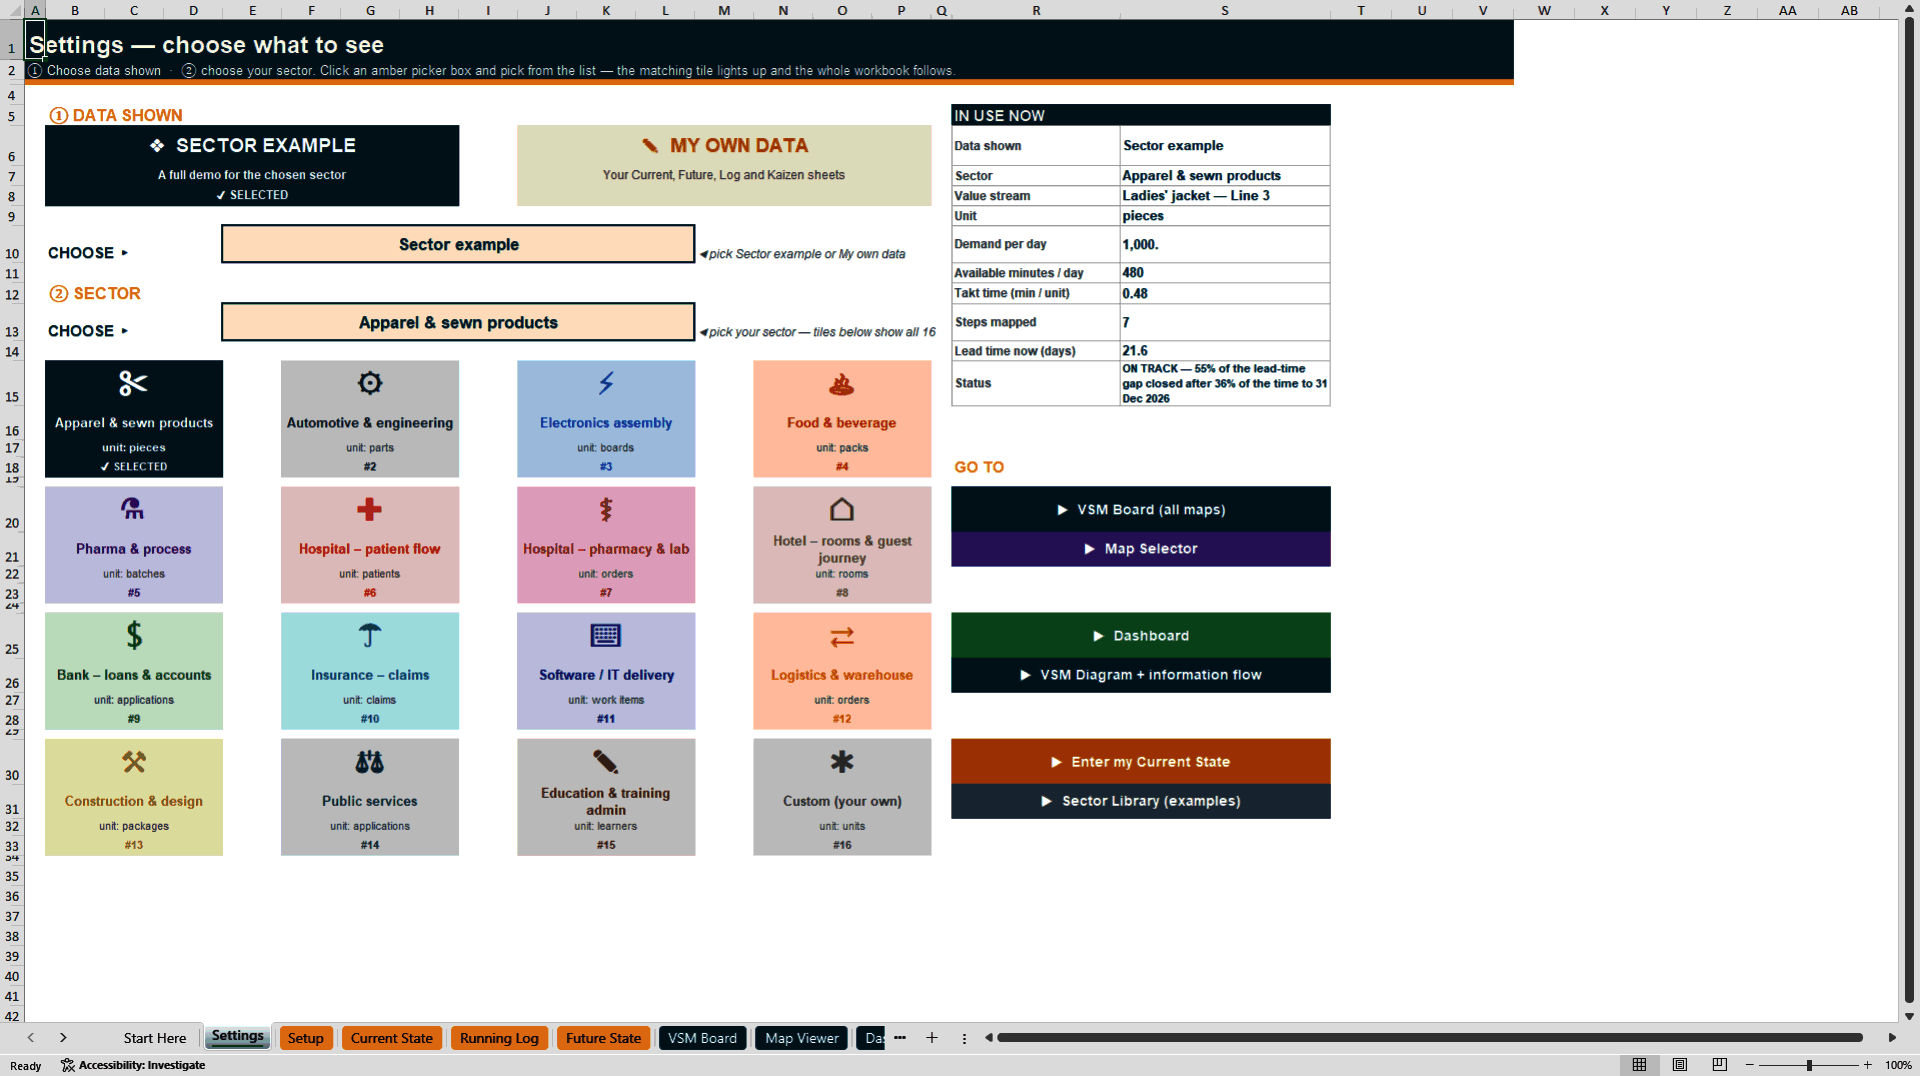
- Works in 16 sectors, from factories to hospitals, banks and software teams, with units and wording that follow the chosen sector.
LEAN MANAGEMENT EXCEL DESCRIPTION
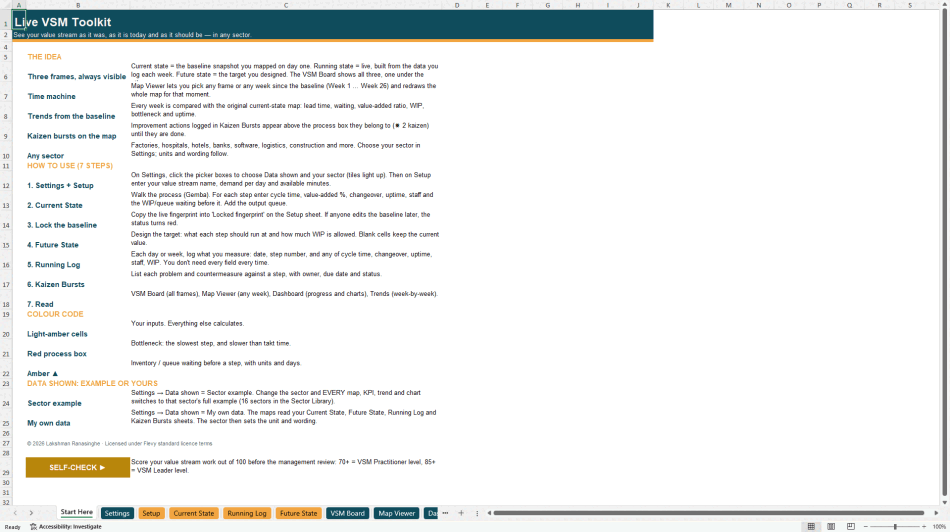
Most value stream maps are drawn once. A team spends two days walking the floor, agrees a strong future state, and three months later nobody knows whether the value stream is any closer to it. The map has become a poster on the wall. The Live VSM Toolkit keeps the map alive inside a single Excel workbook.
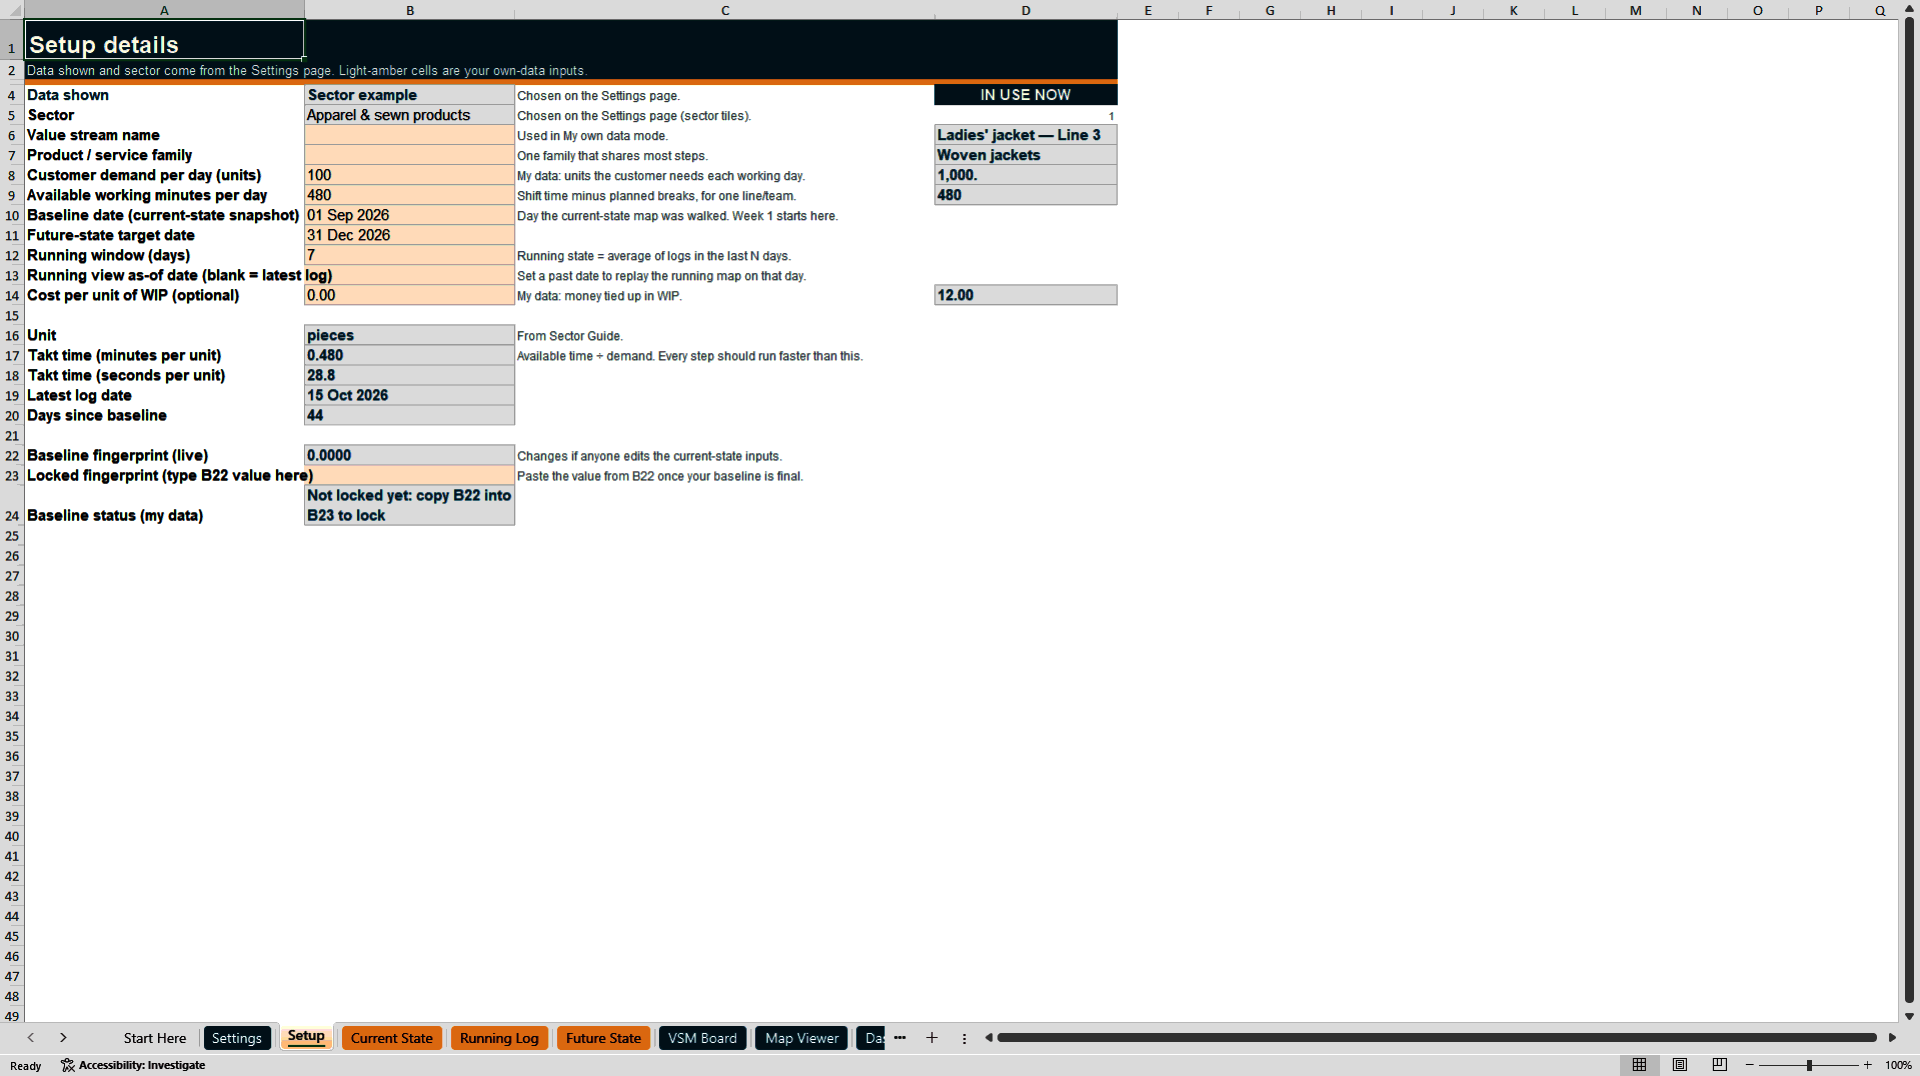
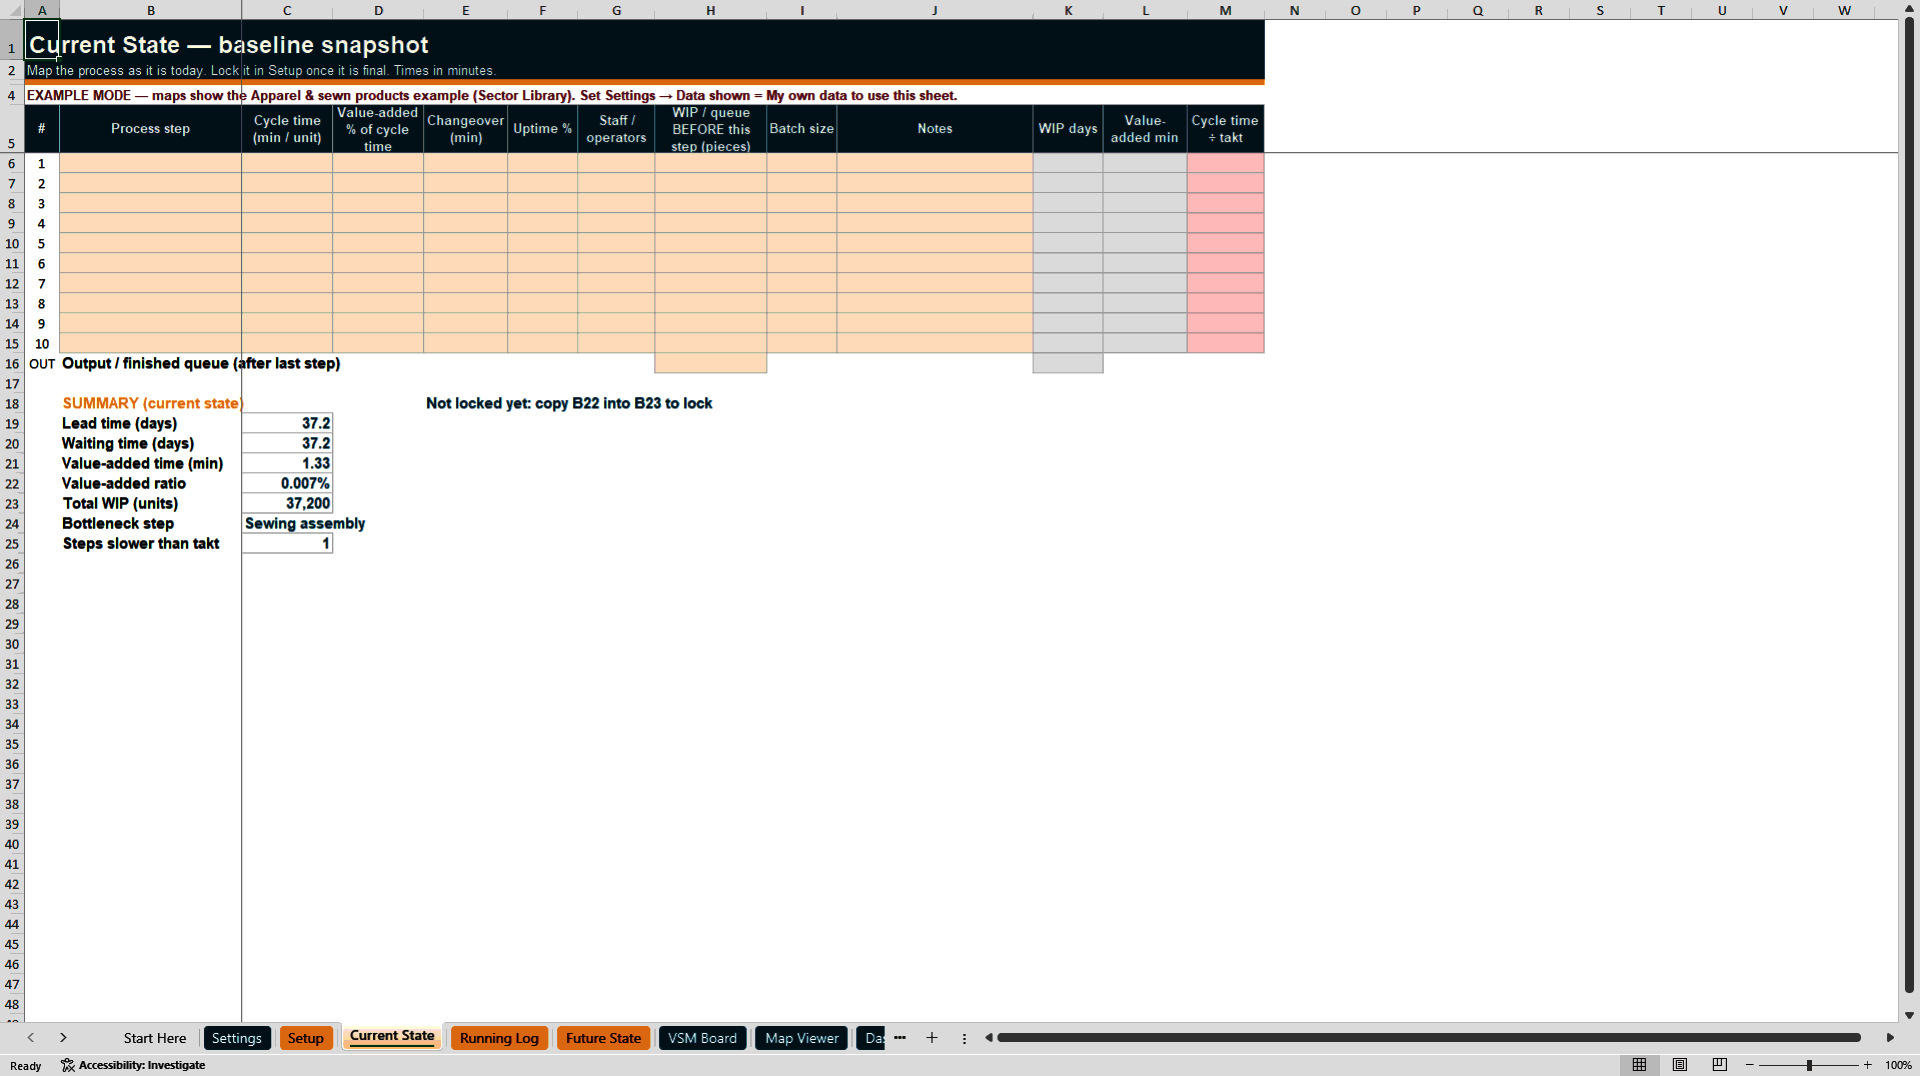
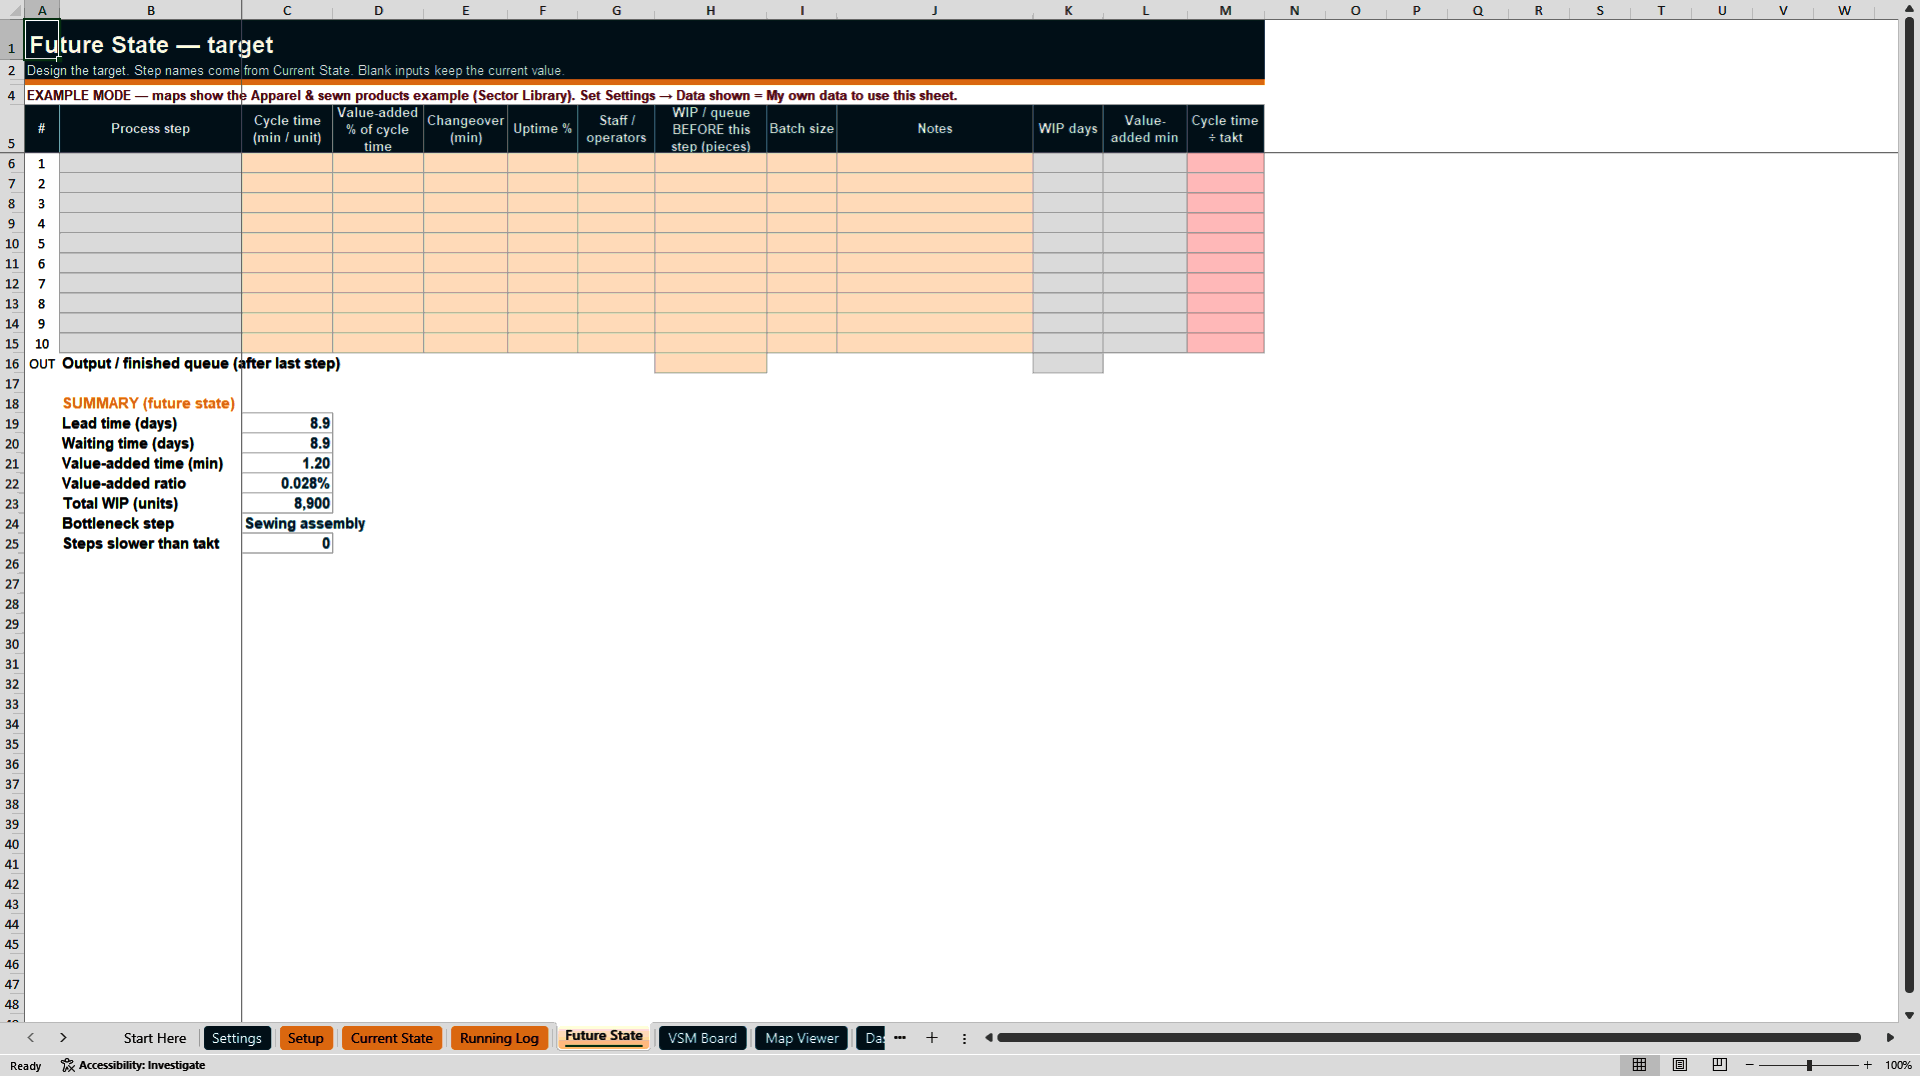
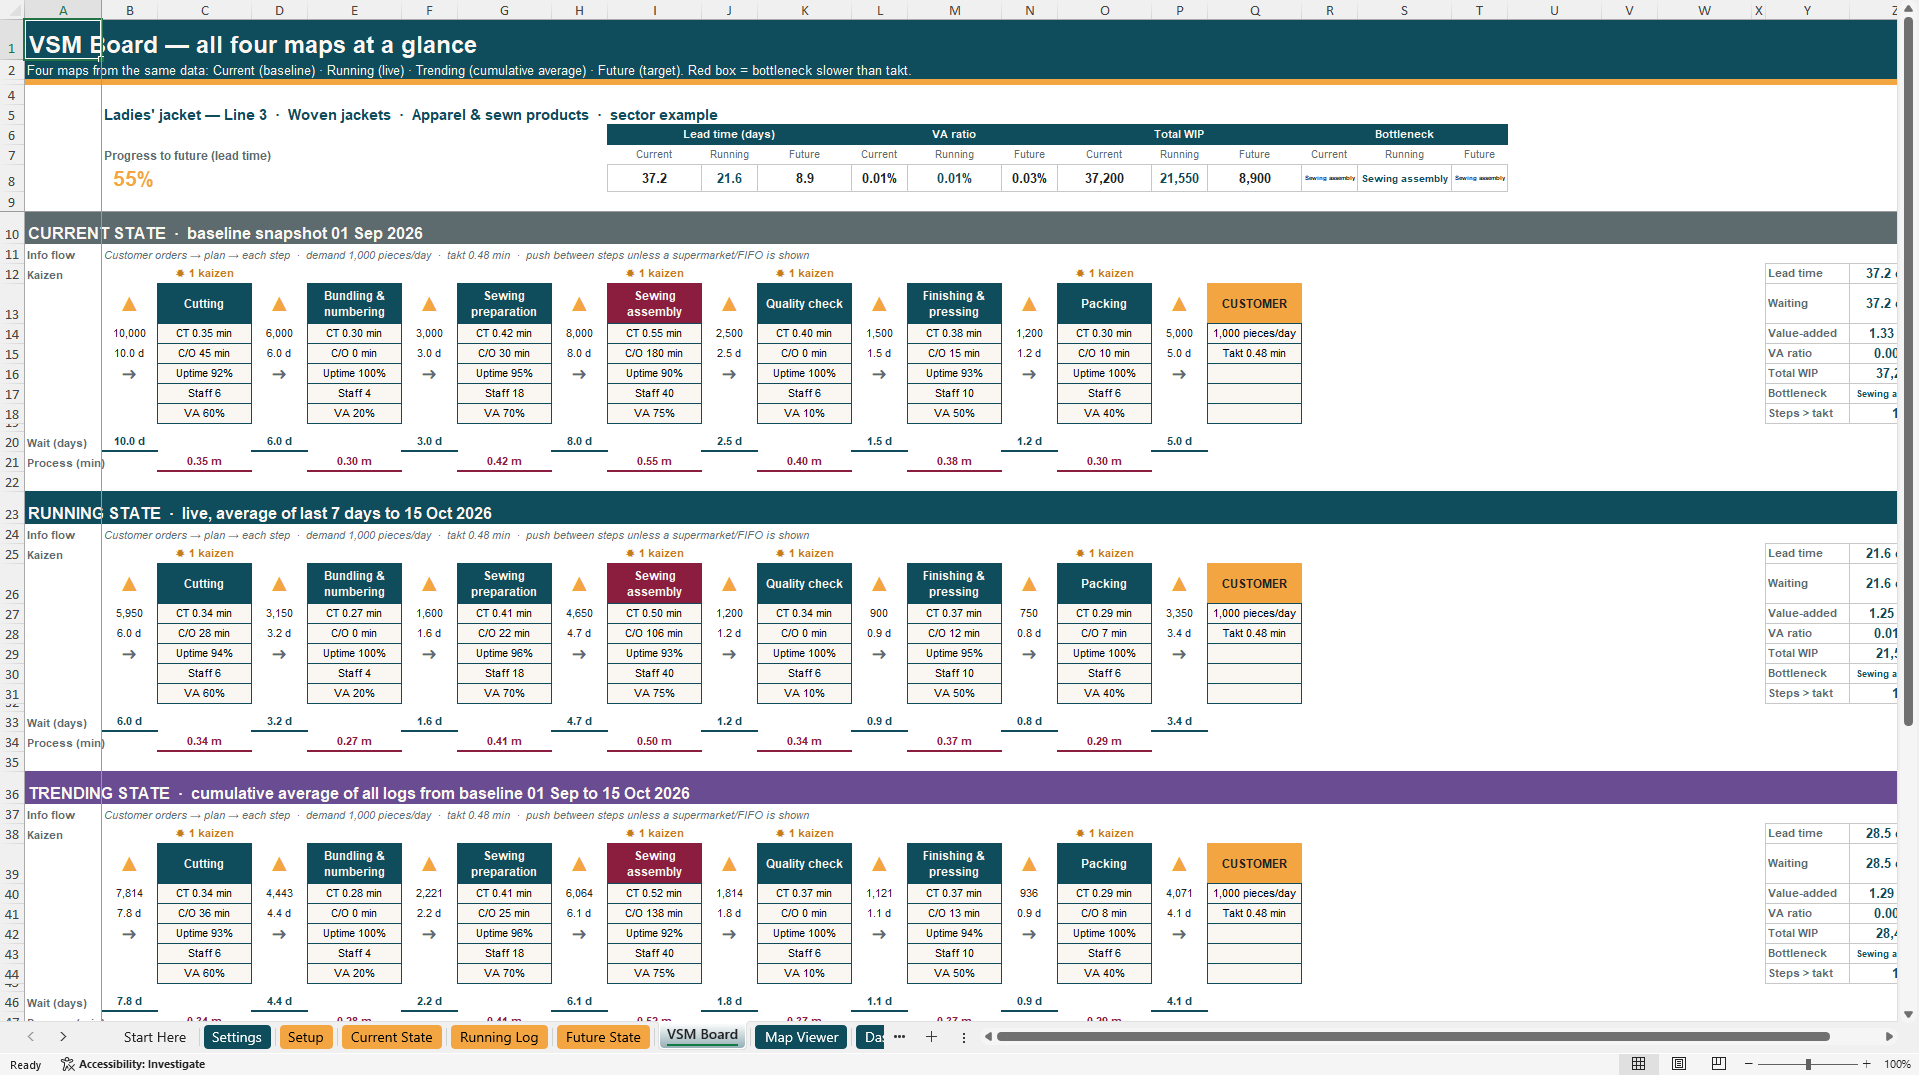
The toolkit holds three frames of the same value stream. The current state is the baseline you mapped on day one, locked with a fingerprint so any later edit is flagged. The running state is built live from the cycle time, changeover, uptime, staffing and WIP data you log each day or week. The future state is the target you designed. All three are always visible on the VSM Board.
Key features:
Map Viewer works as a time machine: pick any frame or any week since the baseline and the whole map is redrawn for that moment.
Trends compare every week with the original current-state map for lead time, waiting time, value-added ratio, WIP, bottleneck and uptime.
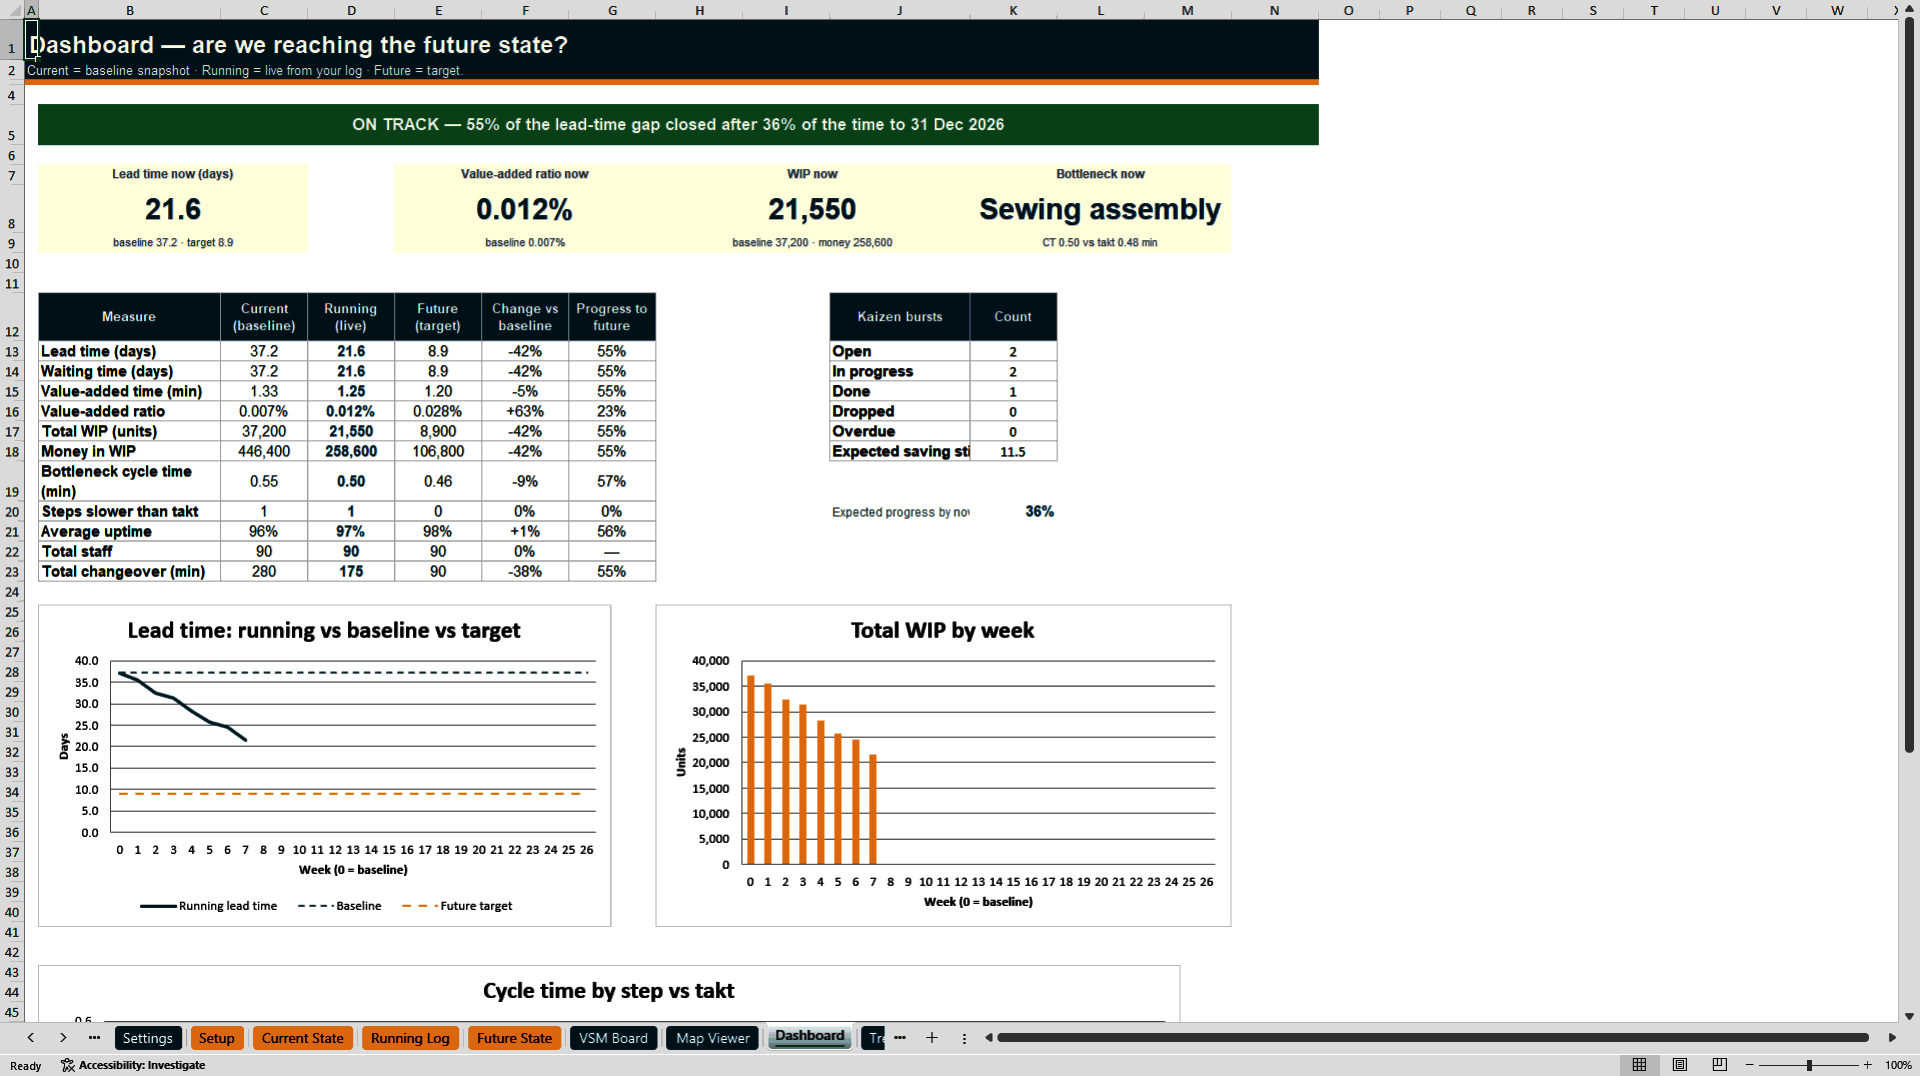
The Dashboard shows progress and charts, and every map marks the bottleneck in red when the slowest step is slower than takt time, with inventory triangles showing units and days waiting before each step.
Kaizen Bursts let you list each problem and countermeasure against a process step, with owner, due date and status. Open bursts appear above the matching process box until they are done.
The VSM Diagram adds the information flow from customer order to planning, production and shipping.
The Self-Check scores the team's value stream work out of 100, with Practitioner (70+) and Leader (85+) levels for an in-house review by the operations manager or Lean coach.
The toolkit works in 16 sectors: apparel, automotive and engineering, electronics, food and beverage, pharma and process, hospital patient flow, hospital pharmacy and lab, hotel rooms and guest journey, bank loans and accounts, insurance claims, software and IT delivery, logistics and warehouse, construction and design, public services, education and training admin, and a custom option. Each sector has a full worked example, so the whole workbook can be explored before entering your own data.
The secondary document is a 27-page PDF guide book with VSM basics, step-by-step instructions, sector playbooks, a worked jacket sewing line example, published results, a 90-day rollout plan and how every number is calculated, plus a 10-prompt AI Prompt Pack.
Developed from more than 20 years of Lean, industrial engineering and operational excellence leadership across Sri Lanka, China, Bangladesh, Indonesia, Thailand and Vietnam.
Requirements: Excel 2016 or later. No macros.
Got a question about the product? Email us at support@flevy.com or ask the author directly by using the "Ask the Author a Question" form. If you cannot view the preview above this document description, go here to view the large preview instead.
Source: Best Practices in Lean Management, Process Maps Excel: Live Value Stream Mapping Toolkit with Guide Book Excel (XLSX) Spreadsheet, Lakshman Ranasinghe
ABOUT THE AUTHOR

Lakshman Ranasinghe is an operational excellence and talent development leader with more than 20 years of experience in Lean manufacturing, quality and industrial engineering across Sri Lanka, China, Bangladesh, Indonesia, Thailand and Vietnam.
He has led factory transformation programs in apparel manufacturing, including product development cycle-time reduction, material flow automation and
... [read more]
Ask the Author a Question
You must be logged in to contact the author.