
 Click main image to view in full screen.
Integrated Three-Statement DCF Valuation Model – Excel XLSX
Excel (XLSX)


BENEFITS OF THIS DOWNLOADABLE EXCEL DOCUMENT
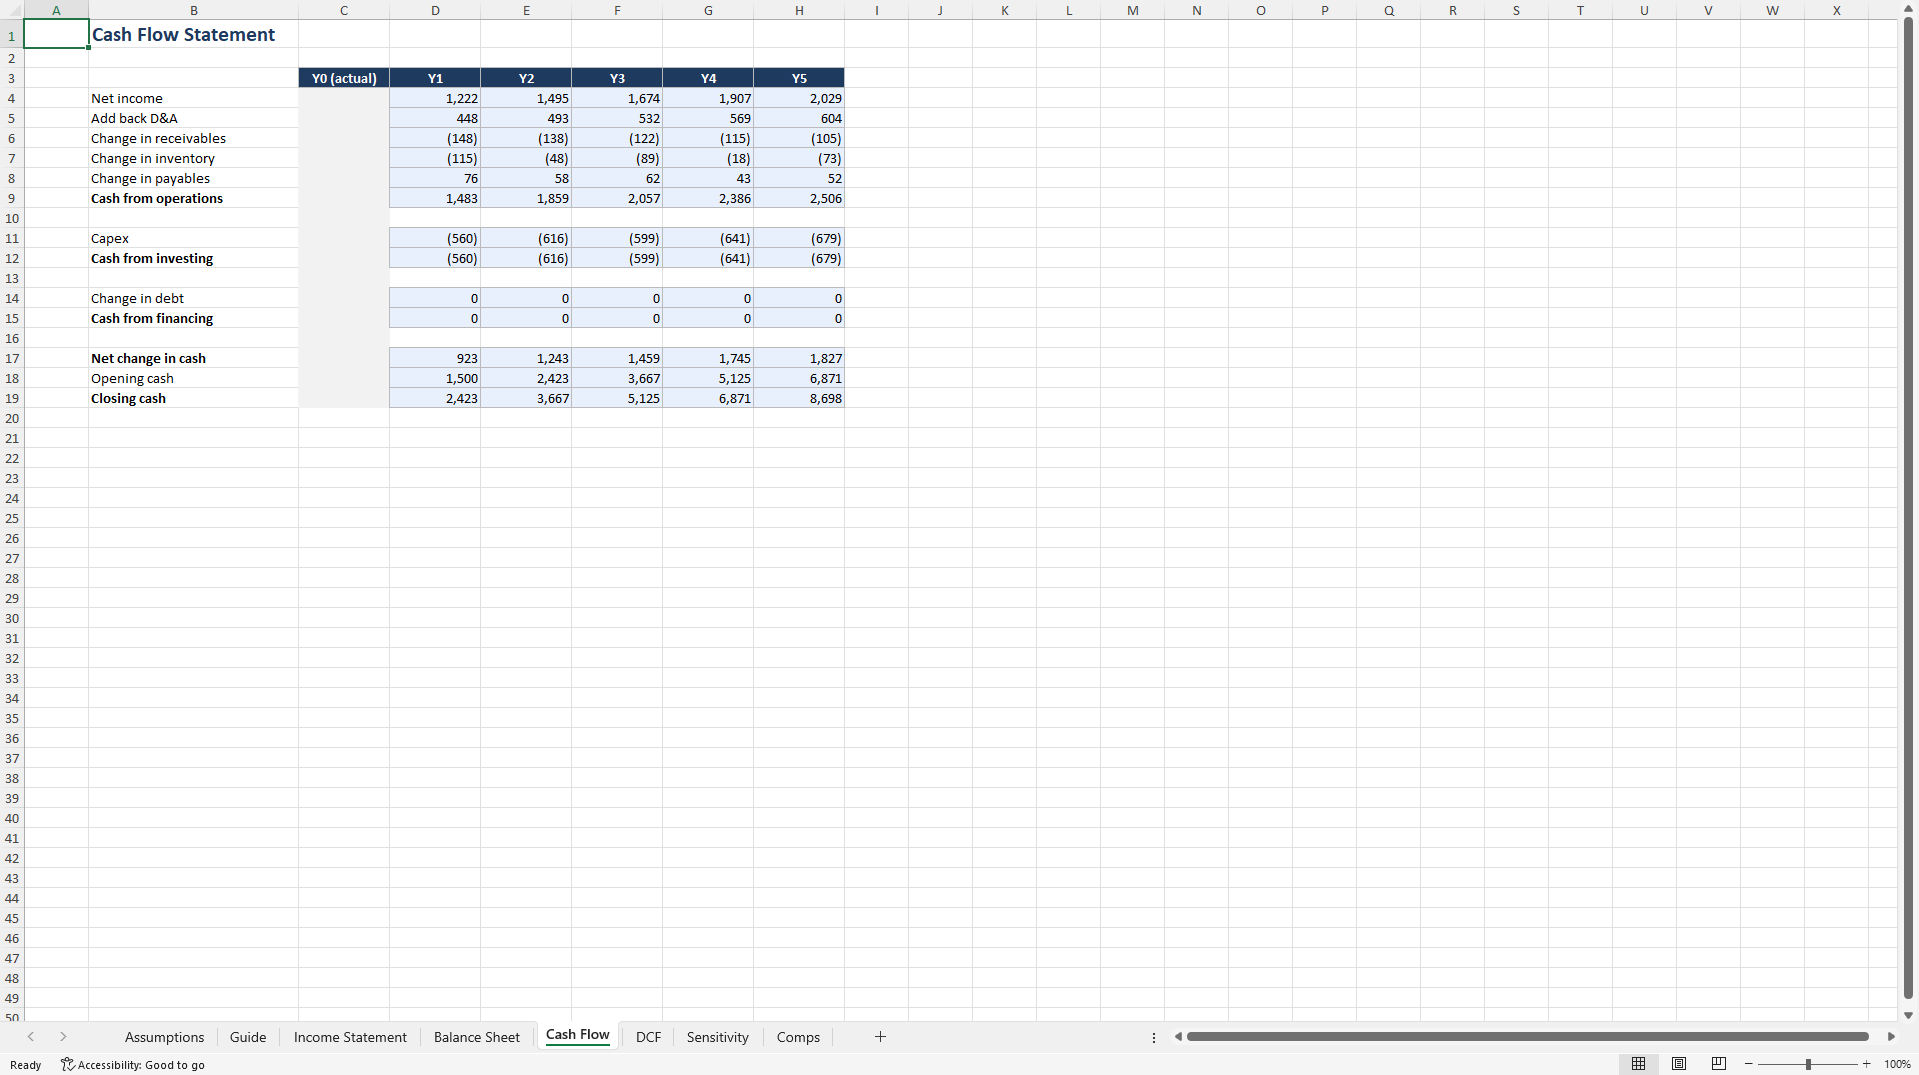
- Links income statement, balance sheet and cash flow so the balance sheet always ties.
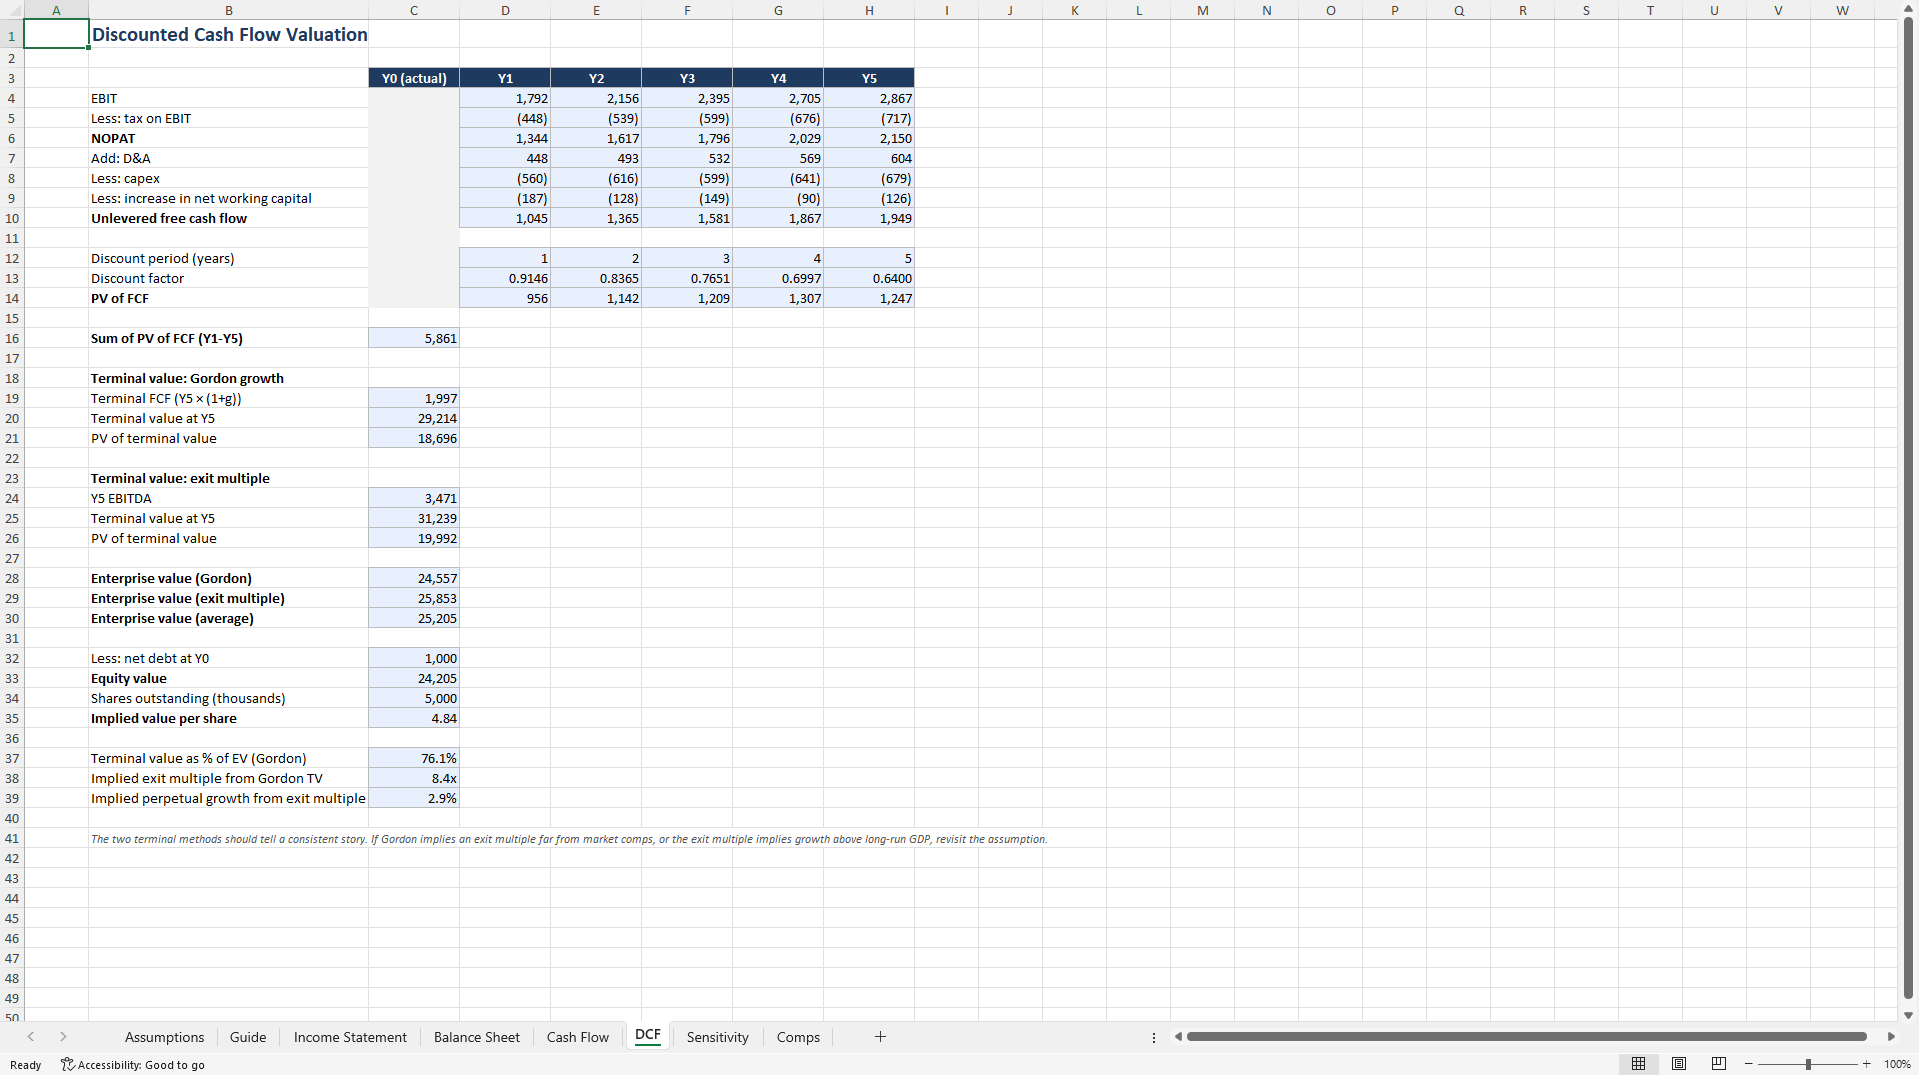
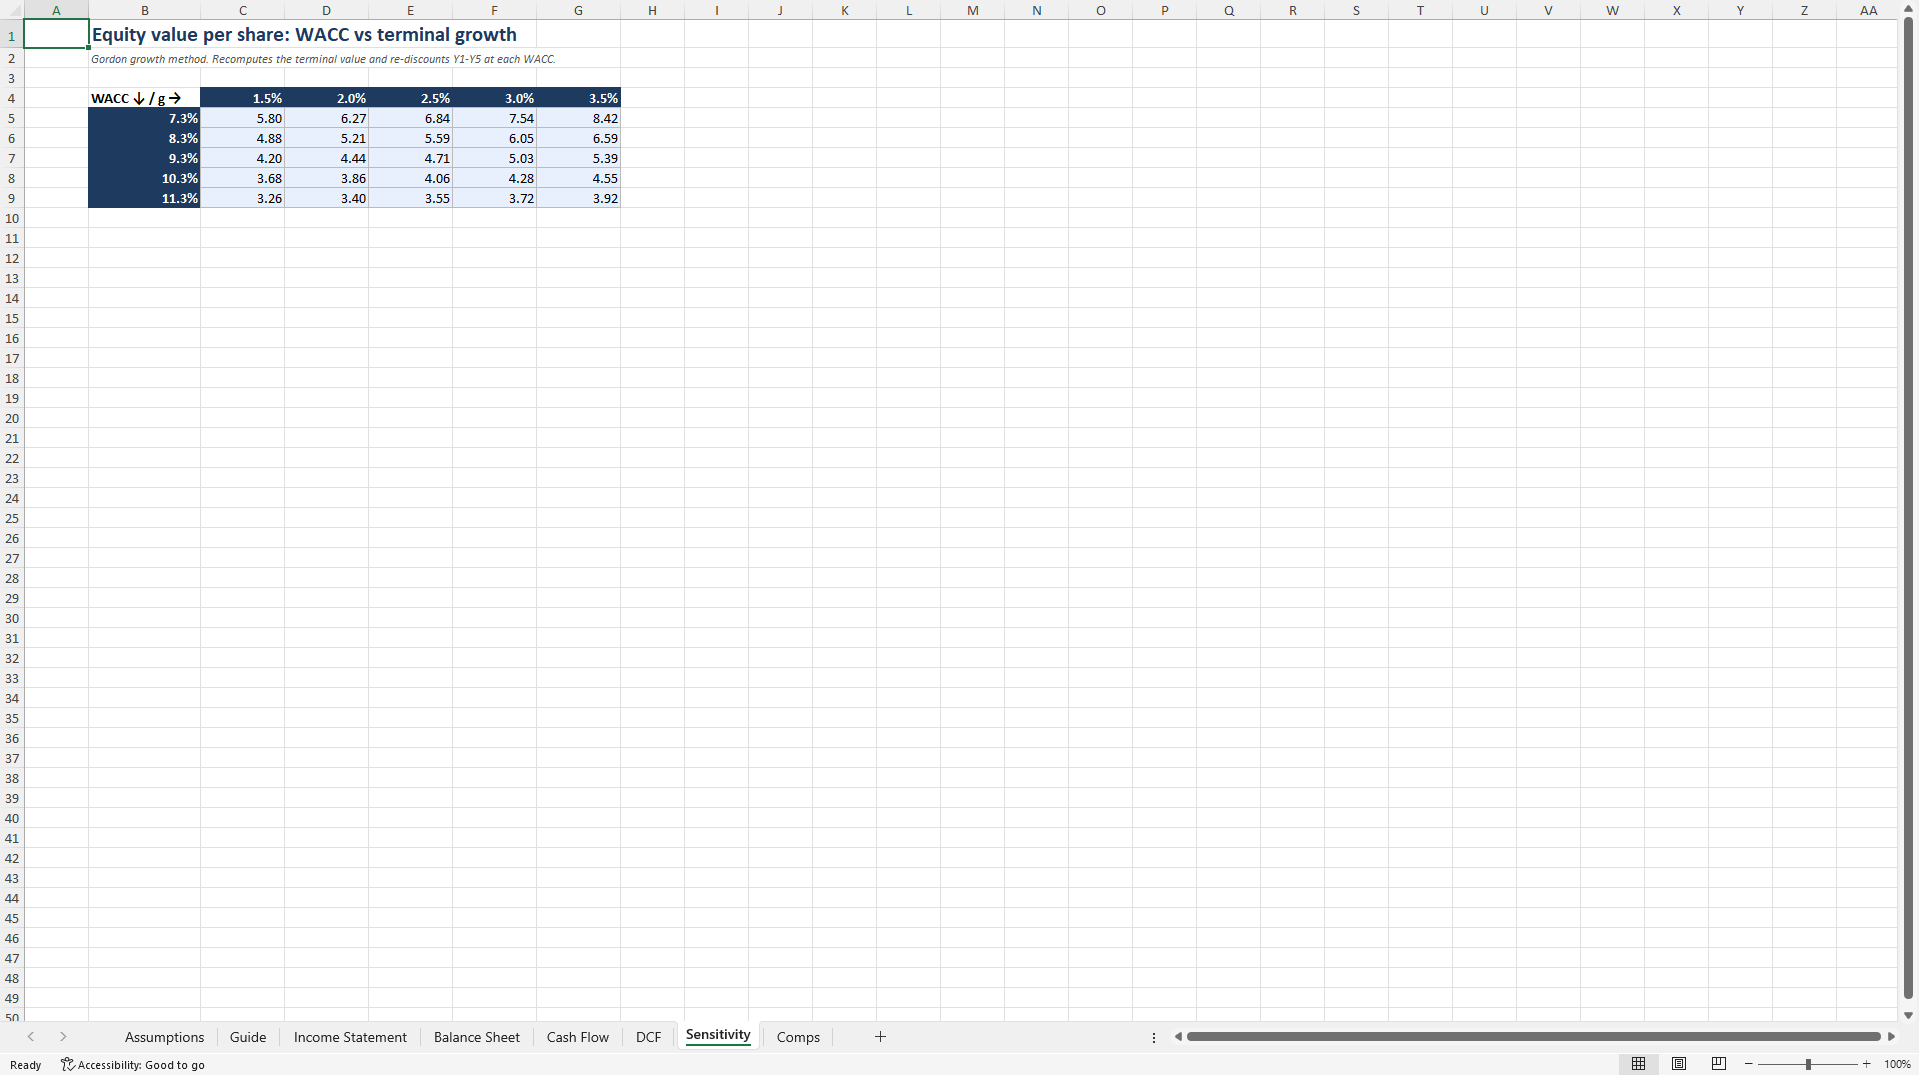
- Produces enterprise and equity value with a sensitivity table on WACC and terminal growth.
- Every driver sits on one input sheet, so a new case takes minutes.
VALUATION EXCEL DESCRIPTION
A five-year integrated model built the way a bank analyst builds one, then stripped of everything that makes those hard to read.
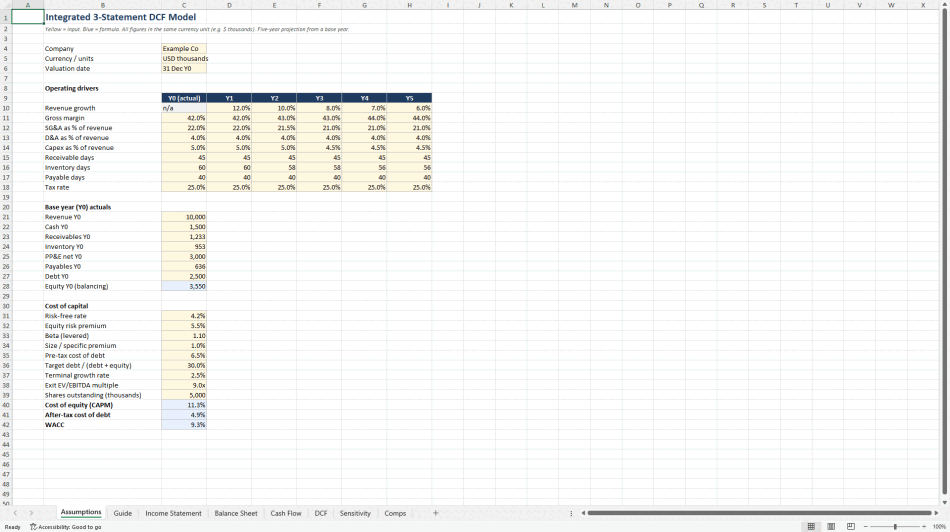
Assumptions sheet drives every line: growth, margins, capex, working-capital days, tax, and a CAPM WACC build-up.
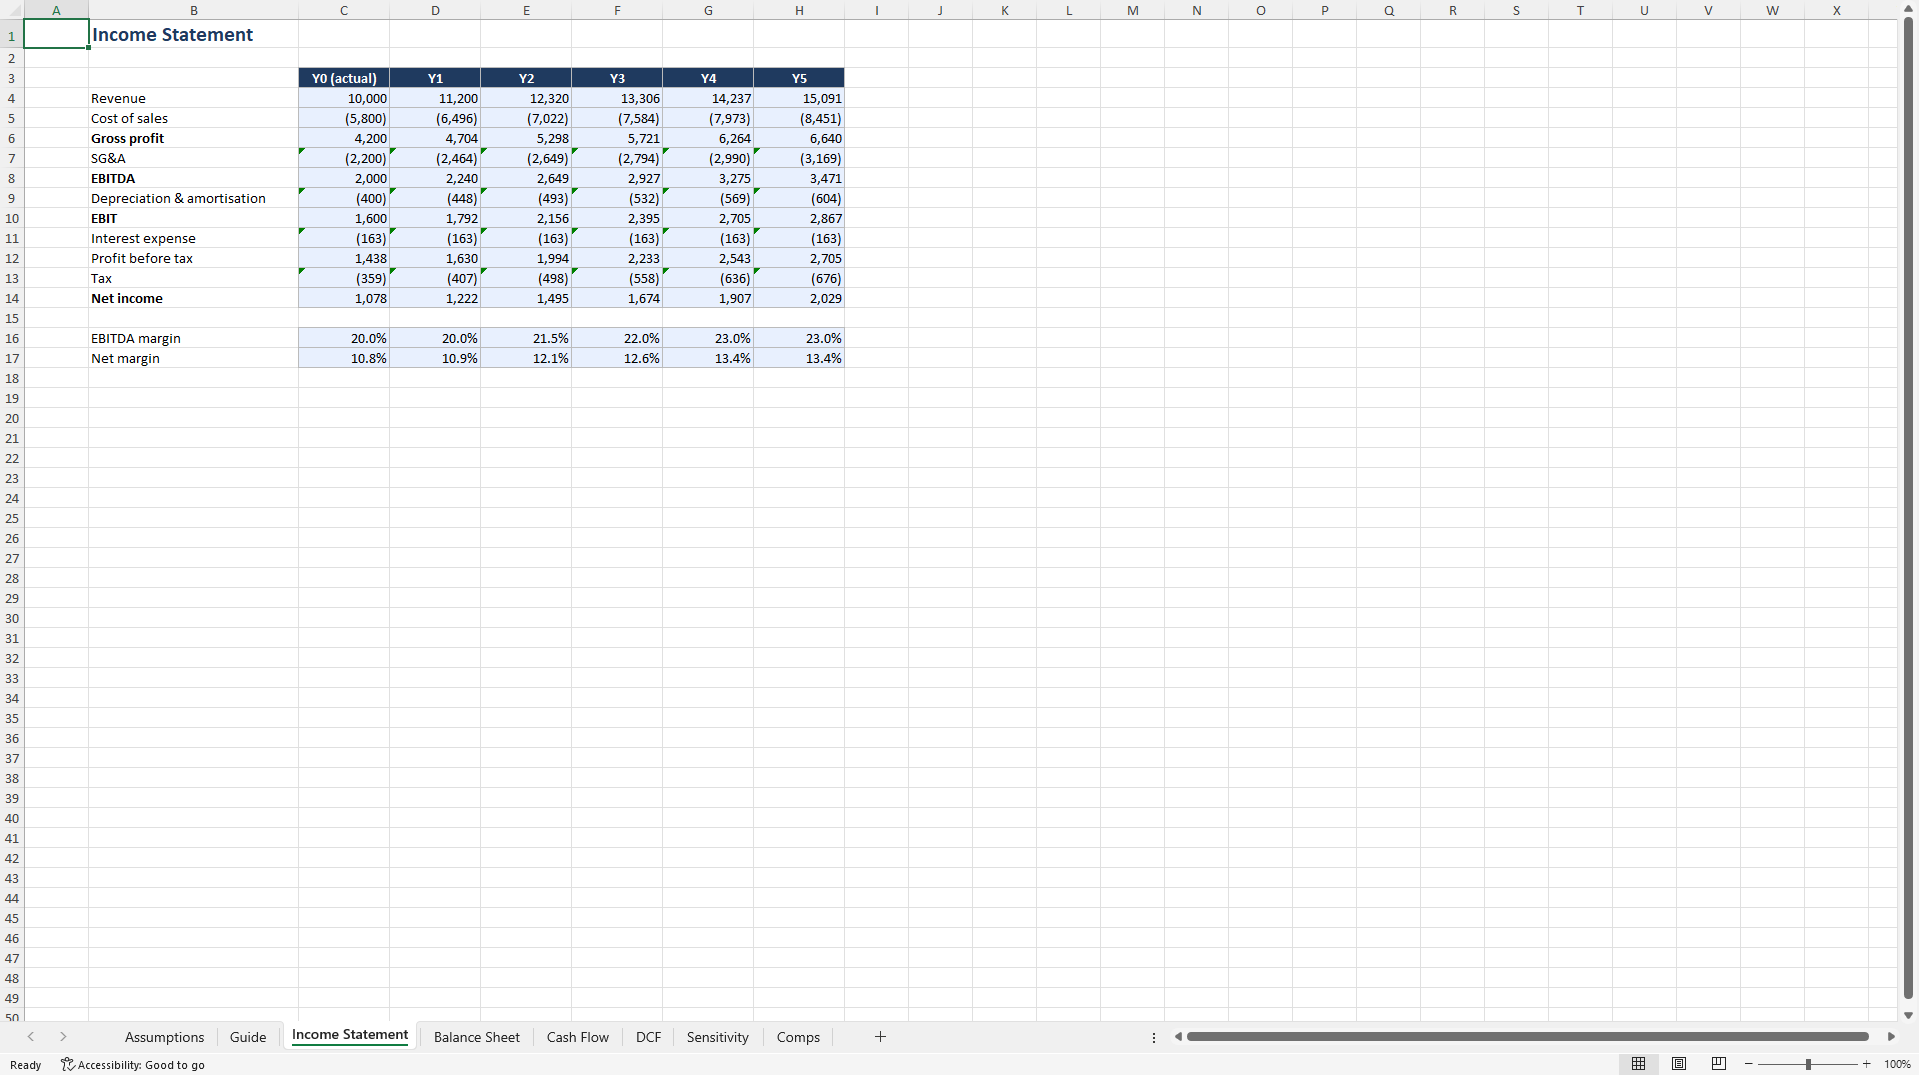
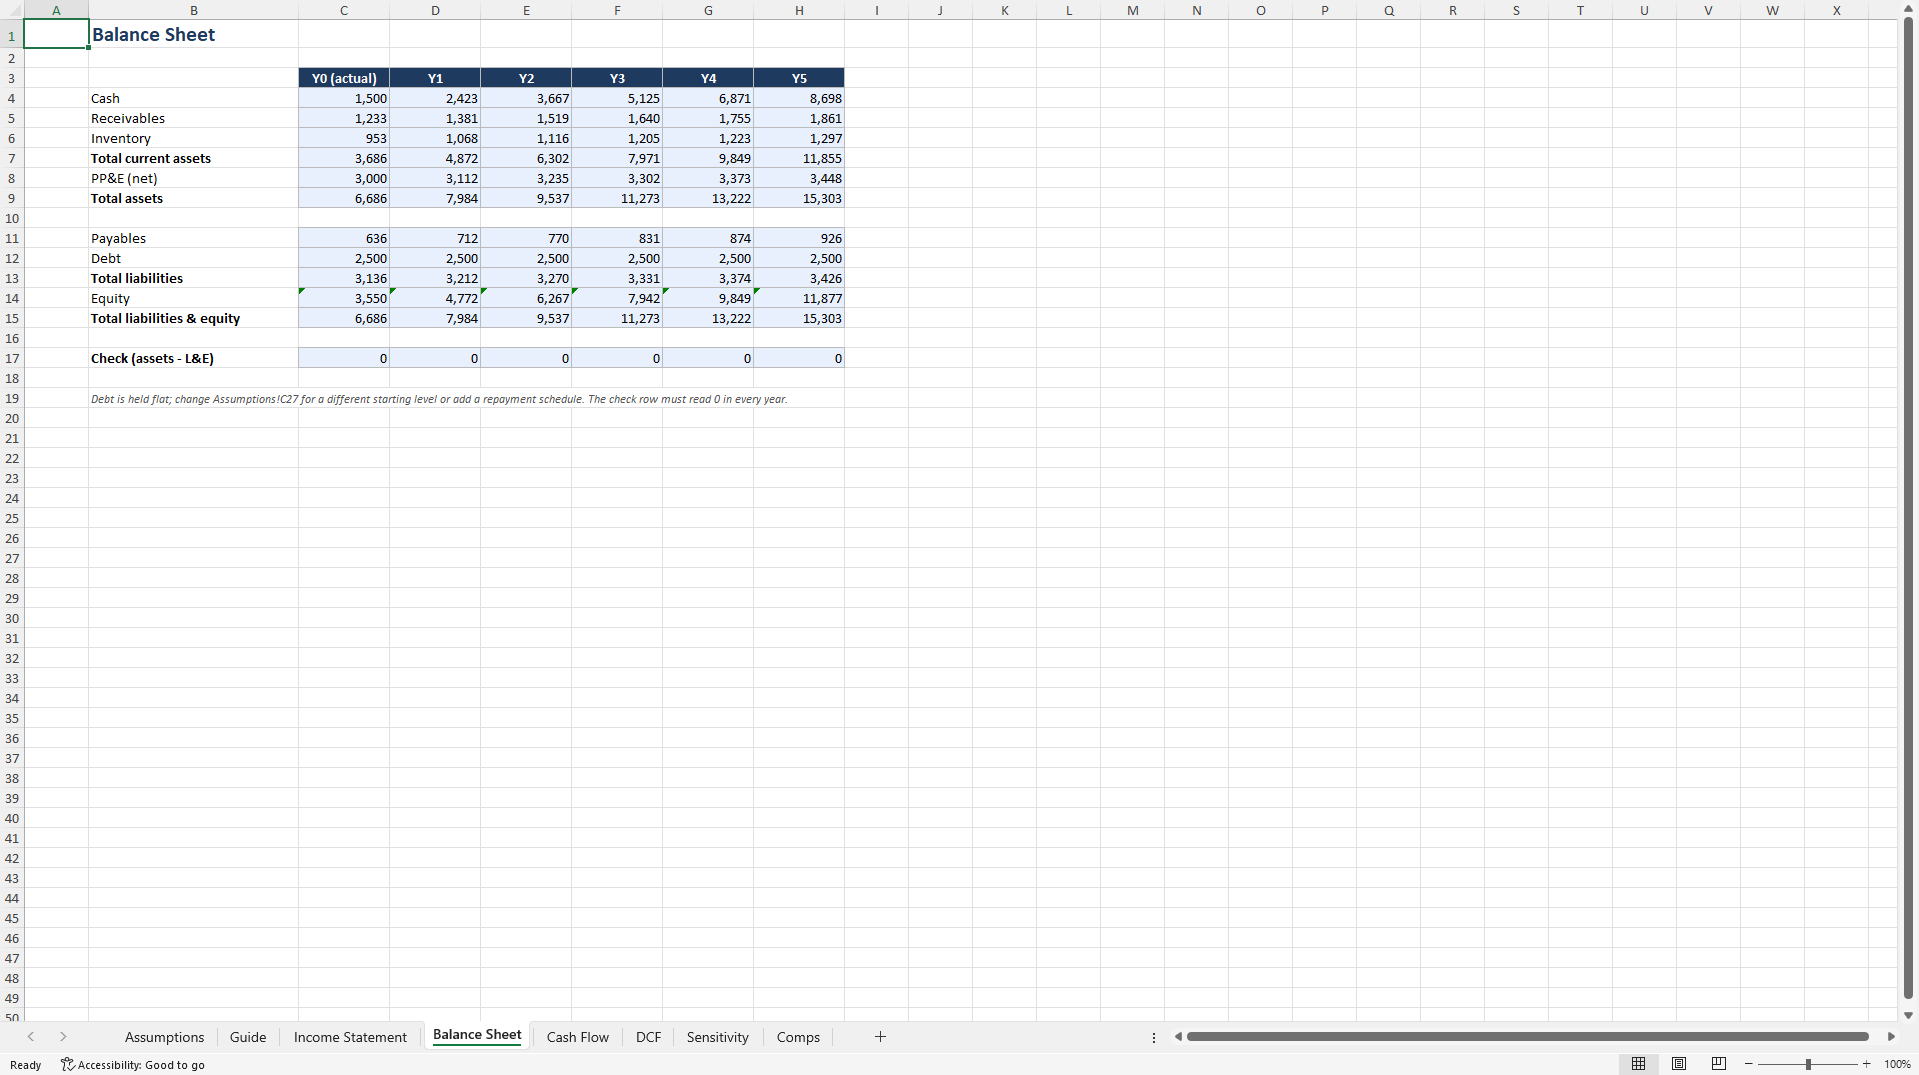
Three statements fully linked. Cash is the balancing item through the cash flow statement. The balance-sheet check row reads zero in every year, and was verified to before listing.
DCF with both terminal methods side by side: Gordon growth and exit multiple, plus the two cross-checks that catch bad assumptions: the exit multiple your growth rate implies, and the growth rate your multiple implies.
Sensitivity grid: value per share across WACC and terminal growth.
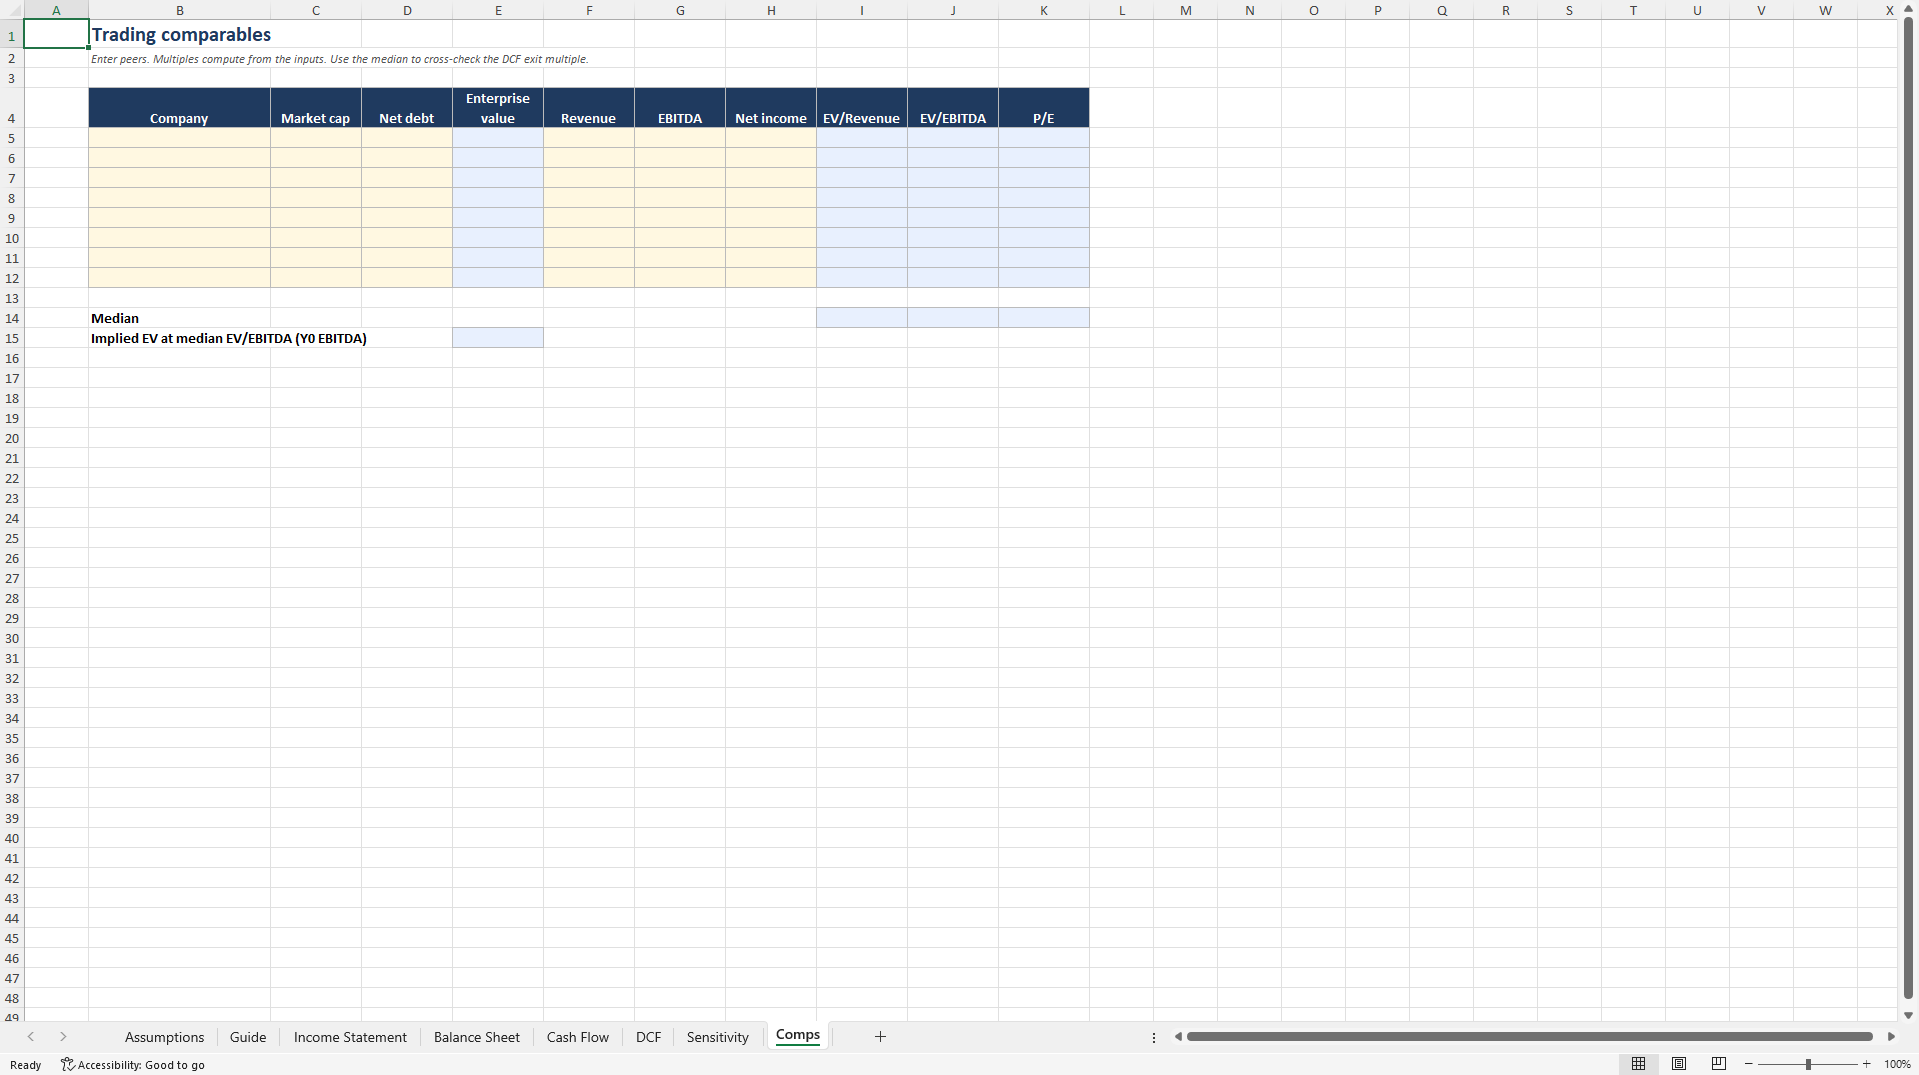
Comps sheet with EV/Revenue, EV/EBITDA and P/E, and the median fed back as a check on the exit multiple.
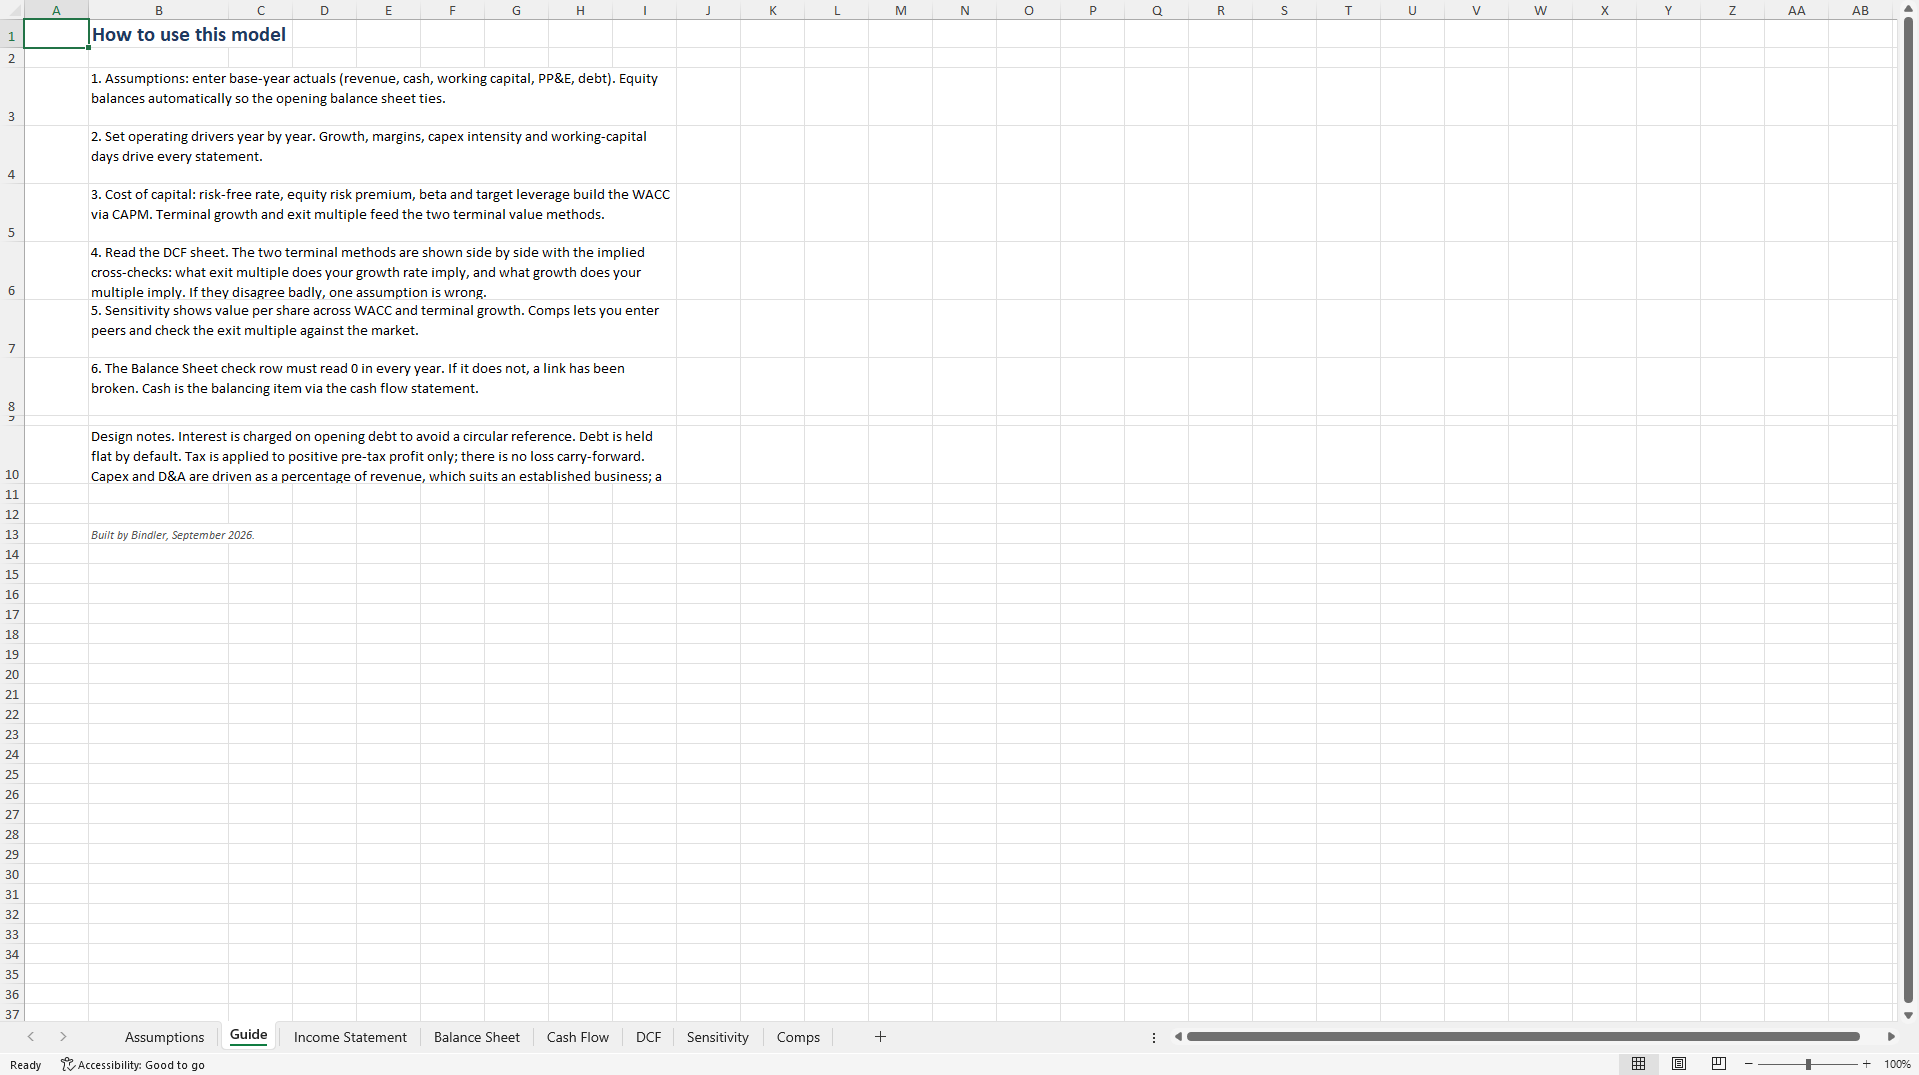
Guide sheet explains each design choice, including the ones made for readability: interest on opening debt to avoid circularity, flat debt, no loss carry-forward.
No macros. No hidden sheets. Every cell is either a yellow input or a blue formula. Excel and Google Sheets.
Who it is for: analysts, founders and students who need a valuation that ties out rather than a template that looks finished. Every assumption (growth, margins, capex, working-capital days, tax, WACC) feeds the three statements, and the balance sheet check row reads zero in every year, which was tested before listing rather than assumed. The DCF sheet shows the perpetuity growth and exit multiple methods side by side, with the implied multiple and implied growth cross-checks that catch inconsistent assumptions, plus a WACC and growth sensitivity grid and a comparable companies sheet.
How to work with it. Open the workbook in Excel or Google Sheets. Yellow cells are inputs, blue cells are formulas. Start with the Guide sheet, which walks through the sheets in the order they are meant to be used, then replace the example values with your own data. Every figure traces through live formulas to the inputs and to the cited source, so an auditor, lender or client can follow the working.
Use it if: You need an investor-grade valuation you can defend line by line, in Excel or Google Sheets.
Not suited if: You need an LBO model with debt tranches and returns waterfalls; this is a DCF, not an LBO.
Contents: 1 Excel workbook (.xlsx), sheets: Assumptions, Guide, Income Statement, Balance Sheet, Cash Flow, DCF, Sensitivity, Comps. No macros, no locked cells, no hidden sheets. Built and verified by Bindler.
Got a question about the product? Email us at support@flevy.com or ask the author directly by using the "Ask the Author a Question" form. If you cannot view the preview above this document description, go here to view the large preview instead.
Source: Best Practices in Valuation, Integrated Financial Model Excel: Integrated Three-Statement DCF Valuation Model Excel (XLSX) Spreadsheet, Bindler
ABOUT THE AUTHOR

Bindler builds Excel workbooks that turn a regulation or a financing structure into live formulas: CSRD double materiality, GHG Protocol inventory, EU Taxonomy, SFDR PAI, PCAF, green bond reporting, IFRS S2, ESRS E1 transition plans, CBAM, the EU AI Act, UAE Corporate Tax, and project finance models for solar, onshore wind and battery storage.
Every workbook is built from the primary text
... [read more]
Ask the Author a Question
You must be logged in to contact the author.




























