
 Click main image to view in full screen. Unlock all 15 preview images:
Stock Analysis and Valuation Model – Excel XLSX
Excel (XLSX) + supplemental PDF


BENEFITS OF THIS DOWNLOADABLE EXCEL DOCUMENT
- Converts segment-level operating assumptions into a fully linked five-year three-statement forecast and per-share valuation.
- Triangulates value through DCF, trading comparables, precedent transactions, a multi-stage dividend model, scenarios, sensitivities, and a football field.
- Improves model reliability with transparent formulas, a centralized assumption architecture, and 28 live audit checks.
VALUATION EXCEL DESCRIPTION
📈 Move from raw assumptions to a complete, defensible stock valuation—inside one integrated Excel workbook.
The Stock Analysis & Valuation Model is a premium equity-research and corporate-finance template built for analysts who need more than a basic DCF calculator. It connects company assumptions, segment operating drivers, historical financials, a five-year three-statement forecast, capital structure, valuation methods, scenario analysis, sensitivities, charts, and live controls in one transparent model.
The workbook is populated with Vantage Instruments Corporation (NYSE: VTGI), a fictional industrial technology company with four operating segments. The sample company and all peer and transaction data are synthetic. This deliberate design lets you inspect the full modeling logic without implying that the workbook contains current market research or a recommendation on a real security.
🔍 What Is Inside the Workbook?
The model contains 19 professionally structured worksheets covering the full equity-analysis workflow:
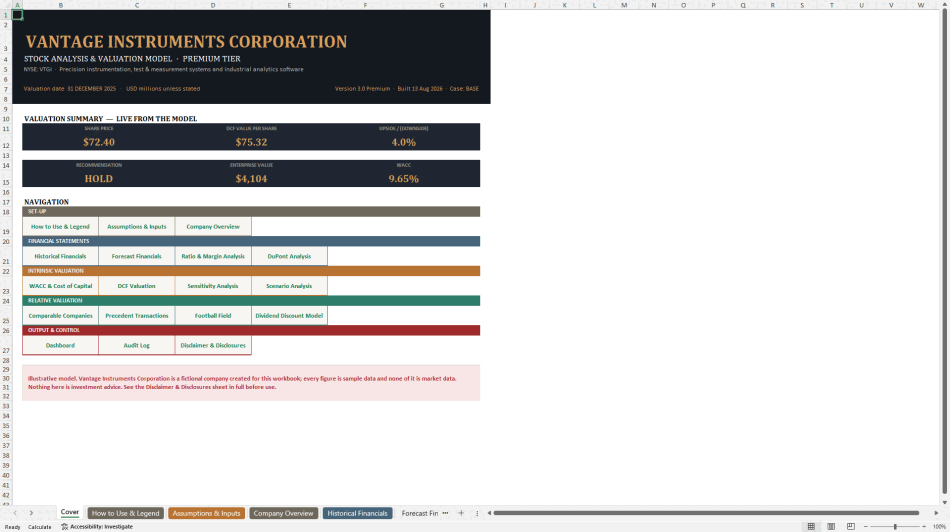
Cover, navigation, instructions, and modeling legend
Assumptions and user inputs
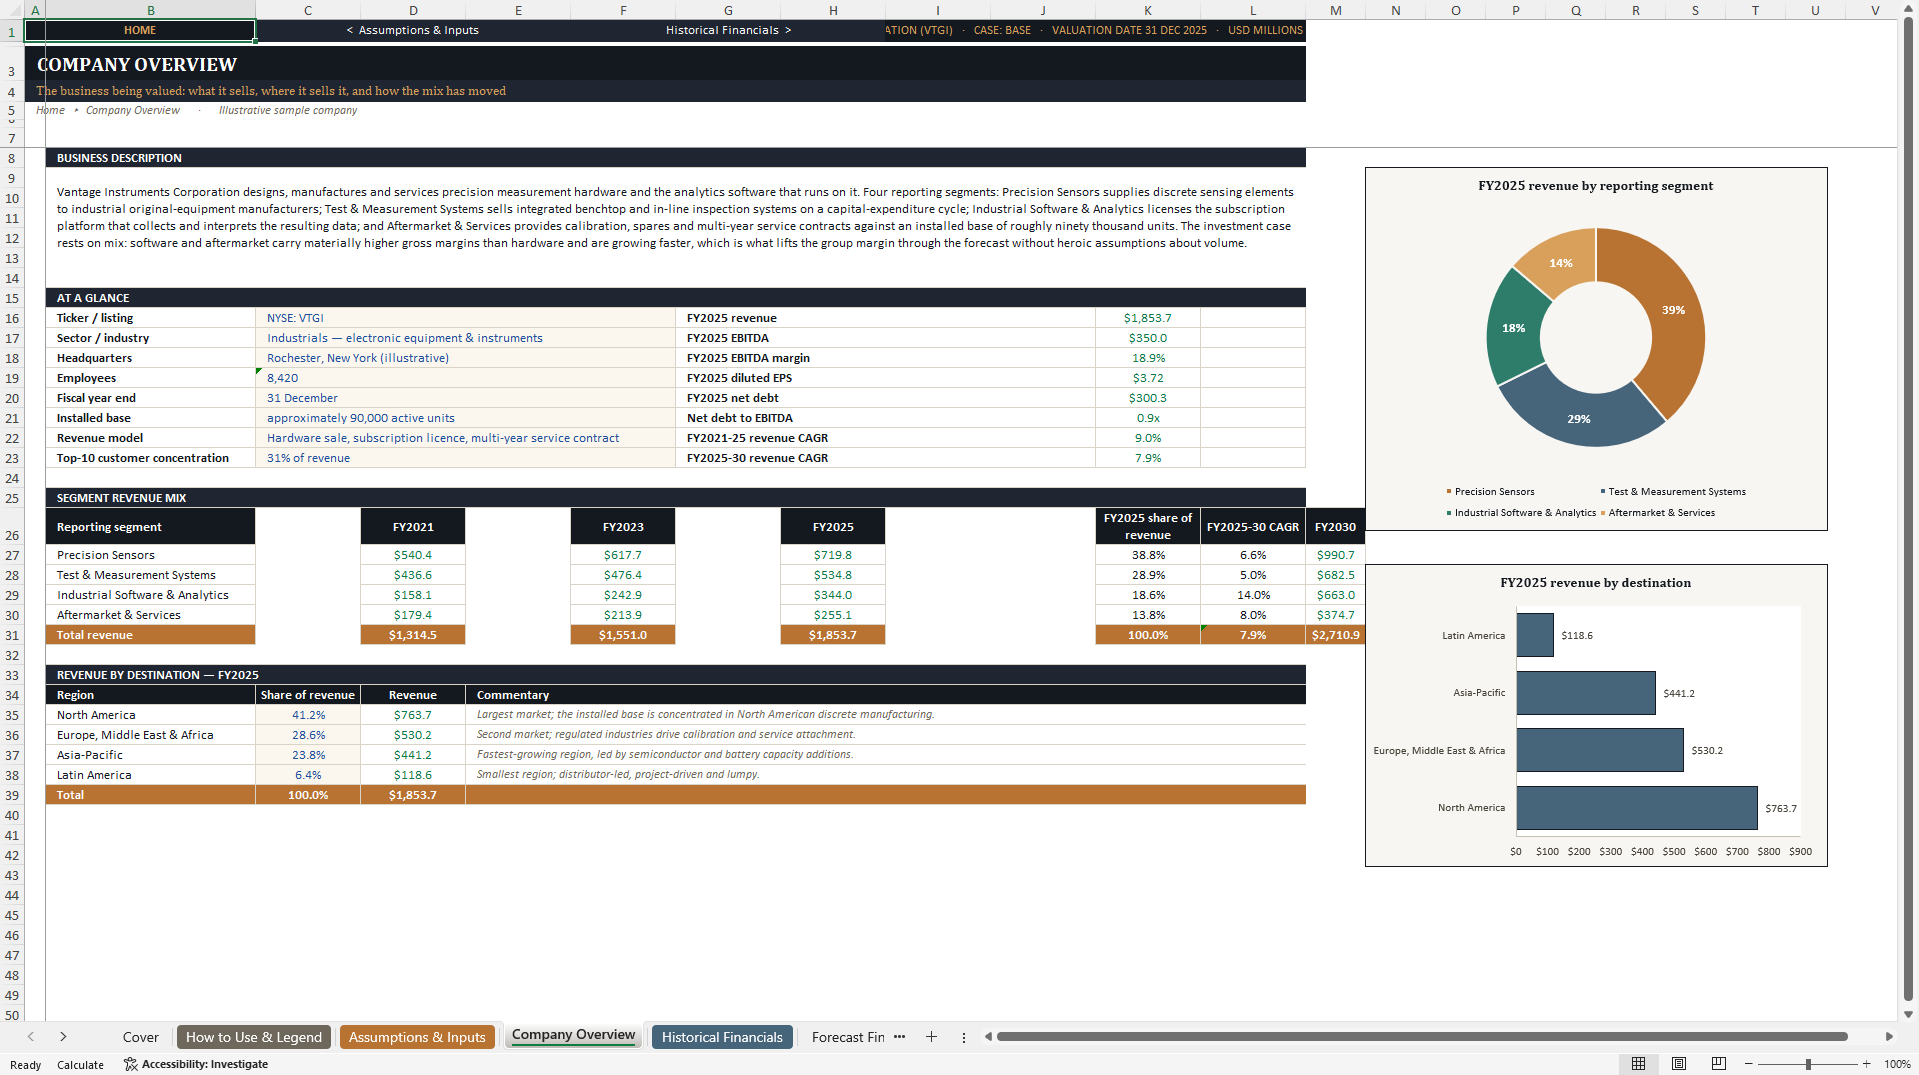
Company overview and investment profile
Five years of historical financial statements
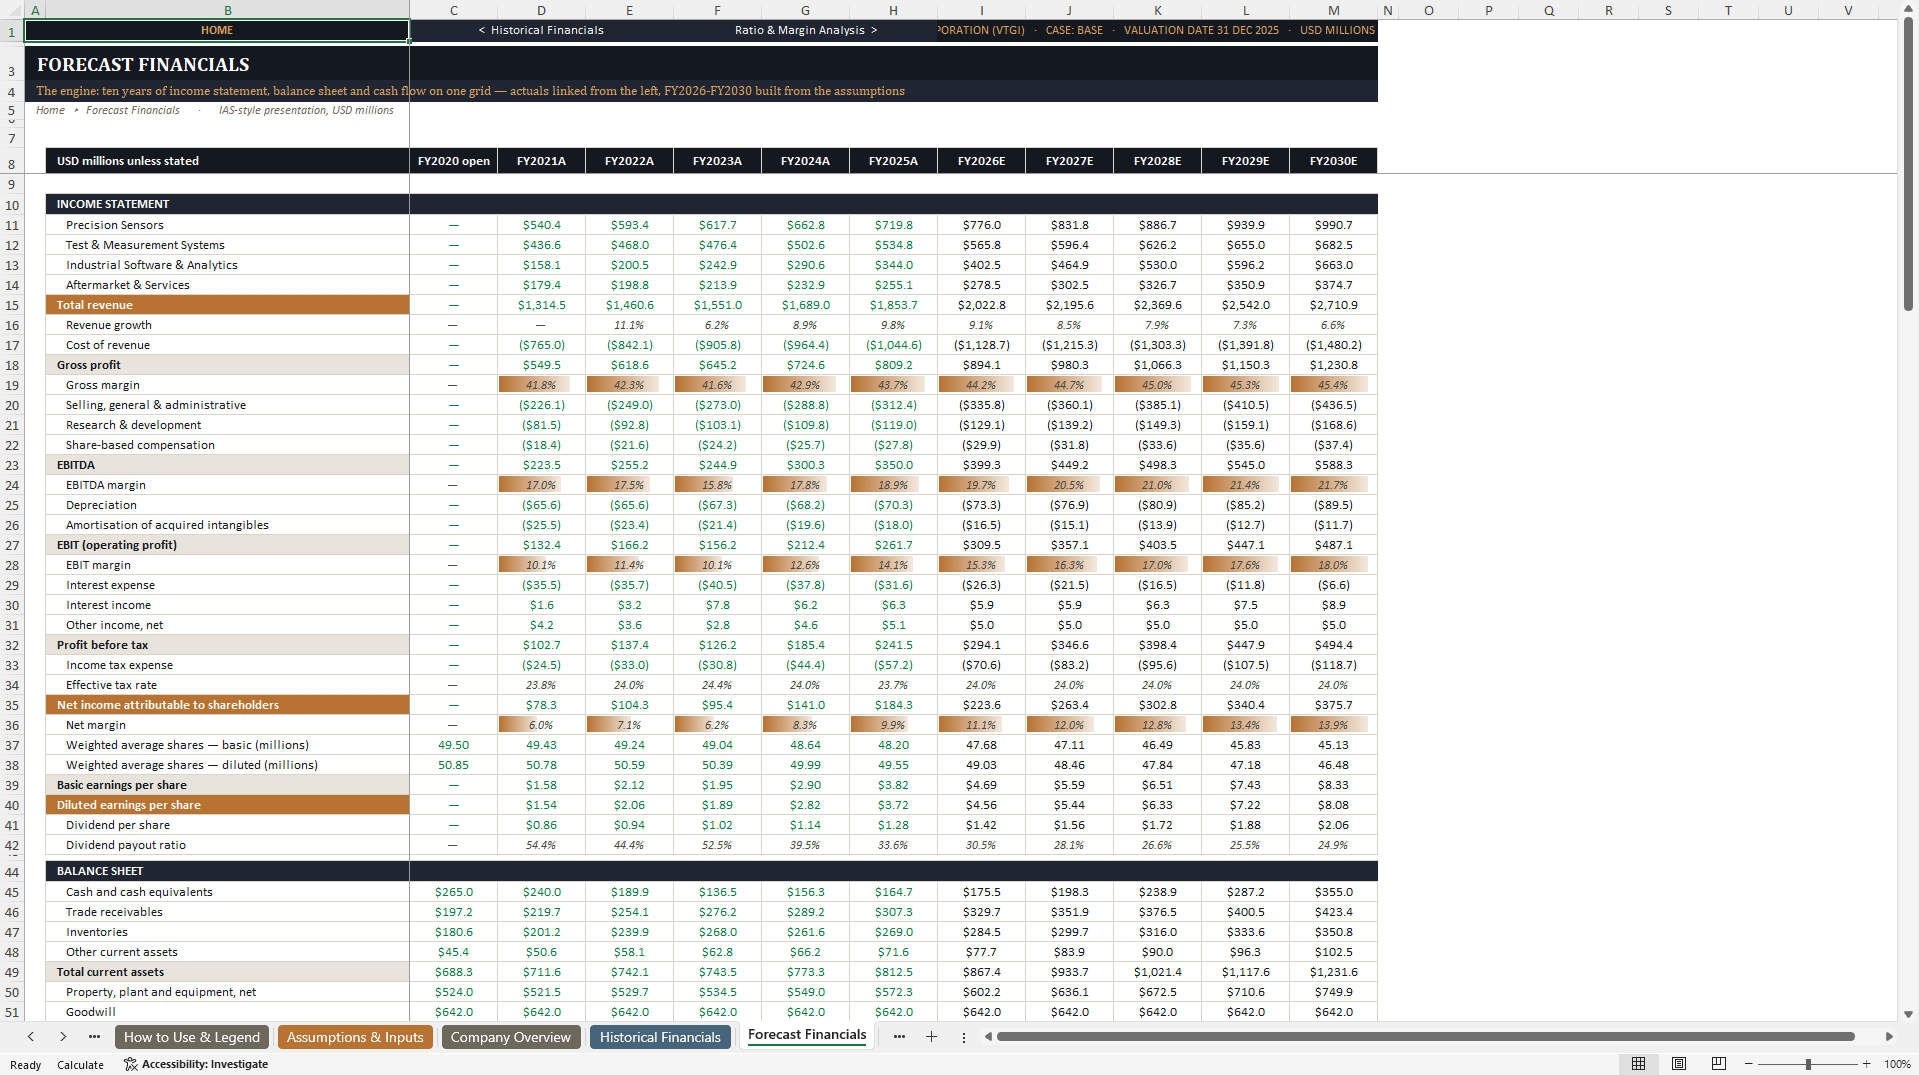
Five years of forecast financial statements
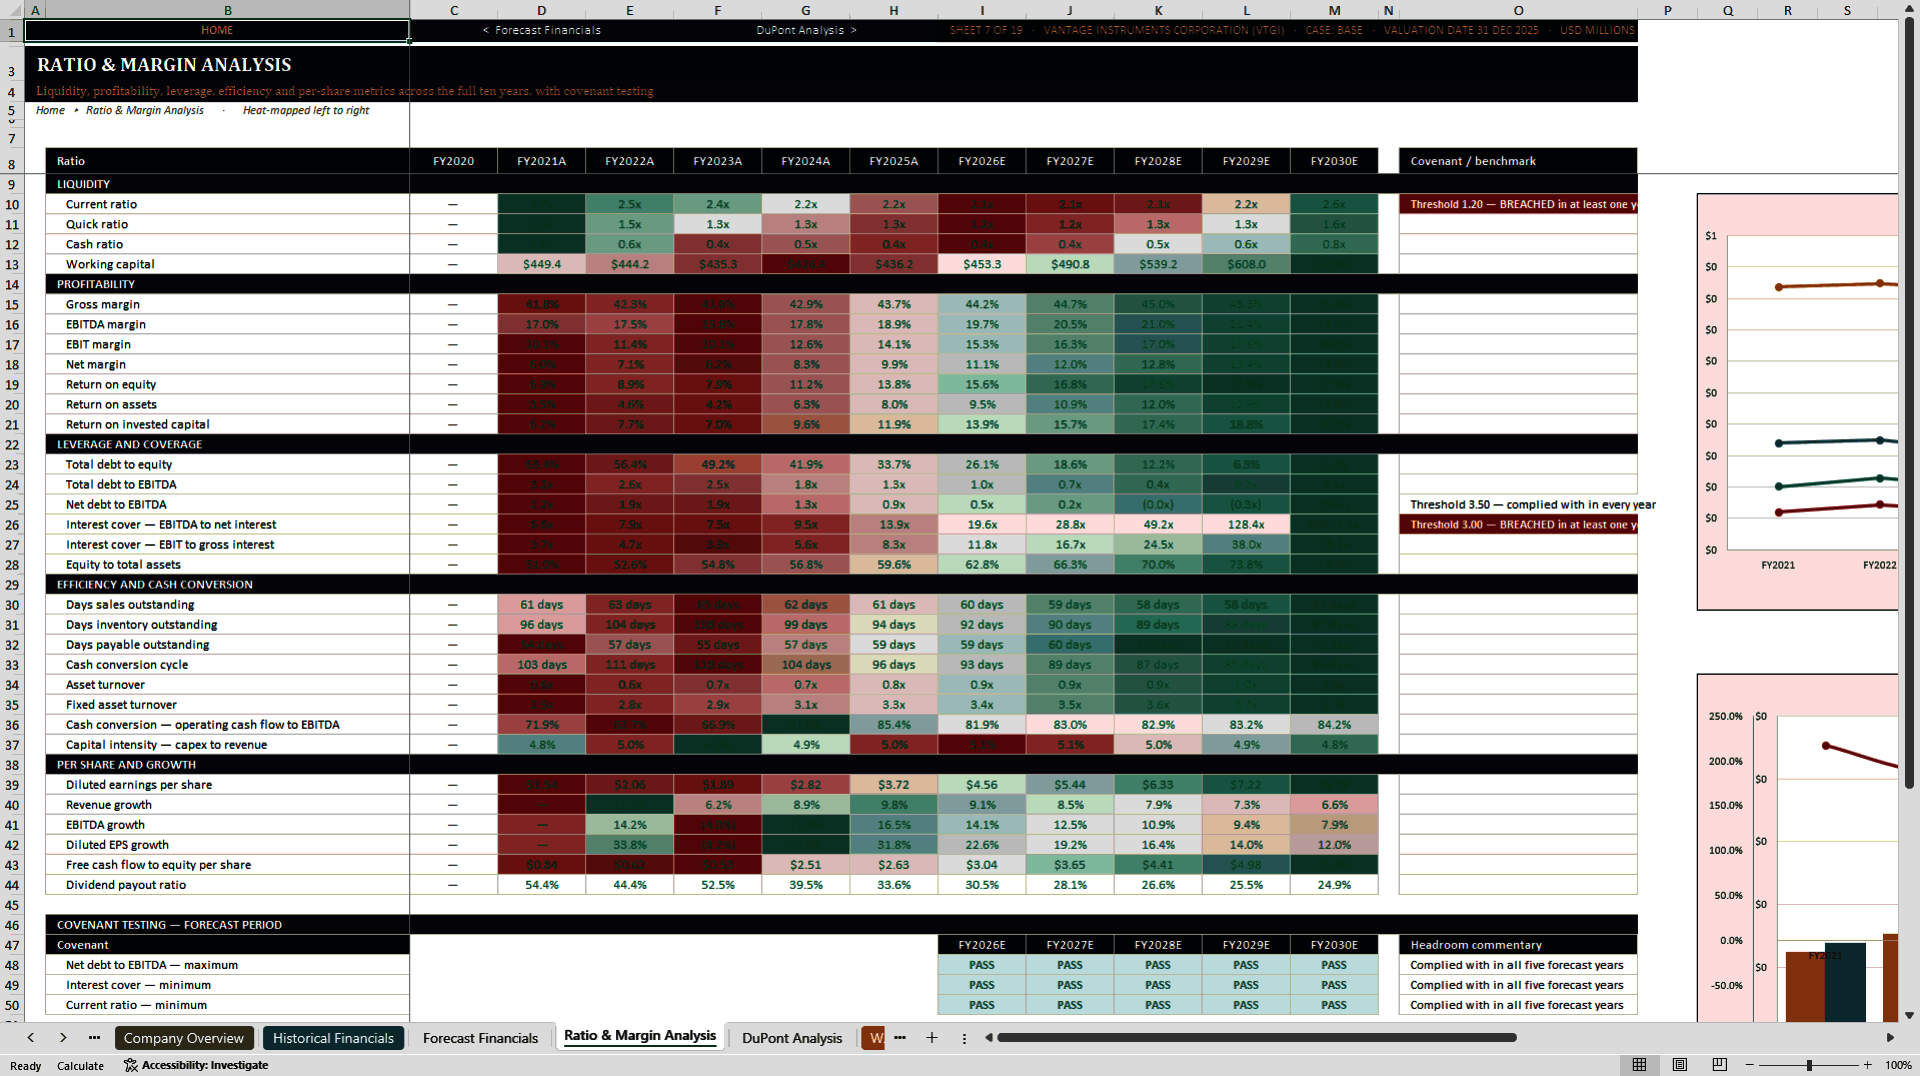
Ratio and margin analysis
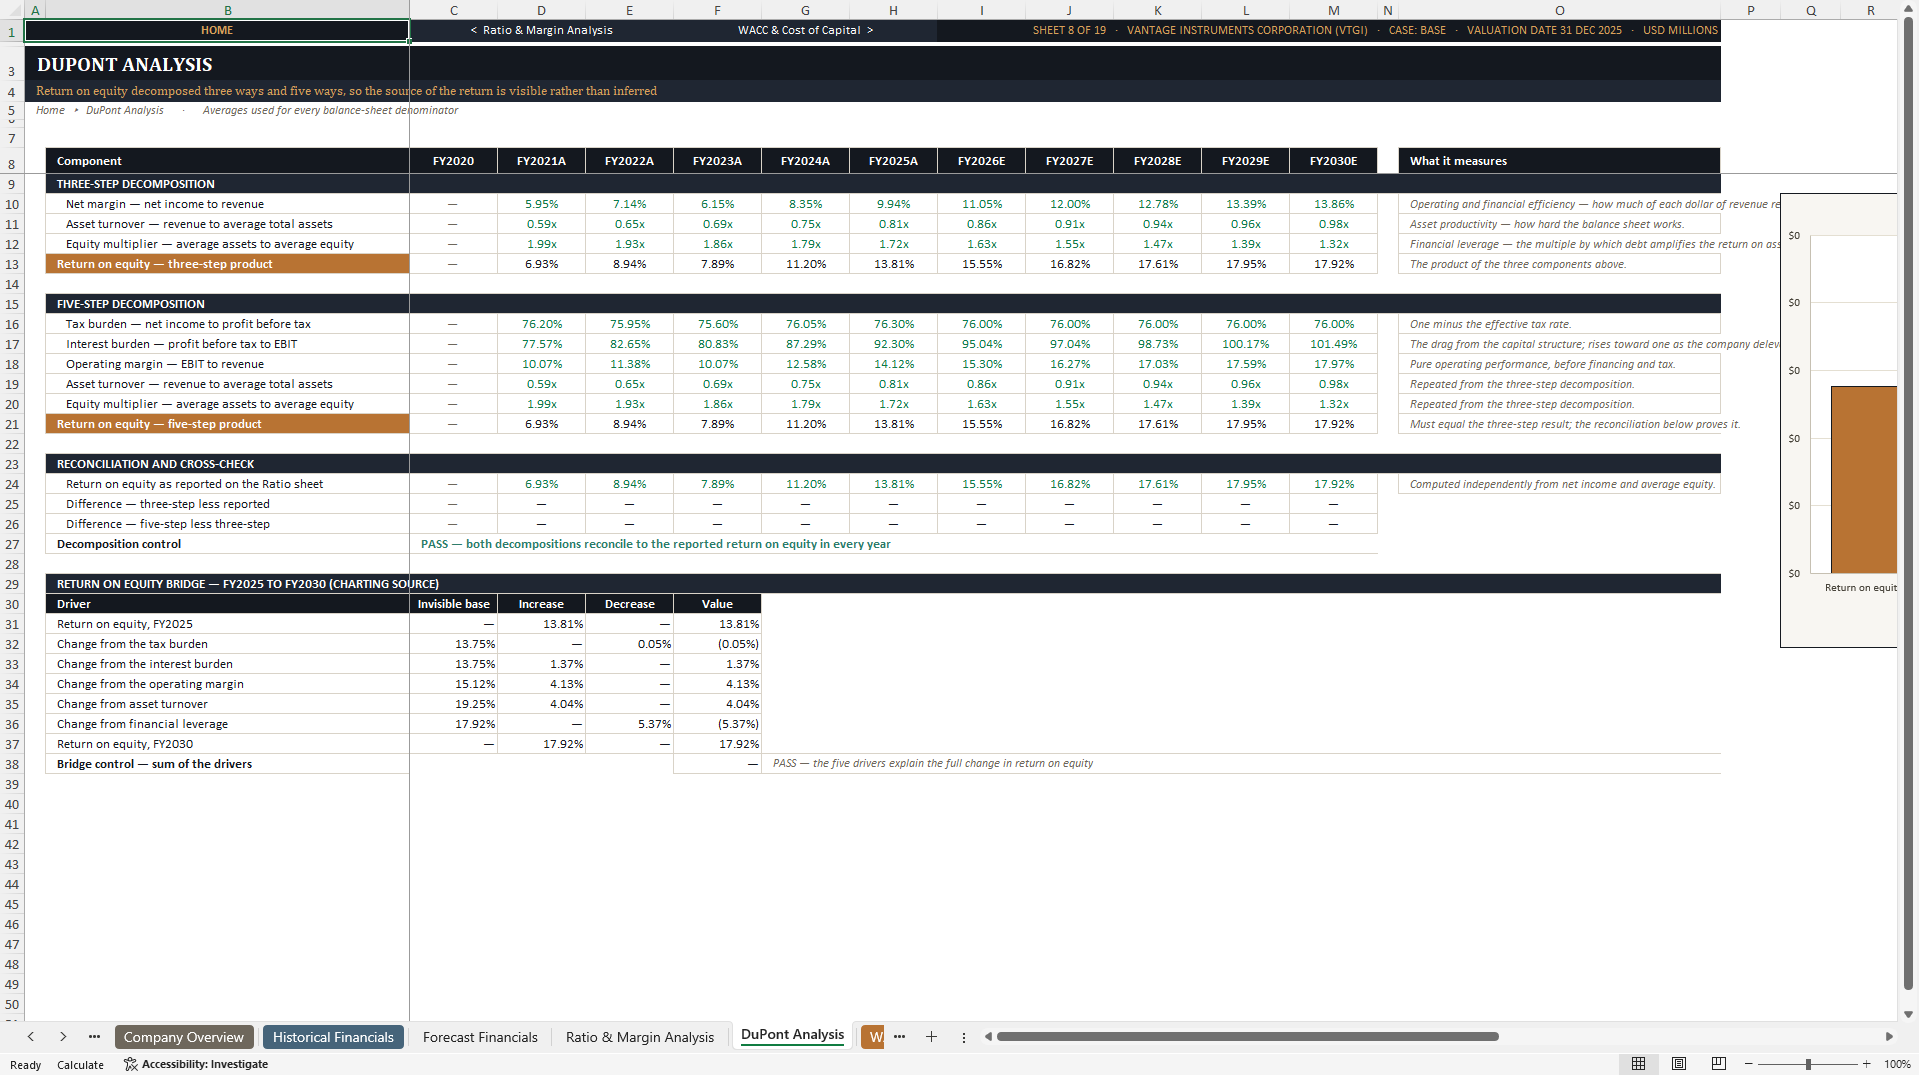
Three-step and five-step DuPont analysis
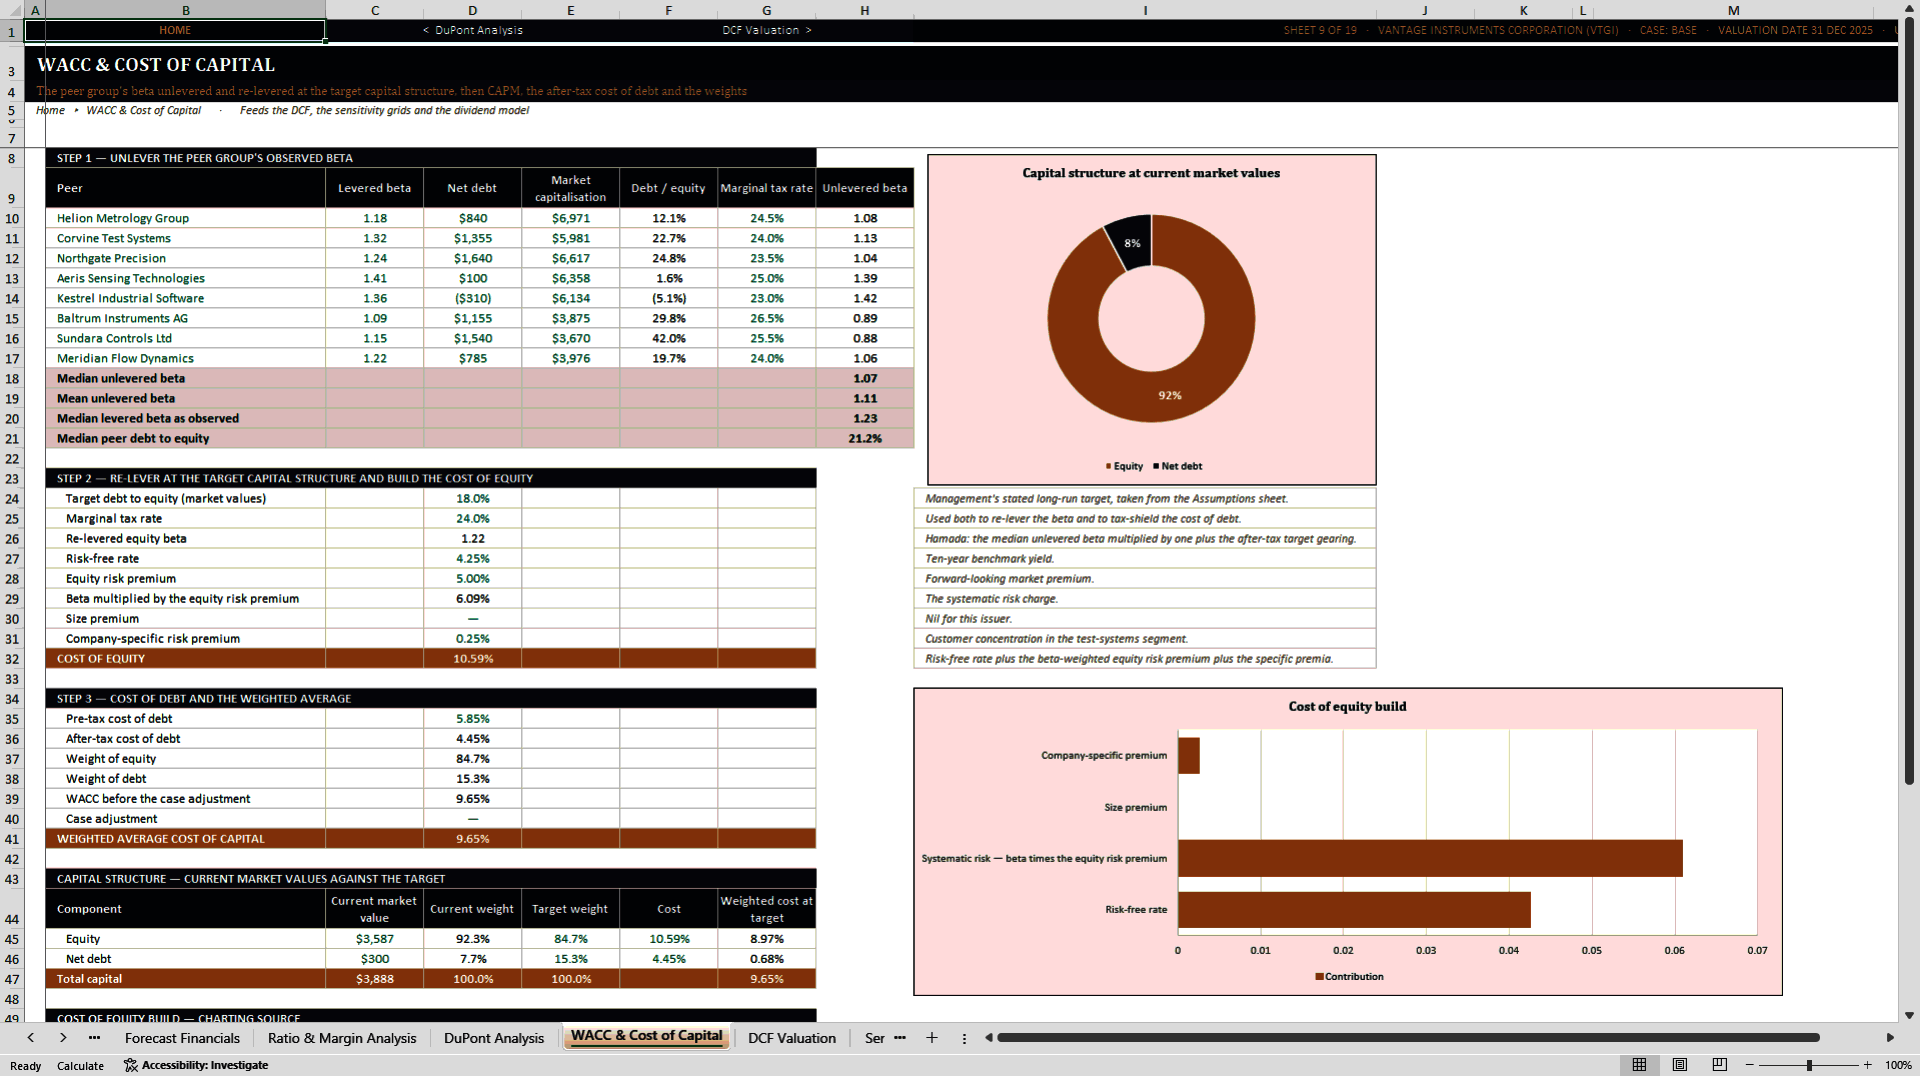
WACC and cost-of-capital build
Discounted cash flow valuation
Sensitivity analysis
Base, Bull, and Bear scenario analysis
Comparable-company analysis
Precedent-transaction analysis
Football-field valuation
Multi-stage dividend discount model
Executive dashboard
Audit log with 28 live checks
Disclaimer and model disclosures
Together, the historical and forecast periods provide a ten-year financial view from FY2021 through FY2030, with FY2020 opening balance-sheet support where required.
🏭 Segment-Level Operating Forecast
Instead of applying one growth rate to total revenue, the forecast is built around four distinct operating segments:
Precision Sensors
Test & Measurement Systems
Industrial Software & Analytics
Aftermarket & Services
Each segment can carry its own growth assumptions, allowing the model to reflect different demand patterns, recurring-revenue characteristics, and maturity profiles. Operating assumptions then flow through gross margin, selling and administrative expenses, research and development, capital expenditure, depreciation and amortization, working capital, taxes, financing, dividends, and share count.
This makes the template especially useful for industrial, manufacturing, instrumentation, technology-enabled, and mixed hardware–software businesses. It can also be adapted to other non-financial listed companies whose economics can be represented through operating segments and standard corporate financial statements.
🧾 Fully Linked Three-Statement Model
The workbook integrates the Income Statement, Balance Sheet, and Cash Flow Statement across the forecast period. The model covers revenue, cost of sales, operating expenses, EBITDA, EBIT, taxes, net income, cash, receivables, inventory, other working capital, property and equipment, intangible assets, debt, equity, retained earnings, cash from operations, investing activity, financing activity, dividends, buybacks, diluted shares, and earnings per share.
Key supporting mechanics include:
Revenue and margin assumptions by operating segment
Working-capital drivers based on operating days and percentages
Property, plant and equipment and intangible-asset roll-forwards
Debt amortization and revolver mechanics
Minimum-cash support
Dividend and share-repurchase assumptions
Basic and diluted share-count development
Stock-based-compensation cash-cost toggle
Opening-balance interest convention that avoids circular references
The statements are designed to articulate with each other, so a change in an operating assumption is carried through cash flow, the balance sheet, financing needs, per-share results, and valuation.
⚙️ Central Assumptions and Case Controls
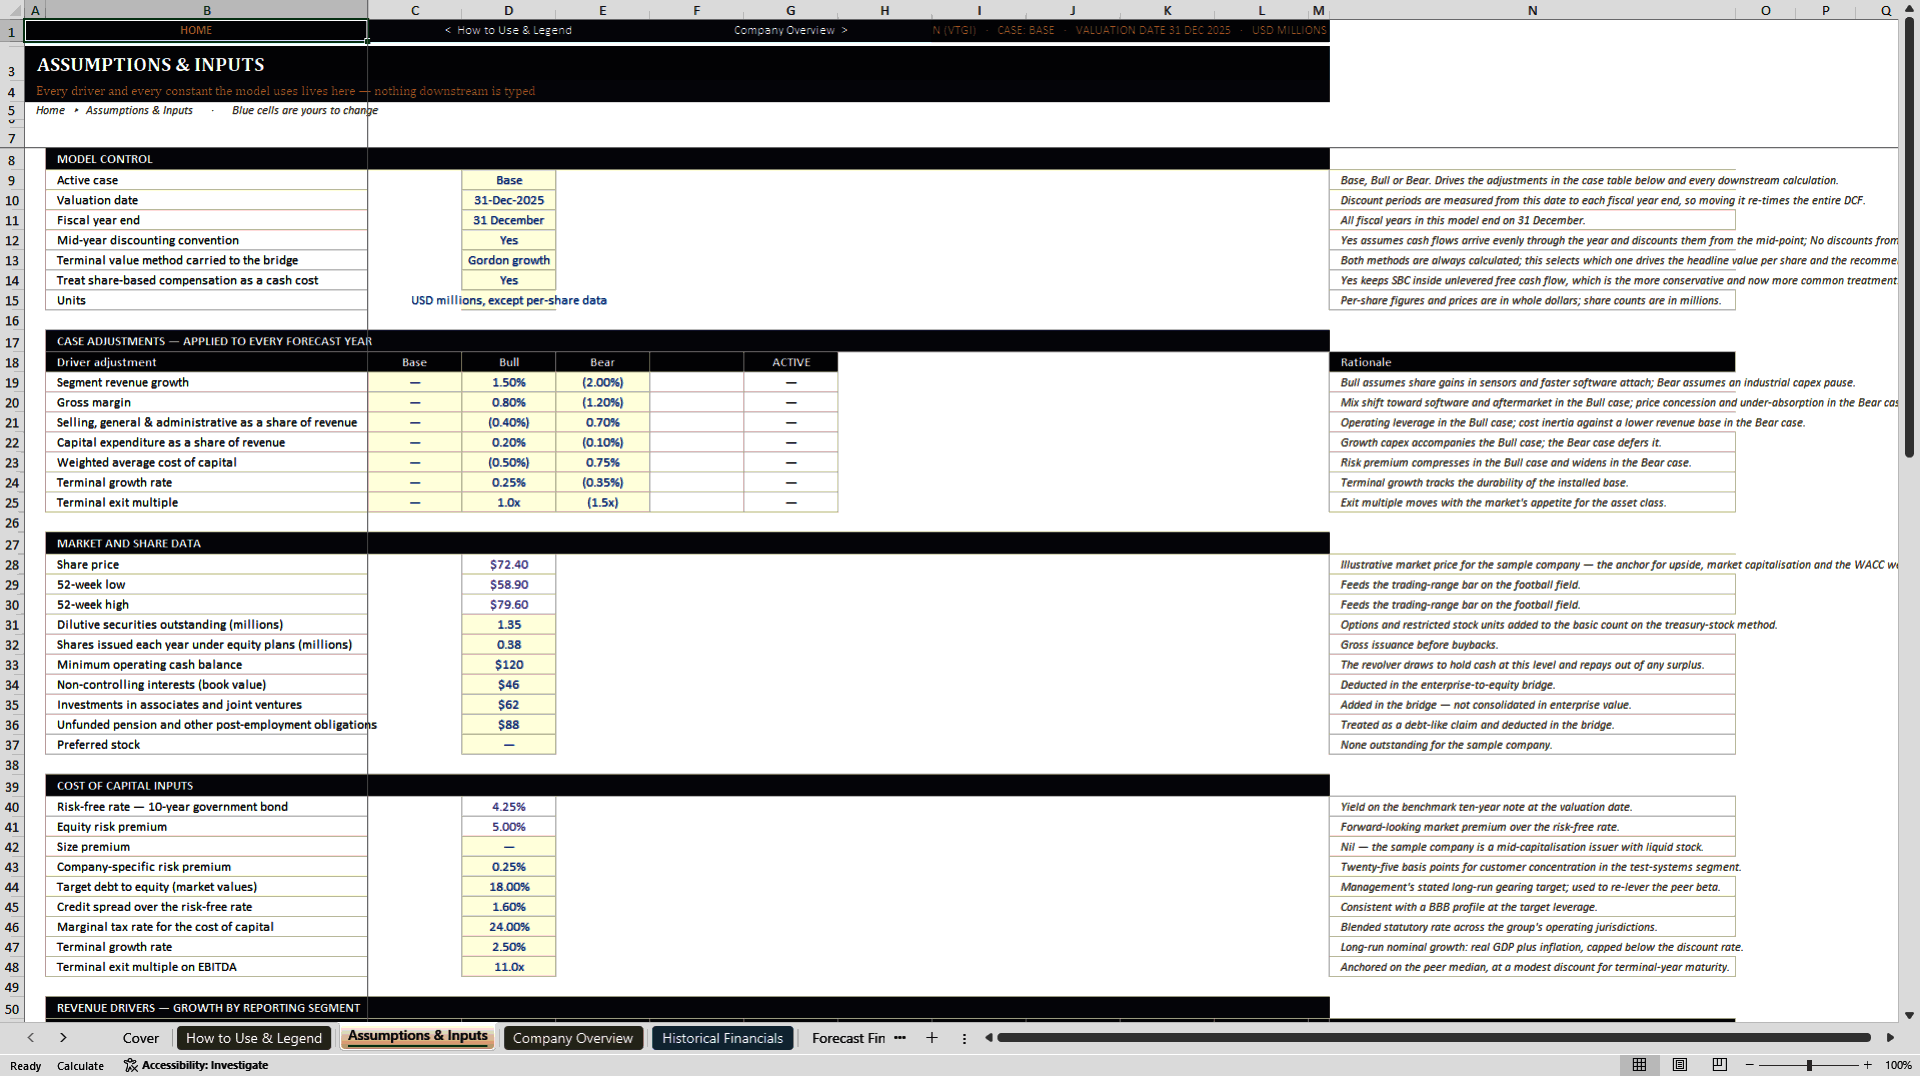
User-editable assumptions are centralized and visually distinguished from calculated cells. The model includes an active Base / Bull / Bear case selector, a valuation date, mid-year versus end-year discounting, a terminal-method selector, and valuation-specific inputs.
Scenario overlays can adjust:
Segment revenue growth
Gross margin
Selling and administrative expense as a percentage of revenue
Capital expenditure as a percentage of revenue
WACC
Perpetual terminal growth
Terminal exit multiple
The active case drives the complete three-statement model. The Scenario Analysis sheet also runs independent mirrored cash-flow engines for all three cases, preventing the Bull and Bear outputs from becoming static typed numbers.
💰 Peer-Based WACC and Cost of Capital
The cost-of-capital module provides a transparent build rather than asking the user to type a discount rate without support. It includes:
Peer levered betas
Unlevering using peer capital structures and tax rates
Median unlevered beta
Re-levering at the target debt-to-equity structure
CAPM cost of equity
Risk-free rate, equity risk premium, and specific premia
Pre-tax and after-tax cost of debt
Current and target capital-structure weights
Scenario-specific WACC adjustment
In the included sample case, the workbook calculates a 9.65% WACC and a 10.59% cost of equity. These are illustrative model outputs, not current market assumptions.
🧮 Institutional-Style DCF Valuation
The DCF converts operating forecasts into unlevered free cash flow using EBIT, cash taxes, depreciation and amortization, capital expenditure, and changes in net working capital. Forecast cash flows are discounted from the selected valuation date, with a toggle for mid-year or end-year convention.
Both principal terminal-value methods are calculated:
Gordon Growth perpetuity
Exit multiple on terminal-year EBITDA
The user can select the active method while retaining the alternative as a cross-check. The model also calculates the perpetual growth rate implied by the exit multiple and the exit multiple implied by the perpetual growth rate—useful tests for identifying inconsistent terminal assumptions.
Enterprise value is converted to equity value through a clear bridge covering cash, debt, non-controlling interests, and other relevant claims before dividing by diluted shares. The resulting value per share, upside or downside, and formula-driven recommendation update automatically.
In the fictional Base Case, the sample DCF produces $75.32 per share versus a $72.40 illustrative market price, or approximately 4.0% upside, resulting in a formula-driven HOLD classification. These values demonstrate the mechanics and must be replaced with researched inputs before real-world use.
🧪 Sensitivity and Genuine Three-Case Analysis
The workbook helps the analyst understand valuation risk instead of relying on a single point estimate. It includes two-dimensional DCF sensitivity tables for key terminal assumptions and additional operating sensitivities.
The Scenario Analysis sheet runs complete Base, Bull, and Bear cash-flow engines. In the sample data, the model calculates:
Base Case: $75.32 per share
Bull Case: $94.37 per share
Bear Case: $53.42 per share
Each case reflects changes in operating performance, capital intensity, discount rate, and terminal assumptions. A live consistency control proves that the selected scenario reproduces the active three-statement model's unlevered free cash flow.
🏢 Trading Comparables and Precedent Transactions
The Comparable Companies module includes eight fictional peer companies and supports analysis of:
Enterprise value to revenue
Enterprise value to EBITDA
Enterprise value to EBIT
Price to earnings
Forward EBITDA and earnings multiples
Growth, margin, and leverage statistics
Median and quartile ranges
Implied enterprise and equity values
Implied value per share
The Precedent Transactions module contains eight fictional transactions announced over an illustrative thirty-six-month period. It analyzes revenue and EBITDA transaction multiples, target margins, acquisition premiums, quartiles, and implied value per share. Both approaches use the same enterprise-to-equity bridge as the DCF, improving comparability across methods.
💵 Multi-Stage Dividend Discount Model
The dividend model provides an independent equity-value cross-check by discounting distributions at the cost of equity rather than the WACC. It includes five explicit forecast dividends, a terminal-growth stage, a terminal payout ratio linked to growth and return on equity, value per share, upside or downside, and a valuation range based on the cost of equity plus or minus 100 basis points.
The DDM is intentionally treated as a supporting floor for a company retaining and reinvesting a meaningful portion of earnings. This avoids presenting dividend value as interchangeable with enterprise free-cash-flow value.
📊 Football Field and Executive Dashboard
The Football Field consolidates valuation ranges from:
DCF using Gordon Growth
DCF using an exit multiple
Bear-to-Bull scenarios
Trading comparables using EV/EBITDA
Trading comparables using P/E
Precedent transactions
Dividend discount sensitivities
The illustrative 52-week share-price range
An executive dashboard summarizes the share price, DCF value per share, upside or downside, recommendation, case selection, WACC, cost of equity, terminal assumptions, operating forecast, valuation-method comparison, and control status. The workbook contains 23 charts across the analysis, including trend, valuation-range, bridge, and diagnostic visuals.
✅ 28 Live Audit and Integrity Checks
The Audit Log monitors the integrity of the model with 28 formula-based checks. These cover balance-sheet balancing, cash-flow reconciliation, cash roll-forward, debt and share-count logic, scenario consistency, valuation bridges, football-field ranges, terminal assumptions, dashboard outputs, and other critical dependencies.
The supplied sample file reports all 28 controls passing with zero exceptions. Because the checks are live, they continue to help identify issues as users replace the assumptions and data.
🛠️ How to Use the Model
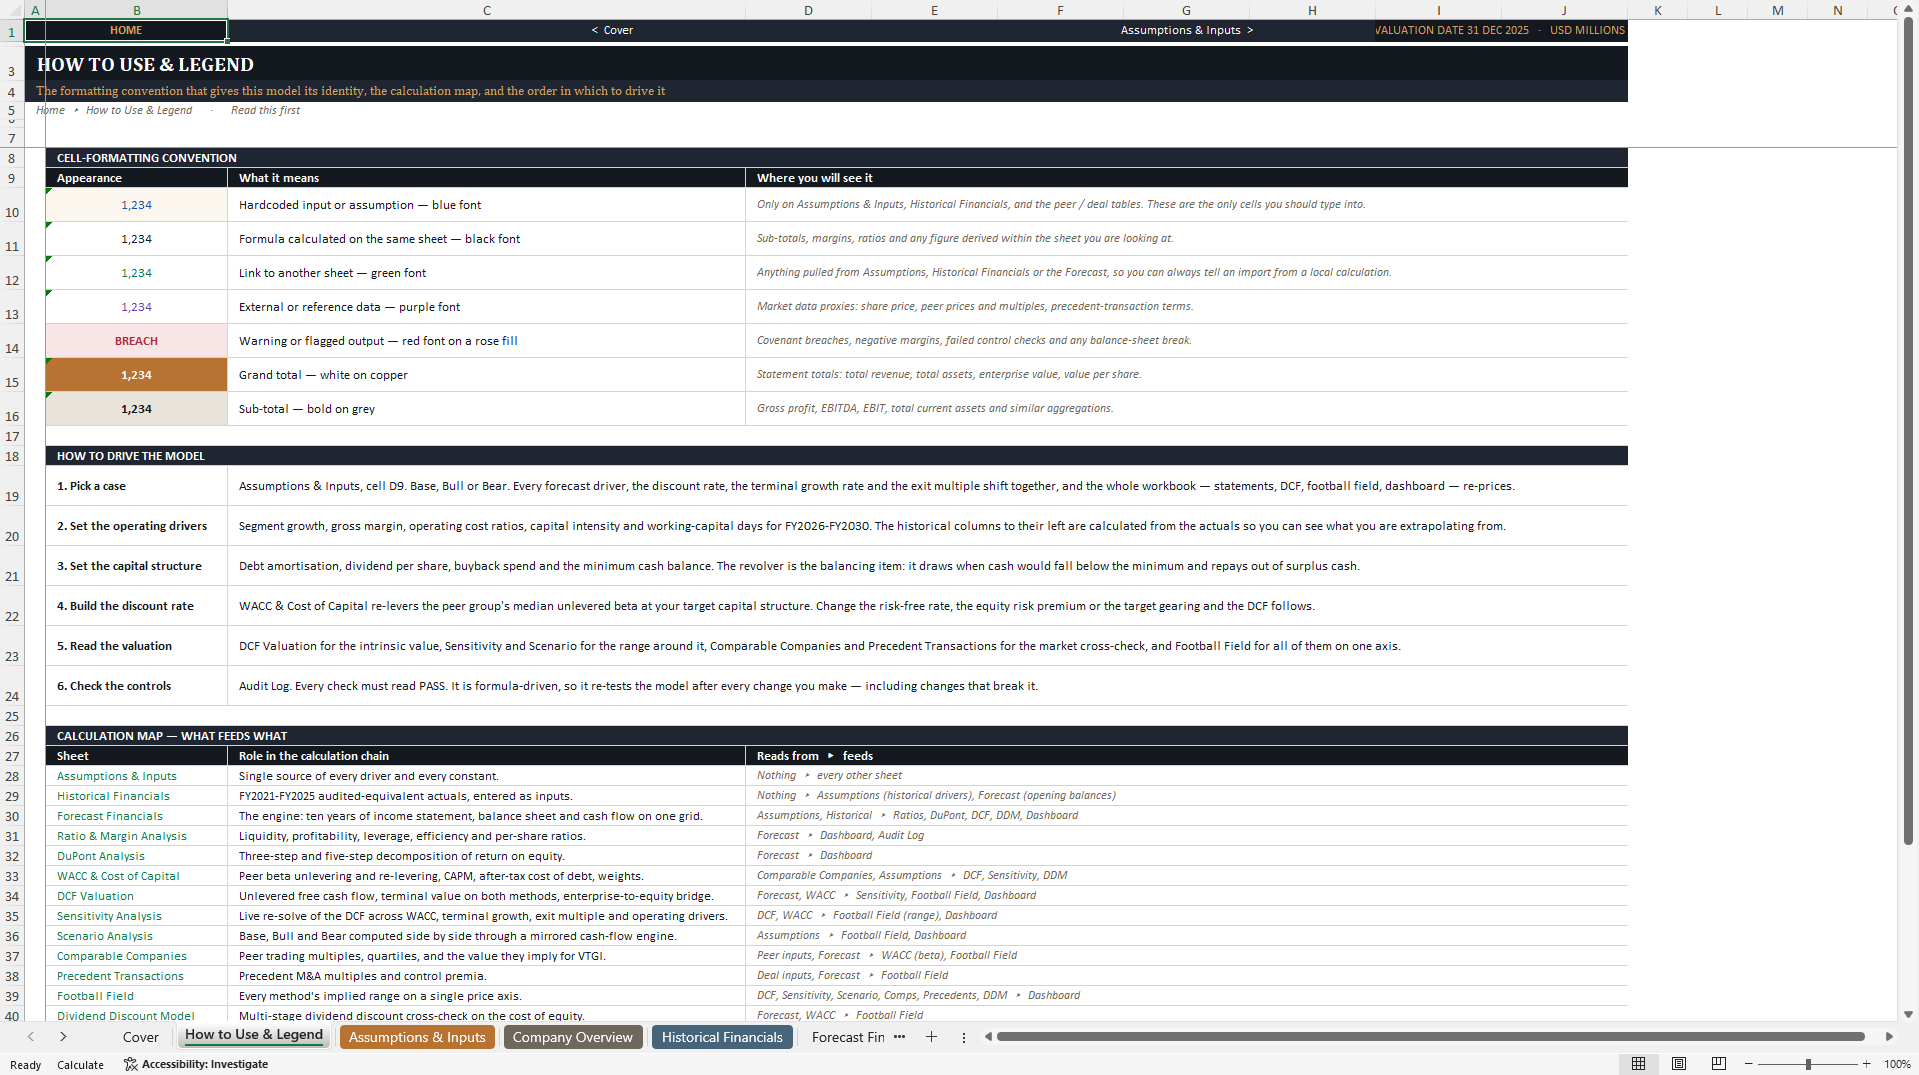
Read the How to Use & Legend sheet and review the disclosures.
Replace the fictional company, market, peer, and transaction inputs with researched data.
Enter historical financial statements and opening balances.
Set segment growth, margins, working capital, capital expenditure, financing, dividend, and share-count assumptions.
Select the active Base, Bull, or Bear case.
Review the linked forecast statements, ratios, and DuPont analysis.
Validate the WACC inputs and target capital structure.
Select the DCF convention and terminal method.
Review sensitivities, scenario values, comparables, precedents, the DDM, and the football field.
Confirm that the Audit Log is fully passing before using or presenting any conclusion.
🎯 Who Should Buy This Model?
This workbook is designed for:
Equity research analysts
Investment analysts and portfolio professionals
Corporate finance and valuation teams
Investment-banking and transaction-advisory professionals
Private-equity and venture-capital analysts evaluating mature operating businesses
Finance students, educators, and modeling trainees
Business owners and consultants preparing decision-support analysis
🚫 When Is It Not the Right Fit?
The workbook is not designed for banks, insurers, funds, pre-revenue startups, project-finance vehicles, real estate assets, or highly regulated financial institutions without material restructuring. It does not automatically download market data, perform trade execution, guarantee investment outcomes, or replace professional due diligence.
The forecast is annual and does not explicitly model intra-year seasonality. Taxes use an effective-rate approach rather than a full deferred-tax and loss-carryforward schedule. Acquisitions, disposals, foreign-currency translation, and complex equity issuances are not modeled as standalone transaction modules.
📦 Delivery and Technical Details
One fully editable Microsoft Excel workbook
Approximate file size: 0.22 MB
19 worksheets
23 charts
28 live audit checks
No macros or VBA
No external links
No external data connections
No locked black-box calculations
Got a question about the product? Email us at support@flevy.com or ask the author directly by using the "Ask the Author a Question" form. If you cannot view the preview above this document description, go here to view the large preview instead.
Source: Best Practices in Valuation, Integrated Financial Model Excel: Stock Analysis and Valuation Model Excel (XLSX) Spreadsheet, PDMM Financial Models
ABOUT THE AUTHOR

PDMM Financial Models develops professional, decision-ready Excel models for business owners, entrepreneurs, investors, consultants, analysts, and finance teams. Our objective is to transform complex business assumptions into clear, structured analysis that supports better planning and investment decisions.
Our models cover business planning, forecasting, budgeting, feasibility analysis,
... [read more]
Ask the Author a Question
You must be logged in to contact the author.




























