
 Click main image to view in full screen. Unlock all 13 preview images:
Three Statement Financial Model: Revolver, Covenants, DCF – Excel XLSX
Excel (XLSX) + supplemental PDF


BENEFITS OF THIS DOWNLOADABLE EXCEL DOCUMENT
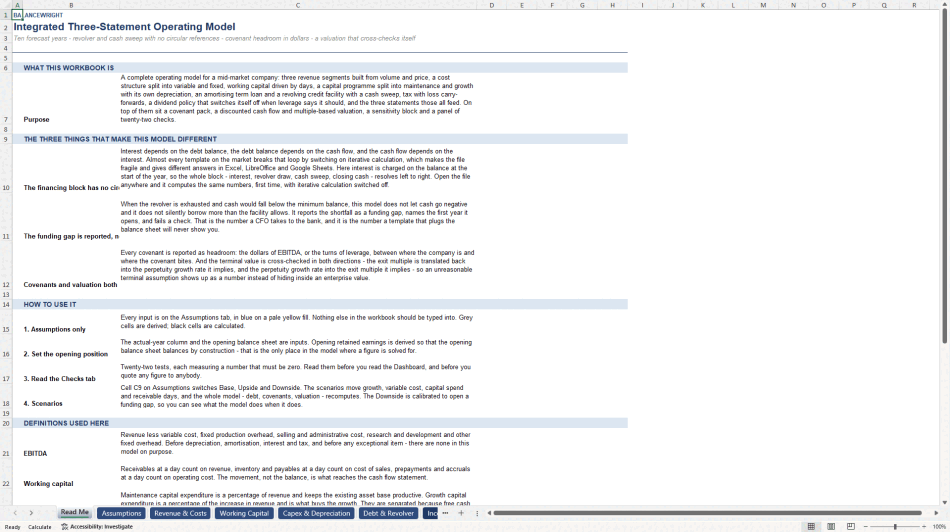
- Removes the circular reference every other three-statement template lives with: interest is charged on opening balances, so the revolver, the sweep and the cash position resolve in one left-to-right pass, with iterative calculation switched off.
- Reports the funding gap instead of hiding it: when the revolver is exhausted the model names the shortfall and the year it opens, carries it on the balance sheet so the statements still balance, and fails a check.
- Four covenant tests reported as headroom in dollars of EBITDA with the binding test named each year, and a terminal value cross-checked in both directions against the growth rate and the exit multiple it implies.
VALUATION EXCEL DESCRIPTION
A Three Statement Financial Model over ten forecast years: an income statement, a balance sheet and a cash flow statement that tie to each other, with a revolving credit facility and a cash sweep that resolve without a single circular reference.
Three-statement templates are the most crowded shelf in financial modelling, and almost all of them have the same hole in the same place. The revolver draws when cash runs short. The interest charge depends on how much is drawn. The cash position depends on the interest charge. That is a loop, and there are only two honest ways out of it: switch on iterative calculation, which makes the file fragile and gives different answers in LibreOffice and Google Sheets, or leave the revolver out altogether and let cash go negative in a bad year.
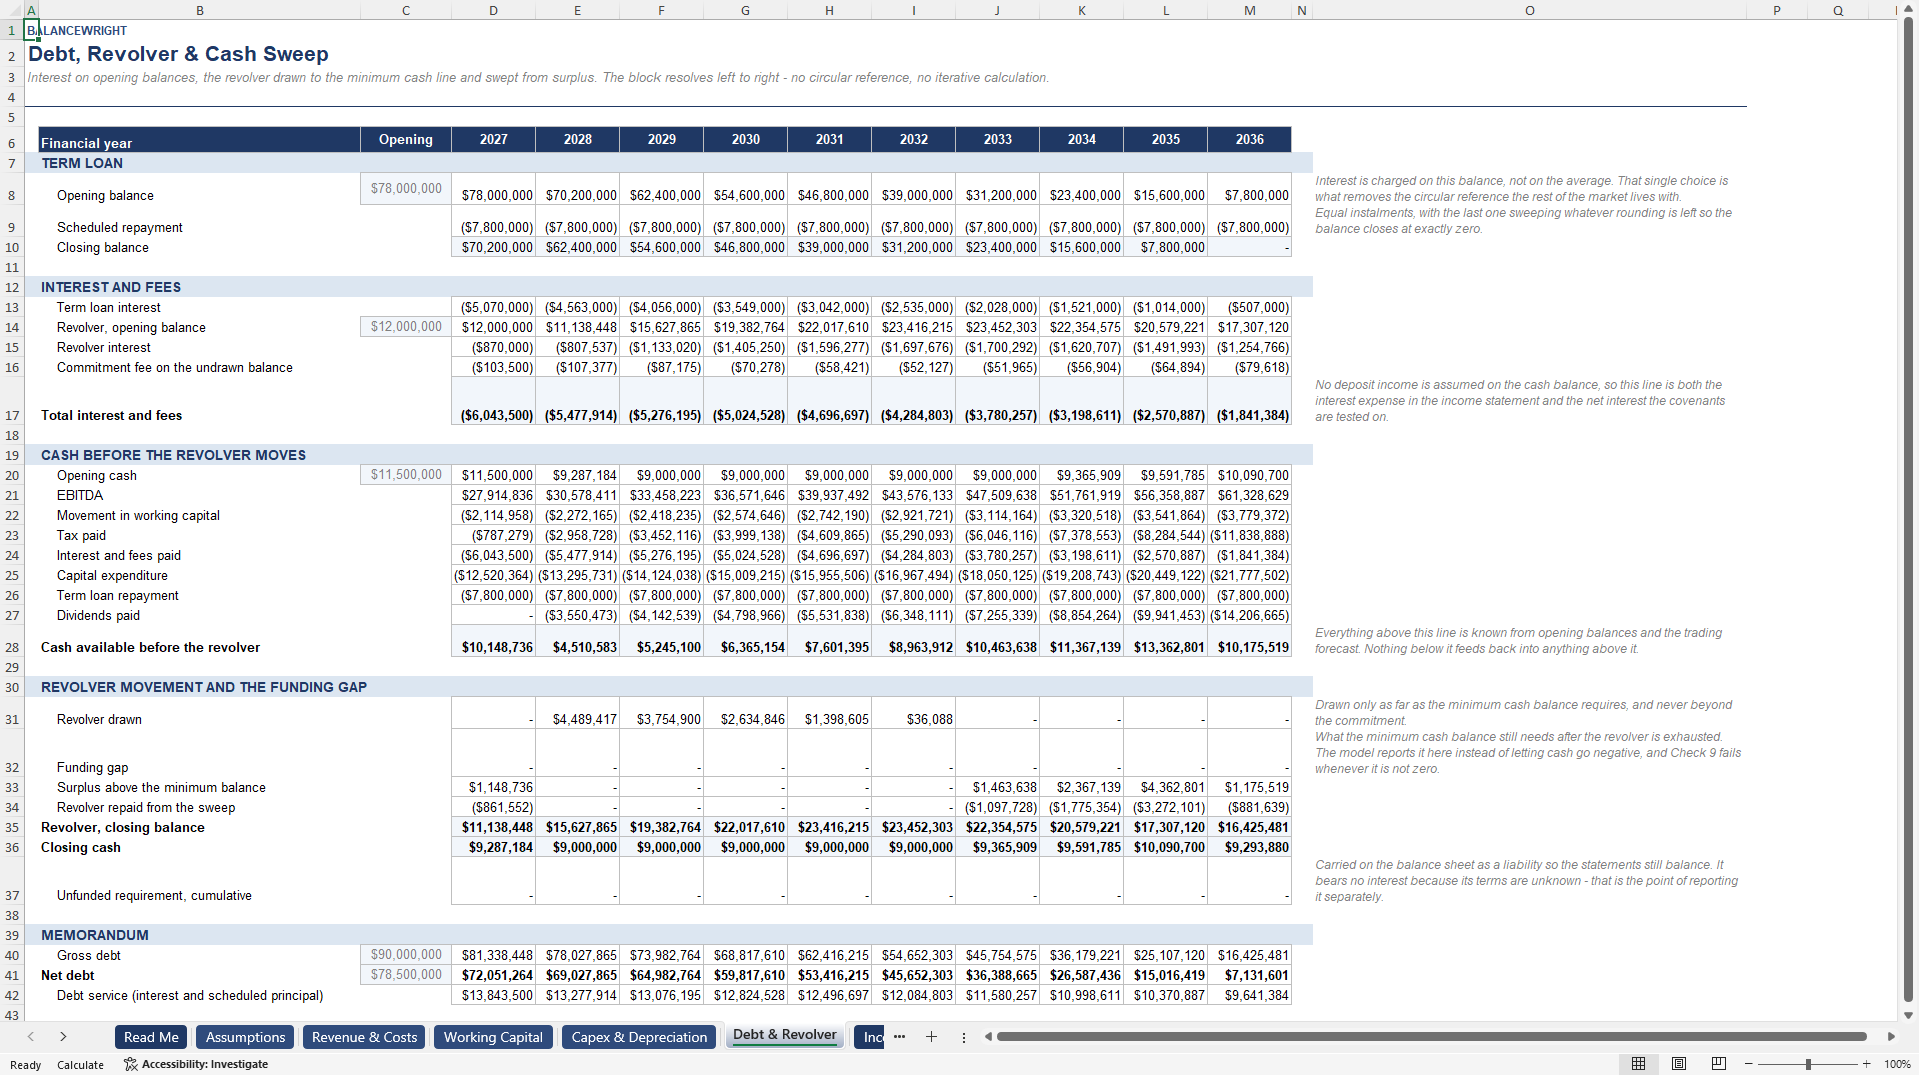
This model takes the third way. Interest is charged on the balance at the start of the year, so the interest for a year is known before that year's cash flow is computed, the revolver draw is a function of a cash position that is already settled, and the entire financing block resolves left to right in one pass. There is not a single circular reference anywhere in the file. It computes the same numbers in every spreadsheet application, first time, with iterative calculation switched off – and Check 15 on the Checks tab proves it by recomputing every interest charge in the workbook from the opening balances and their rates.
WHAT IS IN THE WORKBOOK
Fourteen tabs and 2,055 live formulas across ten forecast years and an opening actual column.
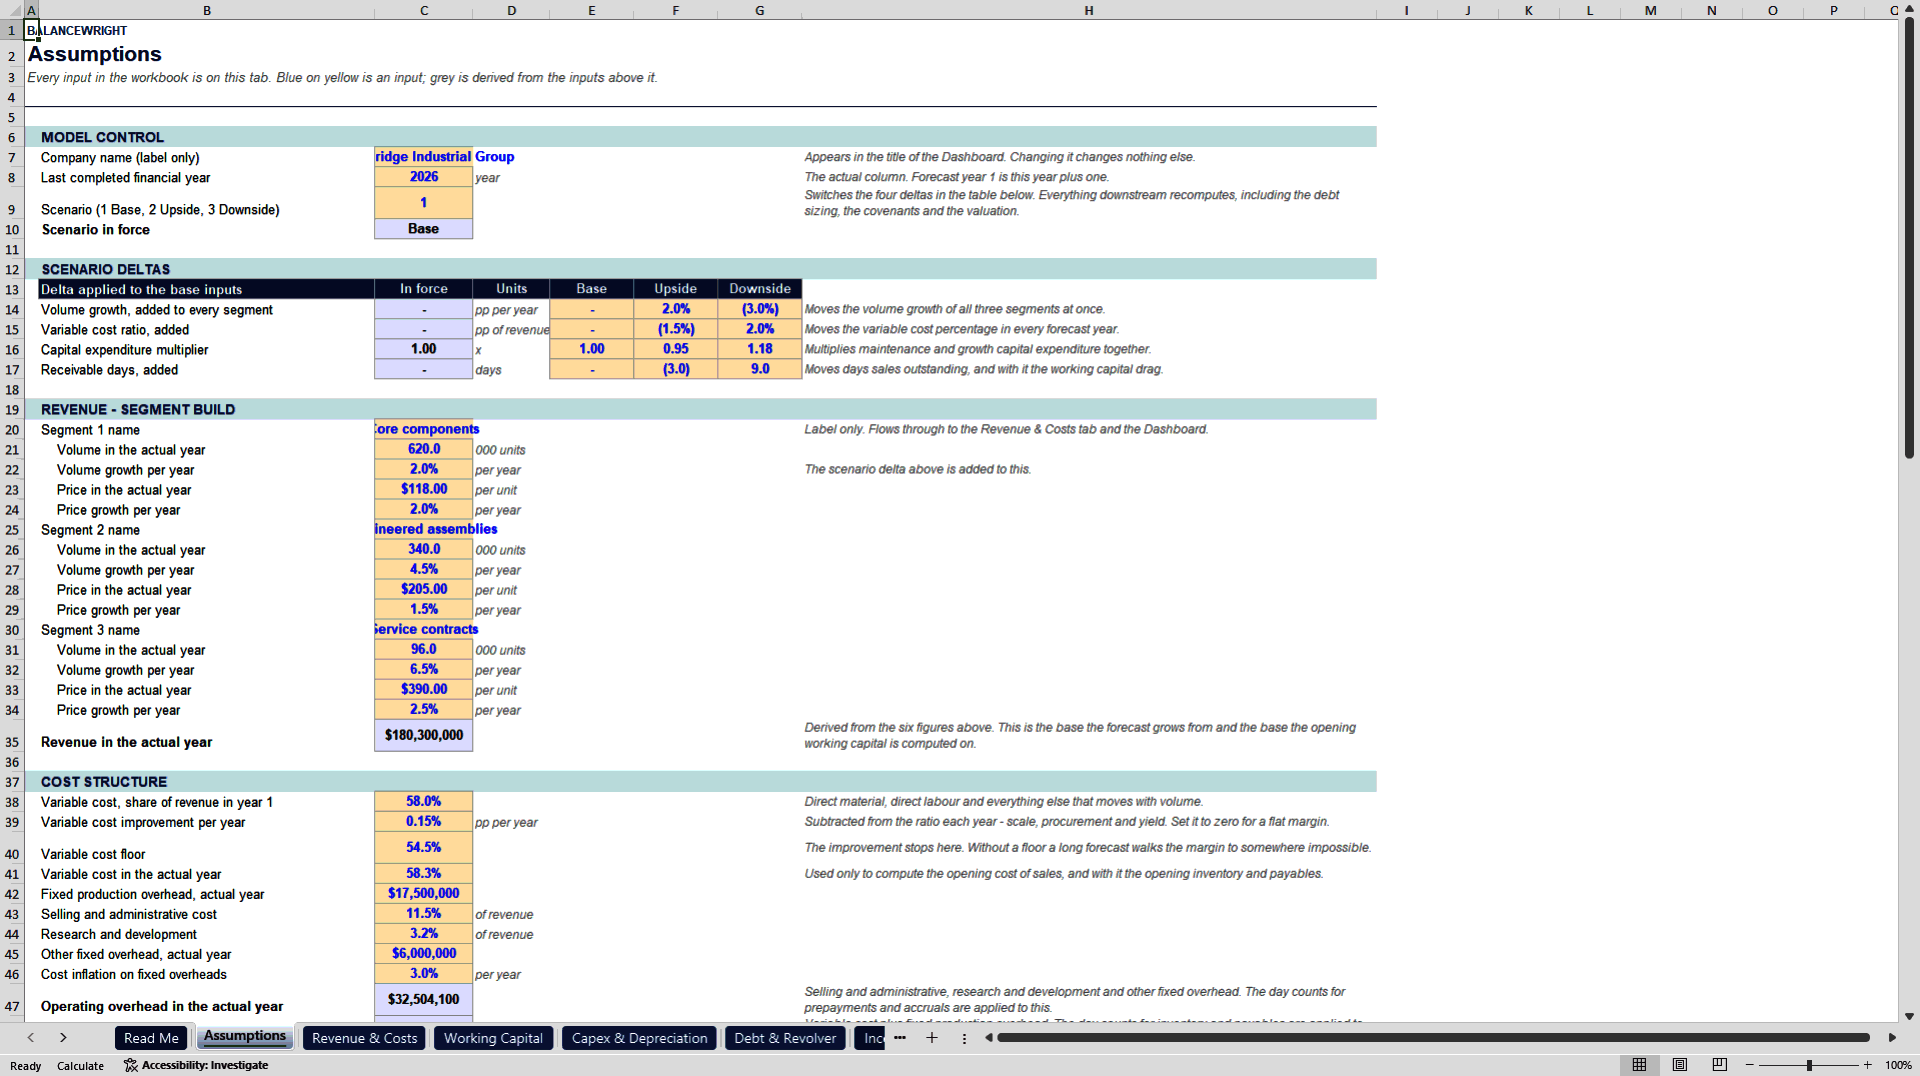
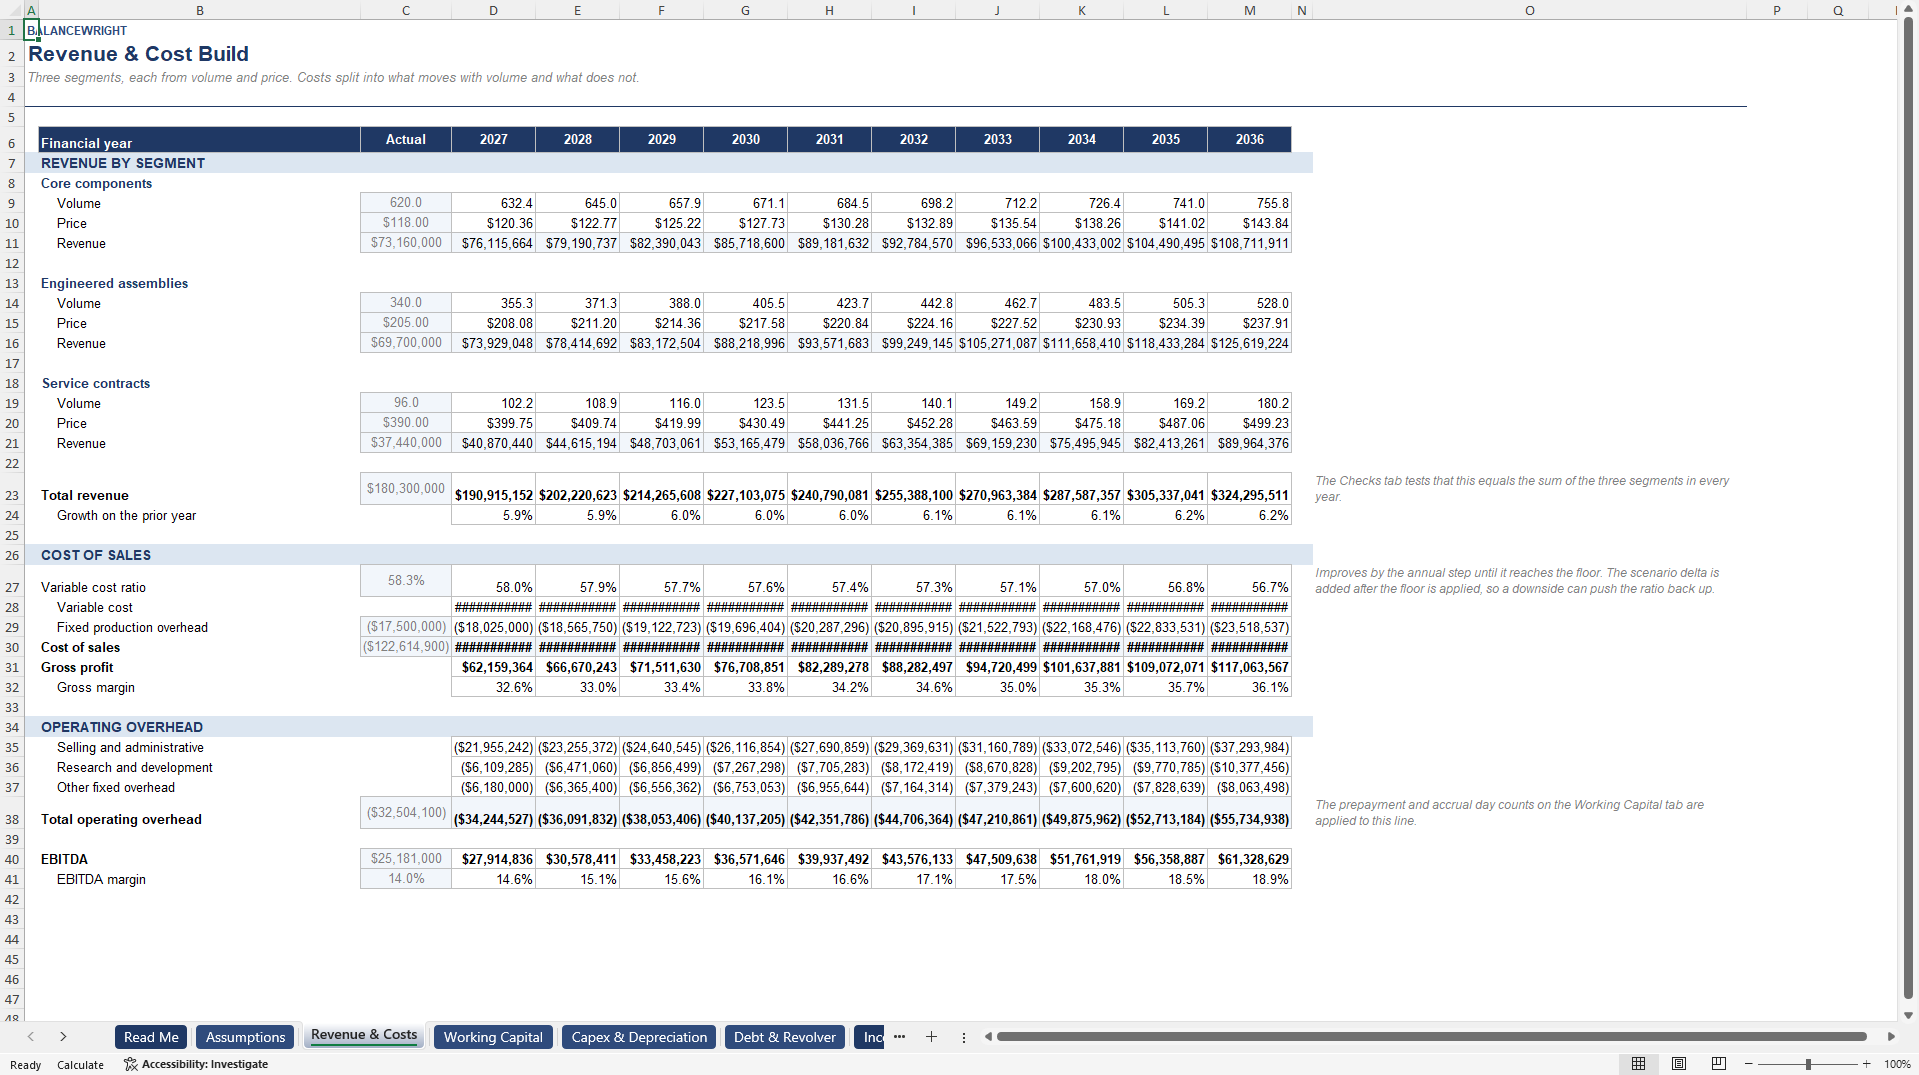
Revenue is built from three segments, each with its own volume, volume growth, price and price growth. Cost is split into what moves with volume and what does not: a variable cost ratio that improves by a step each year down to a floor you set, fixed production overhead and other fixed overhead that inflate, and selling, administrative and research cost as percentages of revenue.
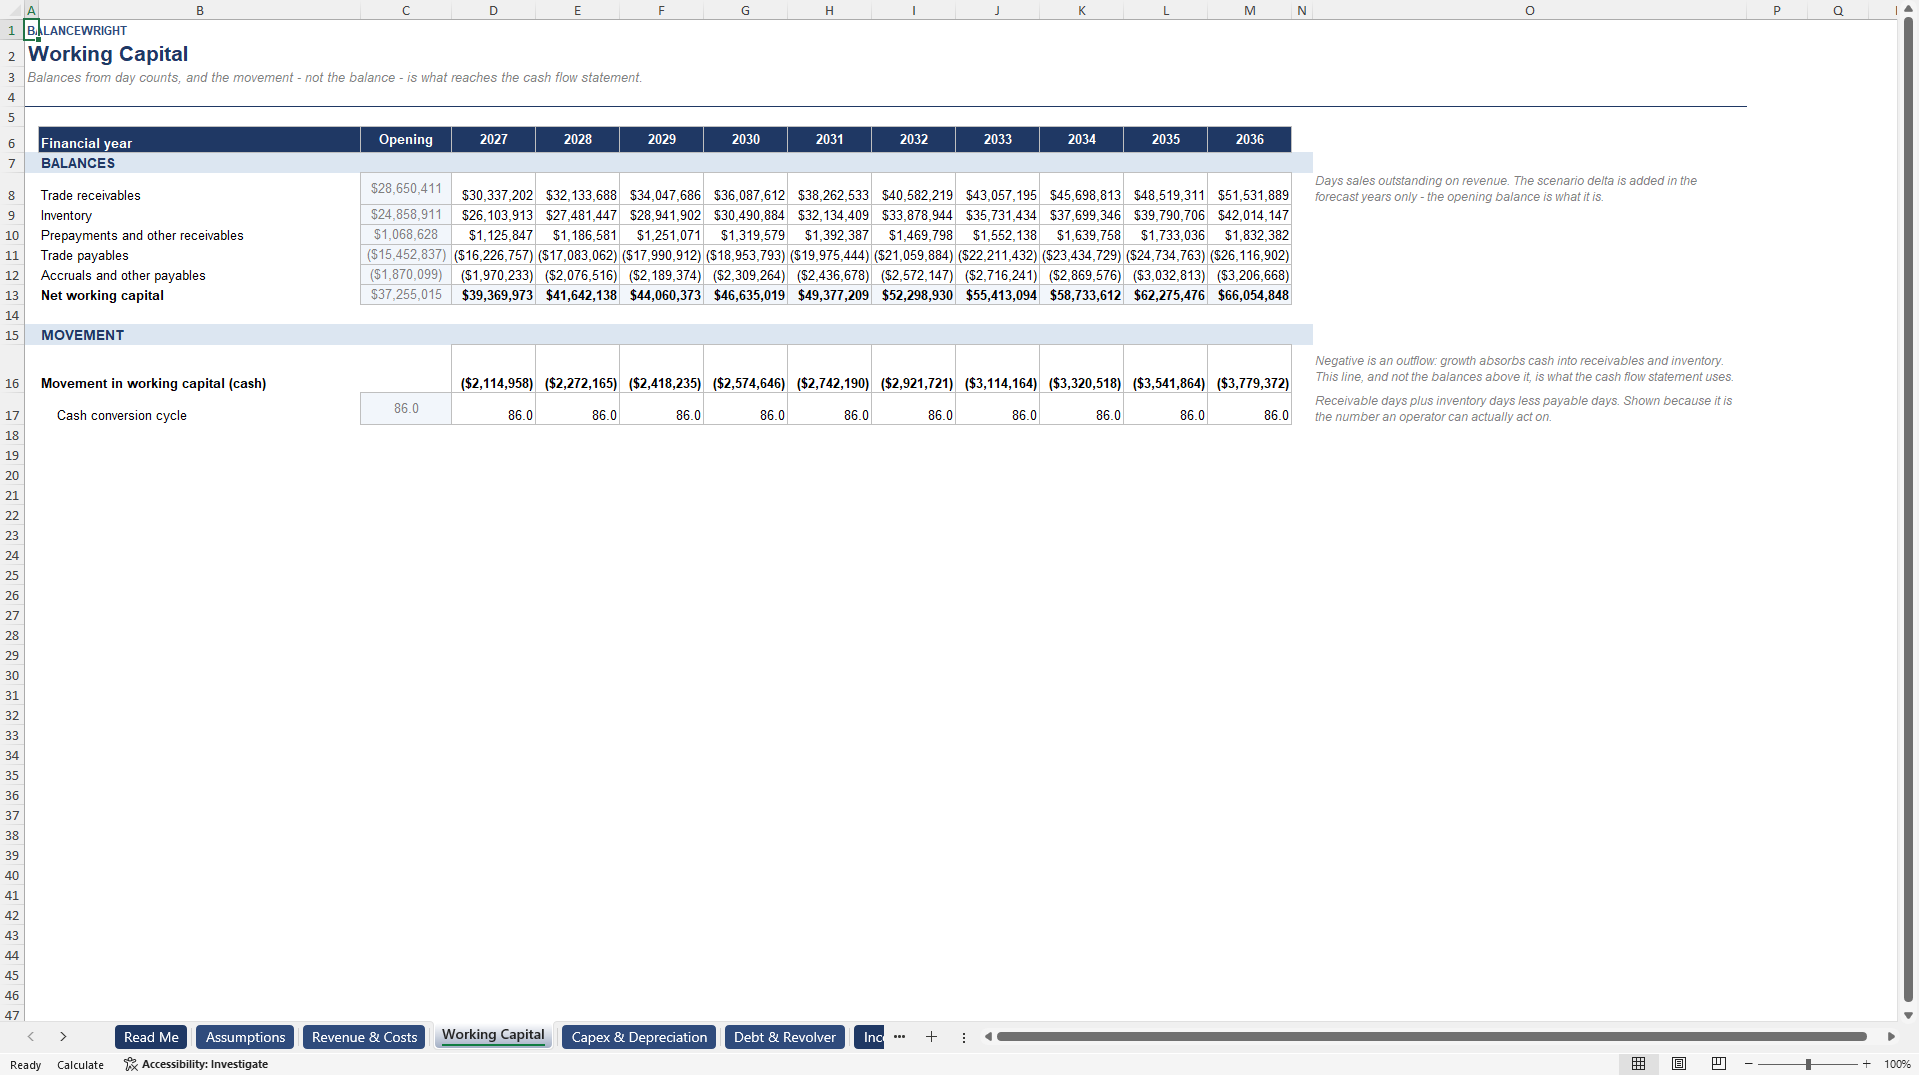
Working capital is driven by five day counts – receivable days on revenue, inventory and payable days on cost of sales, prepayment and accrual days on operating overhead – and it is the movement, not the balance, that reaches the cash flow statement.
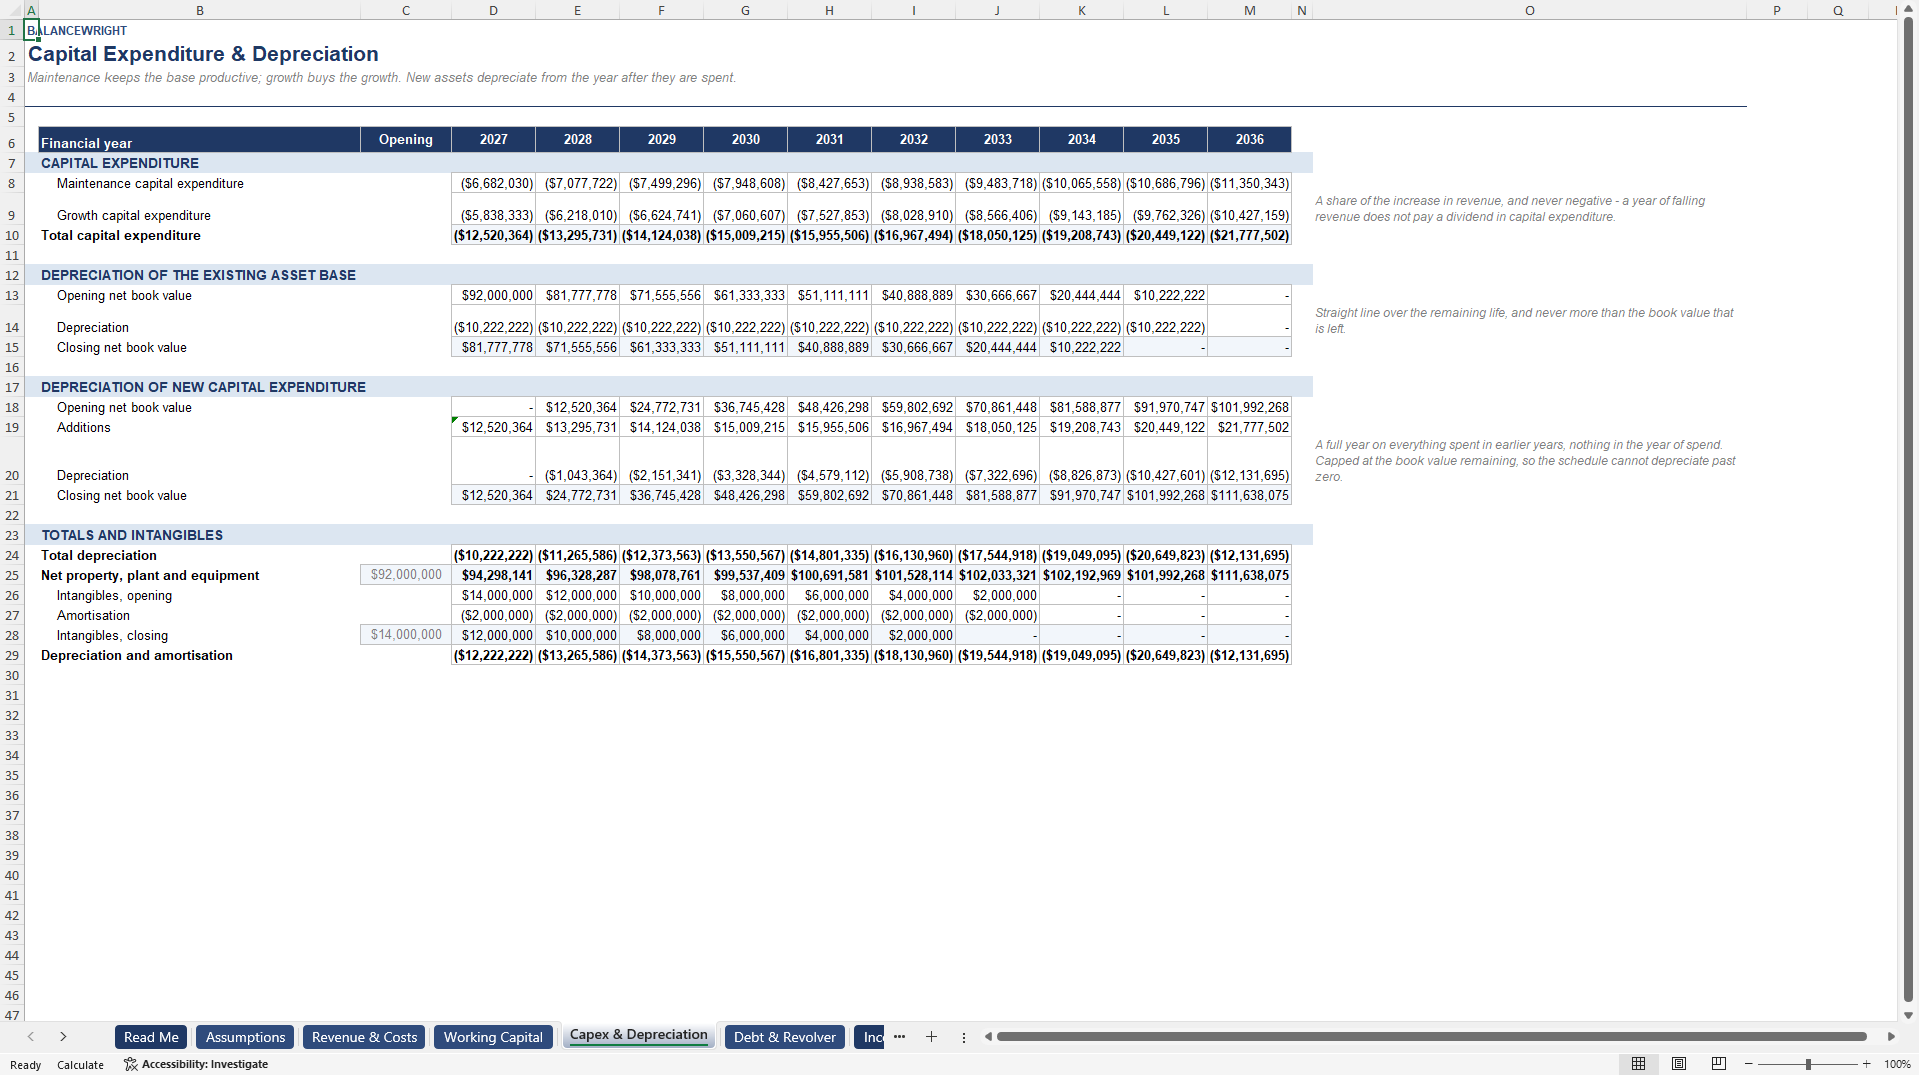
Capital expenditure is separated into maintenance, as a share of revenue, and growth, as a share of the increase in revenue, because free cash flow and the fixed charge cover ratio treat them differently. Each has its own depreciation: the opening asset base is written off over its remaining life, and new spend depreciates from the year after it is incurred, capped so the schedule can never depreciate past zero.
The financing block carries an amortising term loan whose instalment is capped at the balance outstanding, a revolving credit facility with a commitment fee on the undrawn balance, a minimum cash balance the revolver is drawn to hold, and a cash sweep that applies an agreed share of surplus cash to repaying the revolver.
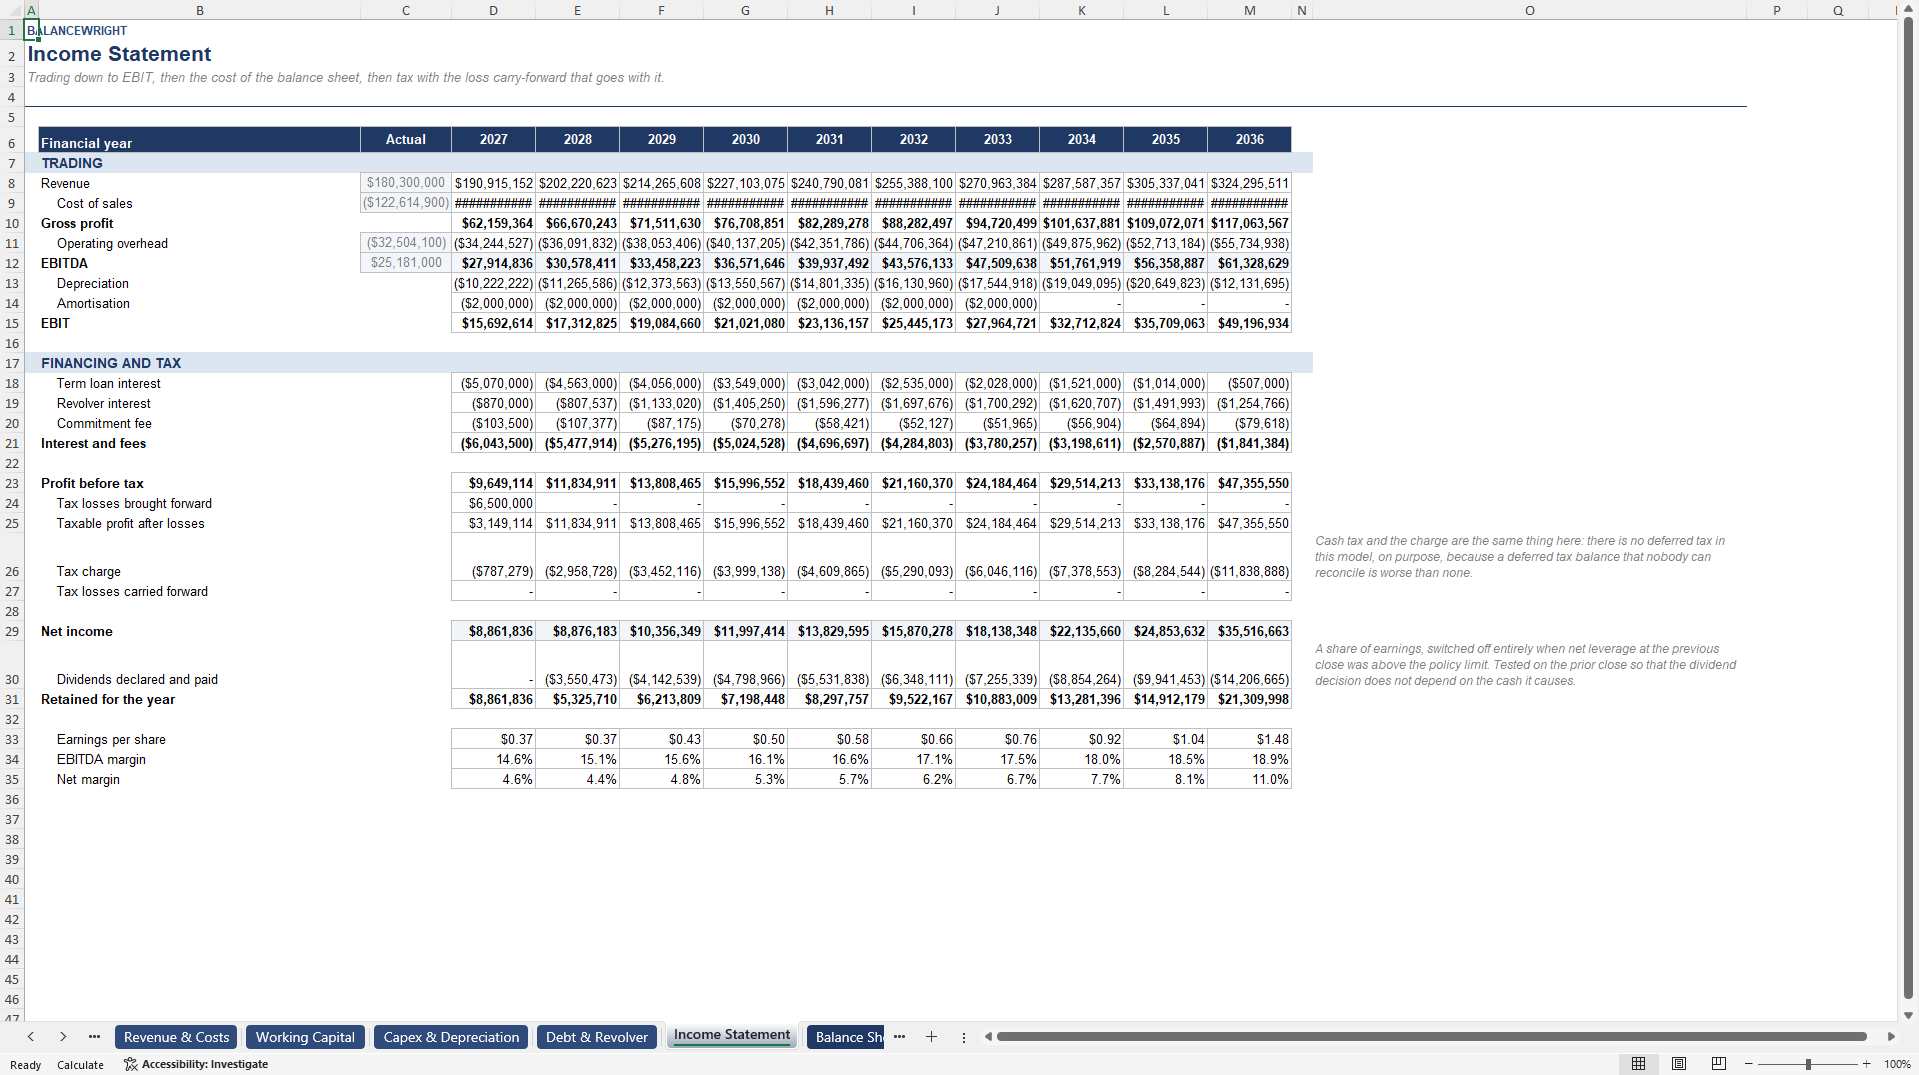
Tax runs through a loss carry-forward pool that is used before any tax is paid and never allowed to go negative. The dividend is a policy rather than an input: a share of earnings, switched off entirely in any year following a close above the leverage limit you set, and tested on the prior close so the dividend decision never depends on the cash it causes.
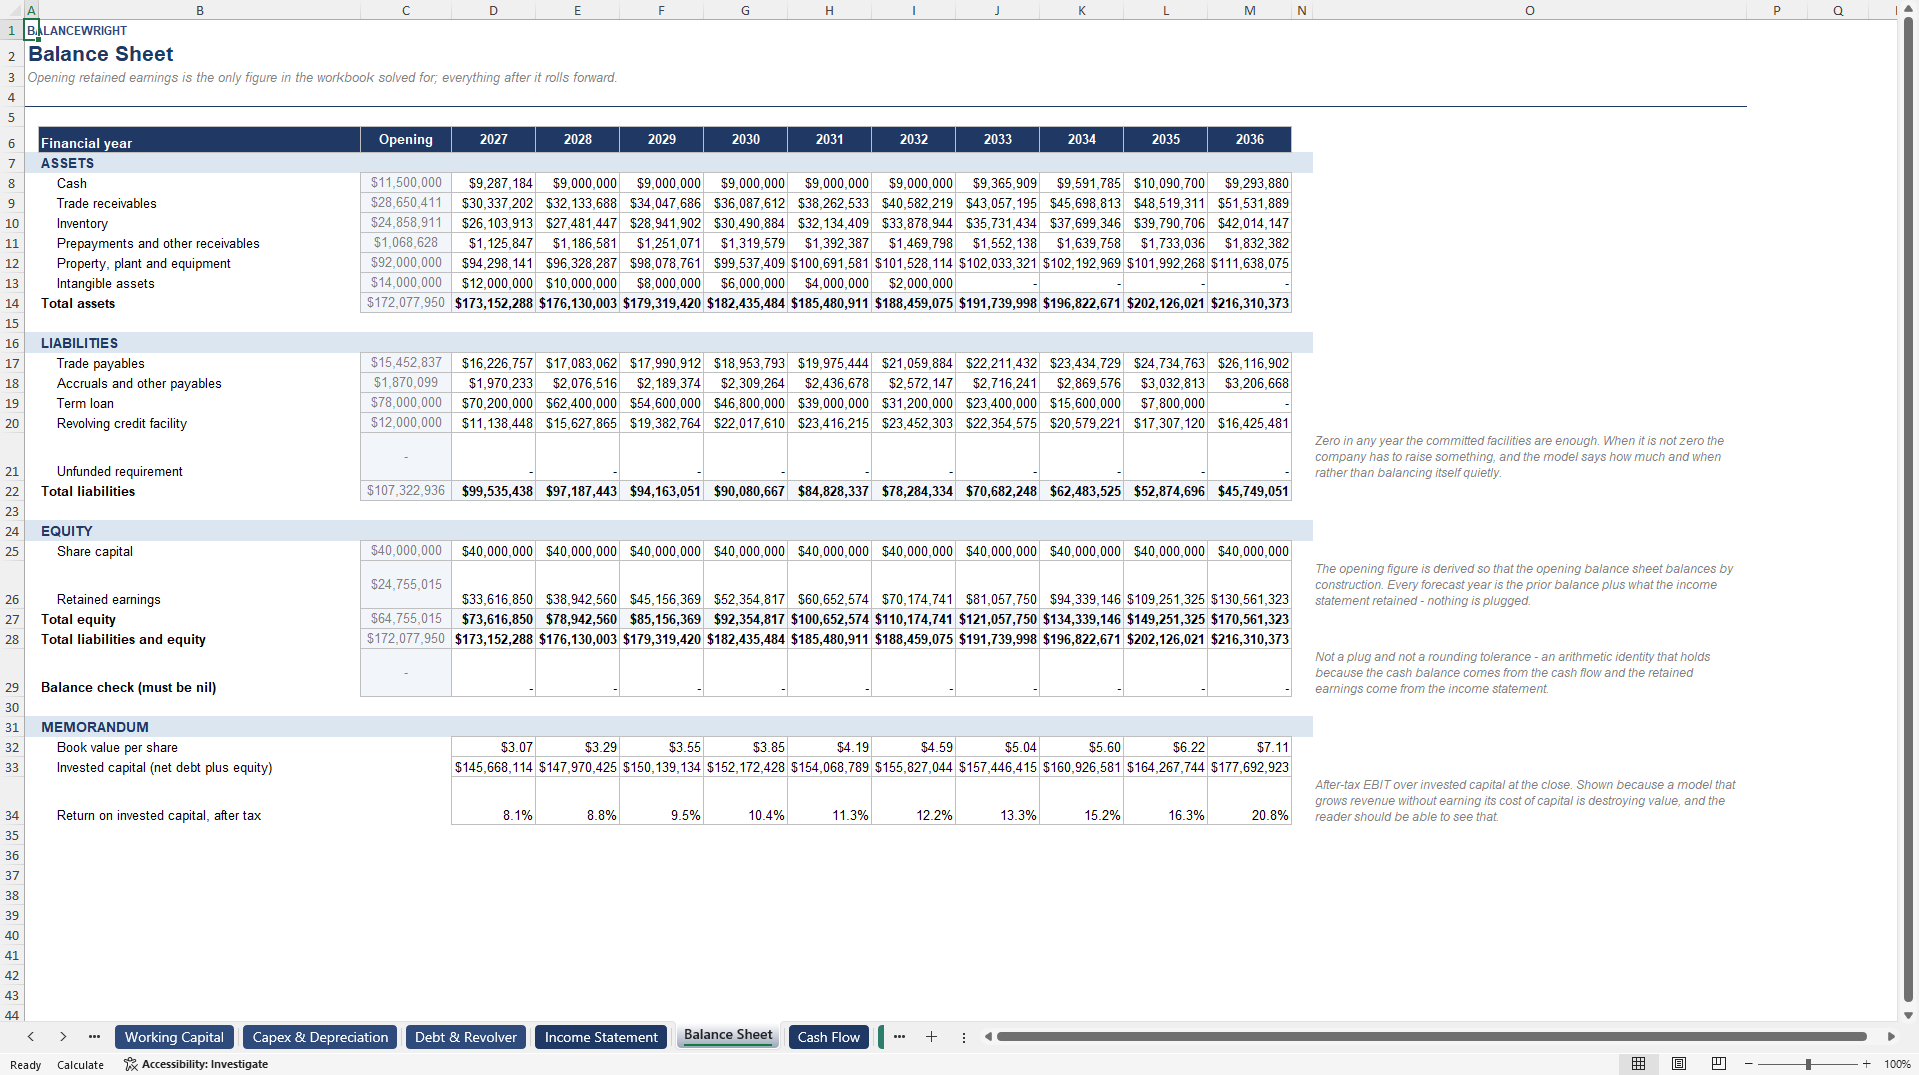
Those all feed a full income statement, a balance sheet that balances as an identity rather than a plug, and an indirect cash flow statement that closes on the same cash balance the balance sheet carries.
THE FUNDING GAP
When the revolver is exhausted and cash would still fall below the minimum balance, this model does not let cash go negative and does not borrow more than the facility allows. It reports the shortfall as a funding gap, names the first year it opens, carries it on the balance sheet as an unfunded requirement so the statements still balance, and fails a check. That is the number a finance director takes to the bank, and it is the number a template that plugs the balance sheet will never show. Switch the scenario to Downside and watch it happen: in the worked example the revolver reaches its limit in year eight and the gap opens.
COVENANTS REPORTED AS HEADROOM
Four tests – net leverage, interest cover, debt service cover and fixed charge cover – each reported three ways: the ratio, the headroom in the units the covenant is written in, and the headroom in dollars of EBITDA. The last of those is the one that gets used in a meeting, because "we can lose a million of EBITDA before we breach" is a sentence a management team can act on and "we are at 1.32x against a 1.25x test" is not. The binding test is named in every year, so you can see at a glance which covenant you are actually running the company against.
A VALUATION THAT CROSS-CHECKS ITSELF
Unlevered free cash flow discounted at the weighted average cost of capital with an optional mid-year convention, and the terminal value computed twice – once as a growing perpetuity and once at an exit multiple of final-year EBITDA. The two are then turned against each other. The perpetuity terminal value is divided by final-year EBITDA to give the exit multiple it implies. The exit-multiple terminal value is solved back for the growth rate that would make a perpetuity worth the same, and tested against a sanity band you set. That second calculation is the one almost nobody does, and it is the one that catches a terminal value nobody would defend out loud.
The bridge from enterprise value to equity value is explicit, including the value of the tax losses carried forward – deliberately excluded from the unlevered cash flow because they belong to the current owner and not to the enterprise. A football field then sets all four methods side by side, so the honest answer, a range, is what the reader sees before anybody picks a point estimate inside it.
SENSITIVITIES THAT DO NOT GO STALE
Two twenty-five cell grids – cost of capital against terminal growth, and cost of capital against the exit multiple – and a table showing how far EBITDA can fall in its tightest year before each covenant bites. None of it is an Excel data table: every cell is an ordinary formula computed from the same cash flows the Valuation tab uses, so nothing has to be refreshed and nothing goes stale. One of the checks tests that the centre cell of the first grid equals the Valuation tab's own answer, because a sensitivity grid that disagrees with the model beside it is worse than no grid at all.
TWENTY-FOUR CHECKS
Each one measures a number that must be nil, or a condition that must hold, in every one of the ten years: the balance sheet balances, the cash flow statement ties to it, retained earnings roll forward by net income less dividends, the asset schedules roll forward by capital expenditure and depreciation, the term loan closes at exactly nil, the revolver never exceeds its commitment and never goes negative, cash never falls below the minimum balance, interest is a function of opening balances only, tax is never a credit, dividends never exceed the policy, the sensitivity grid agrees with the valuation, and the implied growth rate stays inside its band. All twenty-four pass in the worked example.
THE WORKED EXAMPLE
A specialty industrial group on 191 million dollars of revenue in forecast year one, carrying 78 million of term debt and a 35 million revolver at 3.12x opening net leverage, growing revenue at 6.1 per cent a year to 324 million with EBITDA margin expanding from 14.6 to 18.9 per cent. Tightest covenant headroom of 1.0 million in year one, on debt service cover. An equity value of 185 million, 7.69 dollars a share, against a football-field range of 119 to 230 million. Every figure is a live formula driven off the Assumptions tab.
WHAT IT IS NOT
It is not a consolidation – one entity, one currency, no minorities, no eliminations. It is not a merger or leveraged buyout model. There is no deferred tax: cash tax and the tax charge are the same number, which is the honest simplification at this size. Revenue is recognised as billed. And it is annual, so if you need a weekly view of liquidity a thirteen-week direct cash flow is the right tool and this is not it.
FORMAT
One Excel workbook (.xlsx). Fourteen tabs. No macros, no add-ins, no external links, no password protection, no locked cells, and iterative calculation off because the file does not need it. Opens in Excel 2016 and later, Microsoft 365, LibreOffice Calc, Apple Numbers and Google Sheets. A separate illustrated guide is included, covering how the financing block resolves, what each tab does and what to change first.
Building this from scratch takes a competent financial modeller two to four days.
Got a question about the product? Email us at support@flevy.com or ask the author directly by using the "Ask the Author a Question" form. If you cannot view the preview above this document description, go here to view the large preview instead.
Source: Best Practices in Valuation, Integrated Financial Model Excel: Three Statement Financial Model: Revolver, Covenants, DCF Excel (XLSX) Spreadsheet, Balancewright
ABOUT THE AUTHOR

Balancewright builds working financial models for subscription and recurring-revenue businesses -- cohort retention, revenue movement, unit economics, cash flow and scenario forecasting.
Every model is formula-driven end to end. No locked cells, no passwords, no macros and no external links, so any calculation can be inspected, adapted and audited. Each file ships with a visible
... [read more]
Ask the Author a Question
You must be logged in to contact the author.




























