
Fixed-Base Operator (FBO) – 10 Year Financial Model – Excel XLSX
Excel (XLSX)
BENEFITS OF THIS DOWNLOADABLE EXCEL DOCUMENT
- Provides a structured framework for building a 10-year financial forecast for Fixed-Base Operator (FBO) businesses driven by real aviation operating metrics.
- Enables aviation operators and investors to model fuel sales, hangar revenue, aircraft operations, and cash flow in a fully integrated 3-statement financial model.
- Delivers an institutional-grade financial planning system for evaluating FBO profitability, capital investment, and long-term growth.
AIRLINE INDUSTRY EXCEL DESCRIPTION
Curated by McKinsey-trained Executives
✈ FBO Advanced 3-Statement Financial Model (10-Year Forecast)
The Complete Financial Planning & Forecasting System for Fixed-Base Operators, Aviation Businesses, and FBO Investors 📊
The FBO Advanced Financial Model is a fully integrated 10-year financial forecasting Excel workbook built specifically for Fixed-Base Operators. Every revenue line, every cost, and every cash flow projection is driven by real FBO operating assumptions – not generic growth percentages.
If your business fuels aircraft, leases hangars, services planes, and handles passengers – this is the only FBO financial model you will ever need.
✅ 12 fully structured Excel worksheets
✅ Fully integrated 3-statement financial model
✅ Operationally driven from aircraft operations and fuel metrics
✅ Color-coded institutional formatting throughout
✅ Built for FBO owners, CFOs, analysts, and aviation investors
✅ Ready to present to lenders, equity partners, and strategic buyers
📊 Why This FBO Financial Model Is Different
Generic financial templates use revenue growth percentages. They have no idea what a transient arrival is, what fuel uplift means, or how hangar occupancy drives cash flow.
This model is different.
Every single output – revenue, gross profit, EBITDA, cash balance – is calculated from real FBO operational drivers: based aircraft count, transient arrivals, fuel uplift per operation, Jet-A and Avgas pricing, hangar occupancy rates, tie-down utilization, MRO labor hours, ground handling fees, and concierge revenue per operation.
Change one assumption. Watch the entire 10-year model update instantly.
That is how a real FBO financial model works.
✈ Aircraft Operations Model – The Engine Behind Everything
The foundation of every FBO business is flight operations. This model starts exactly there.
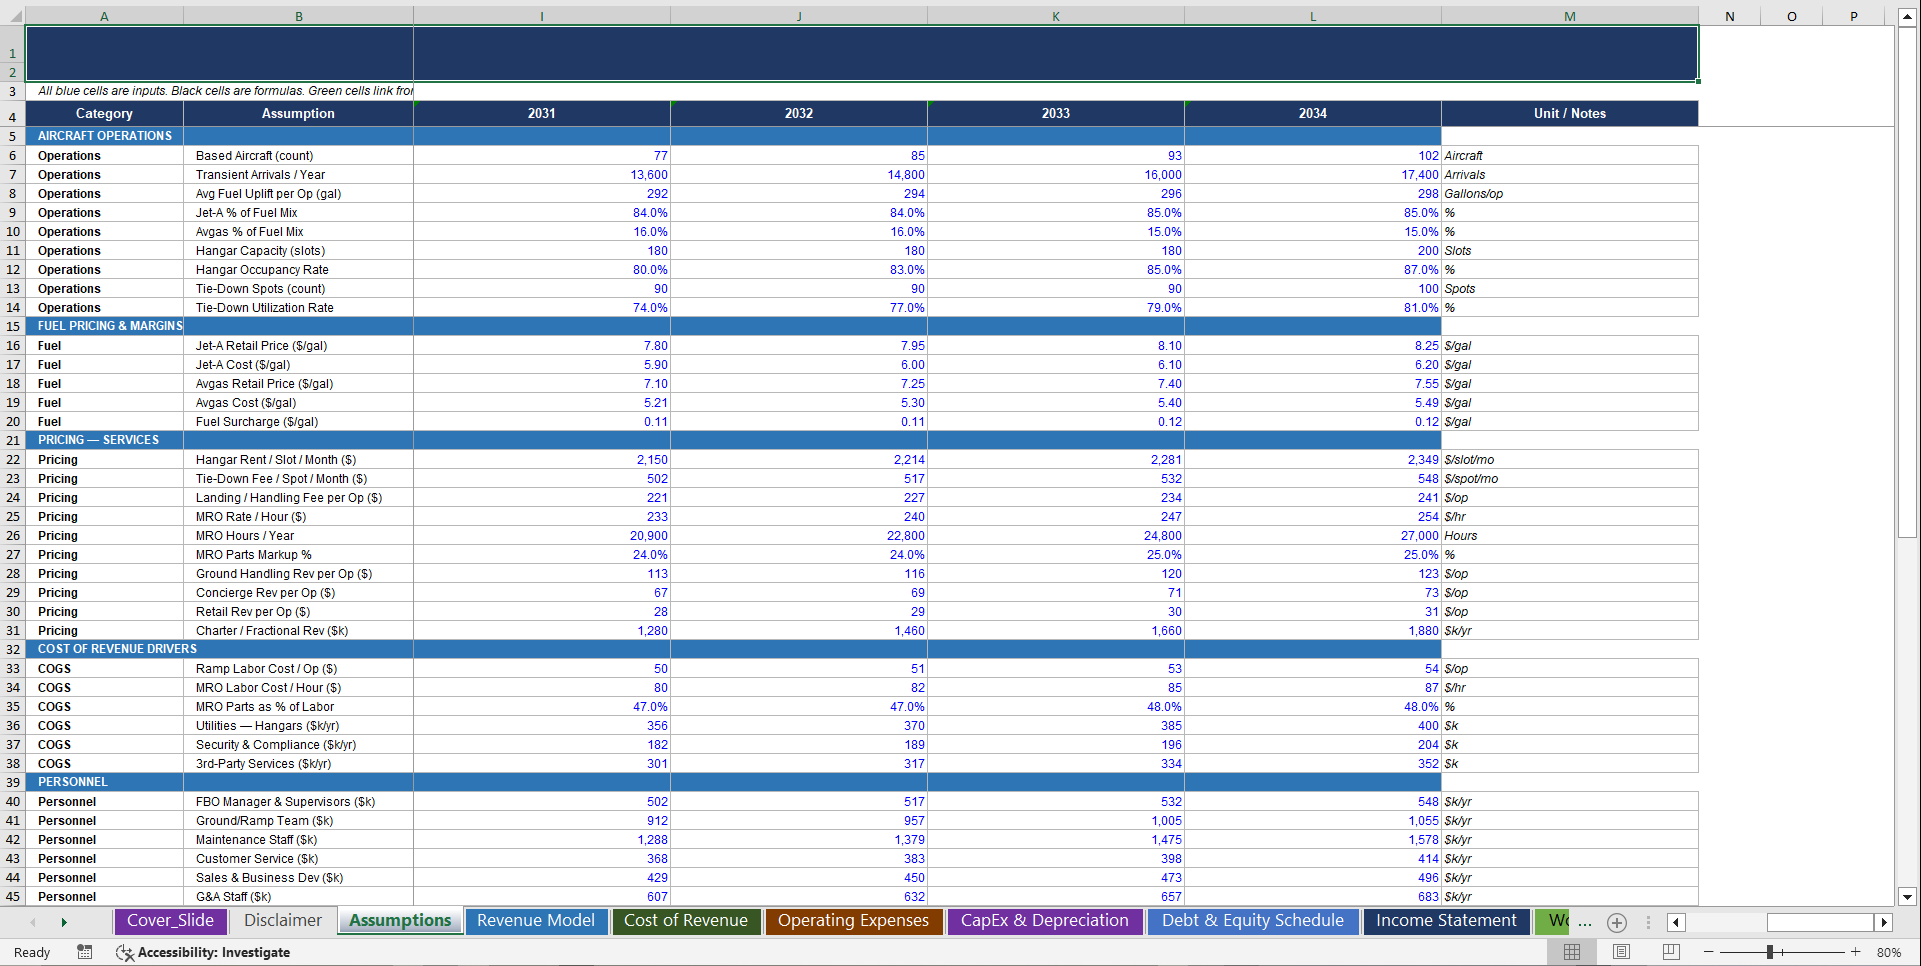
The Assumptions sheet is the core operational engine that drives every revenue line, every COGS calculation, and every working capital movement across the full 10-year forecast.
Model and track across all 10 years:
• based aircraft count – growing from 42 to 102 aircraft
• transient arrivals per year – scaling from 8,200 to 17,400
• average fuel uplift per operation (gallons)
• Jet-A percentage and Avgas percentage of fuel mix
• hangar capacity (slots) and hangar occupancy rate
• tie-down spots and tie-down utilization rate
From these inputs, the model automatically calculates total fuel volumes, revenue by service line, COGS, and working capital – then feeds everything directly into the income statement, cash flow, and balance sheet.
No disconnected spreadsheets. No manual overrides. One integrated FBO model.
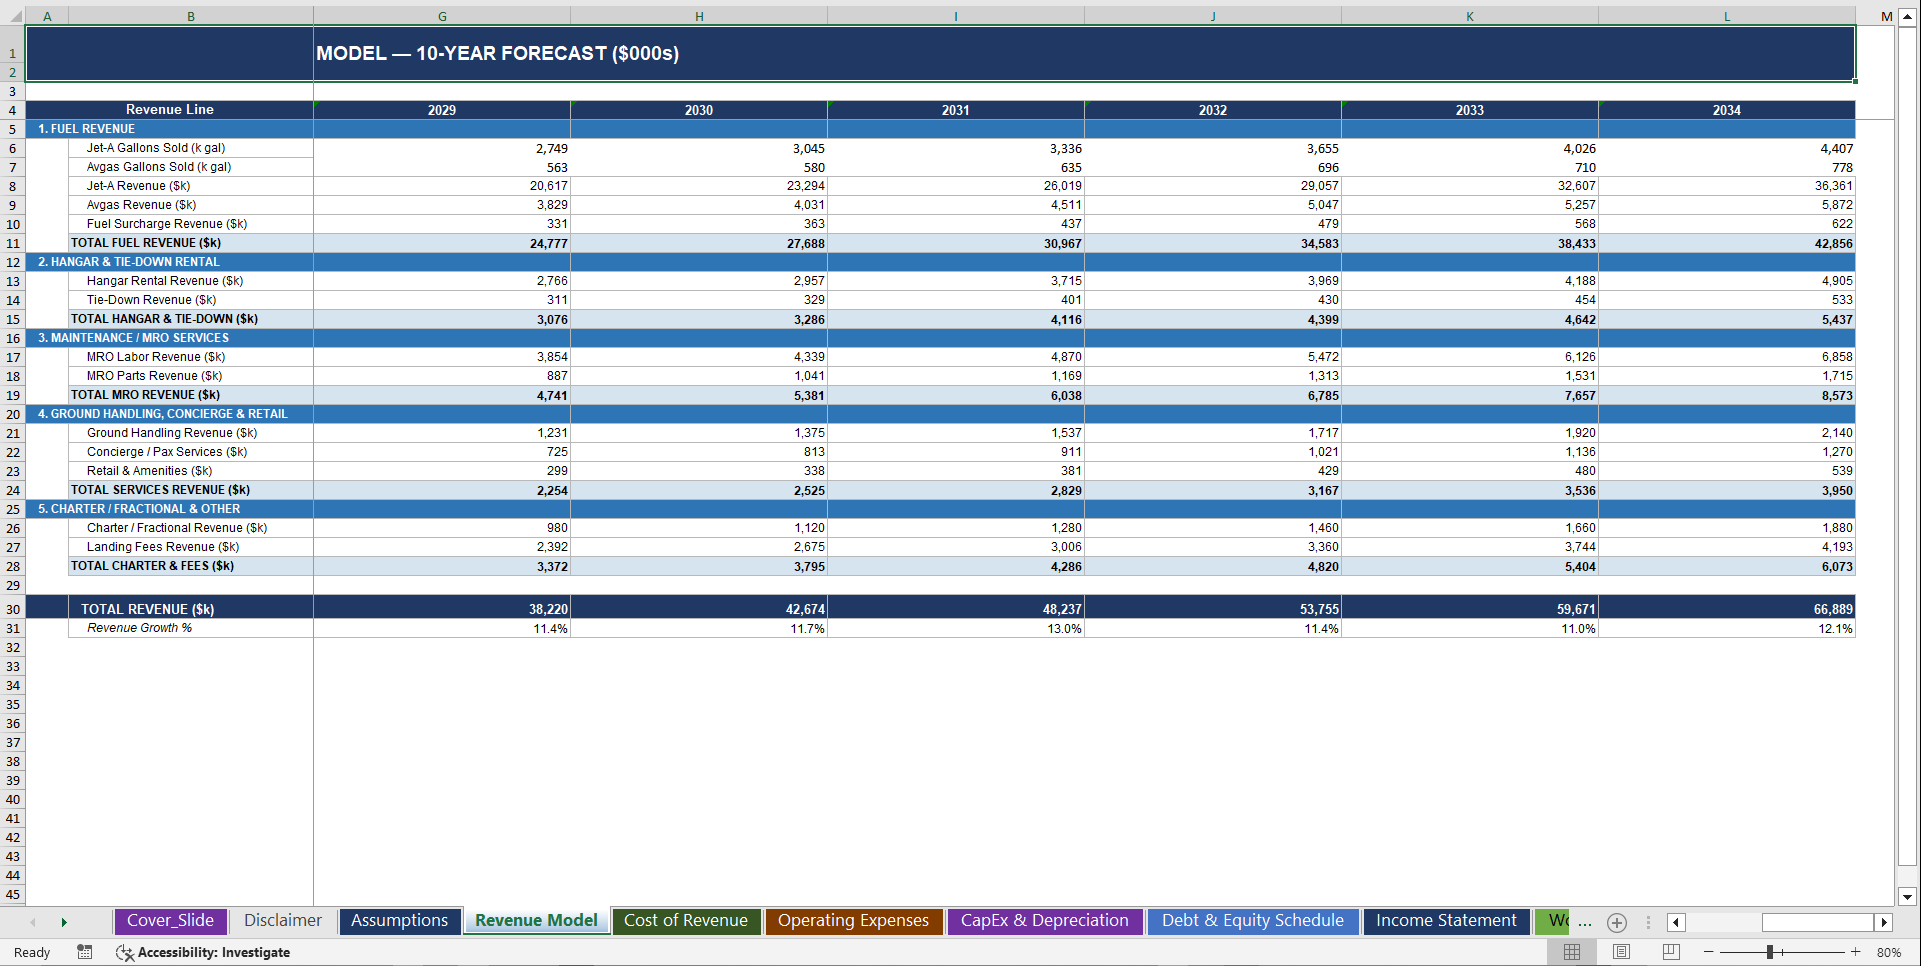
💰 Revenue Model – Five Service Lines, Fully Driven by Operations
FBO revenue is not a single line item. This model breaks it into every stream your operation actually generates.
1. Fuel Revenue
• Jet-A gallons sold – calculated from transient arrivals × fuel uplift × Jet-A mix %
• Avgas gallons sold – calculated from transient arrivals × fuel uplift × Avgas mix %
• Jet-A revenue – gallons × retail price per gallon
• Avgas revenue – gallons × retail price per gallon
• Fuel surcharge revenue – total gallons × surcharge rate
• Total Fuel Revenue
2. Hangar & Tie-Down Rental
• Hangar rental revenue – capacity × occupancy × monthly rate × 12
• Tie-down revenue – spots × utilization × monthly fee × 12
• Total Hangar & Tie-Down Revenue
3. Maintenance / MRO Services
• MRO labor revenue – MRO hours × hourly rate
• MRO parts revenue – labor revenue × parts markup %
• Total MRO Revenue
4. Ground Handling, Concierge & Retail
• Ground handling revenue – transient arrivals × fee per operation
• Concierge / passenger services – transient arrivals × concierge rate per operation
• Retail & amenities – transient arrivals × retail revenue per operation
• Total Services Revenue
5. Charter, Fractional & Landing Fees
• Charter / fractional revenue
• Landing fees revenue – transient arrivals × landing fee per operation
• Total Charter & Fees Revenue
Grand Total Revenue – calculated automatically across all 10 years with year-on-year growth %.
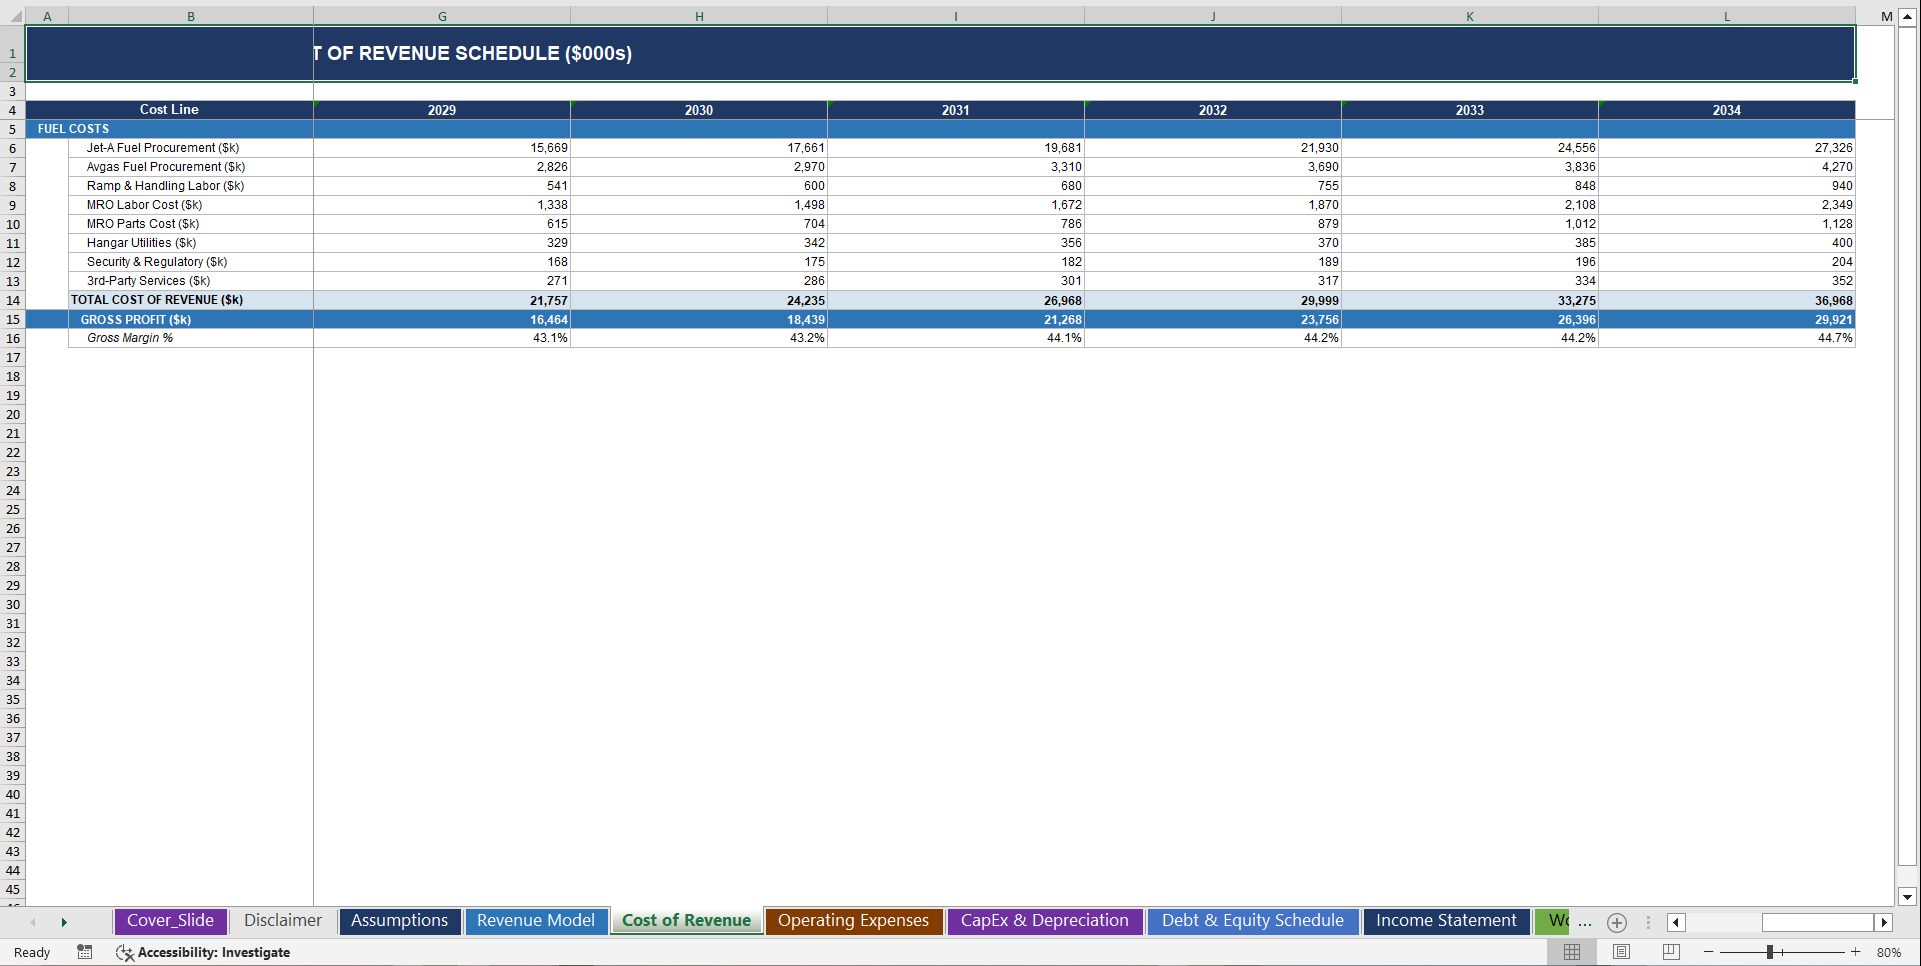
📉 Cost of Revenue – Eight Operational Cost Lines, Fully Linked
Gross margin is the critical number in any FBO business. This model gives you complete visibility into every cost component.
COGS is built from per-operation and per-unit cost assumptions – no rough percentage estimates:
• Jet-A fuel procurement – gallons sold × cost per gallon
• Avgas fuel procurement – gallons sold × cost per gallon
• Ramp & handling labor – transient arrivals × ramp labor cost per operation
• MRO labor cost – MRO hours × labor cost per hour
• MRO parts cost – MRO labor cost × parts as % of labor
• Hangar utilities
• Security & regulatory compliance
• 3rd-party services
The sheet calculates Total Cost of Revenue, Gross Profit, and Gross Margin % – all updated dynamically.
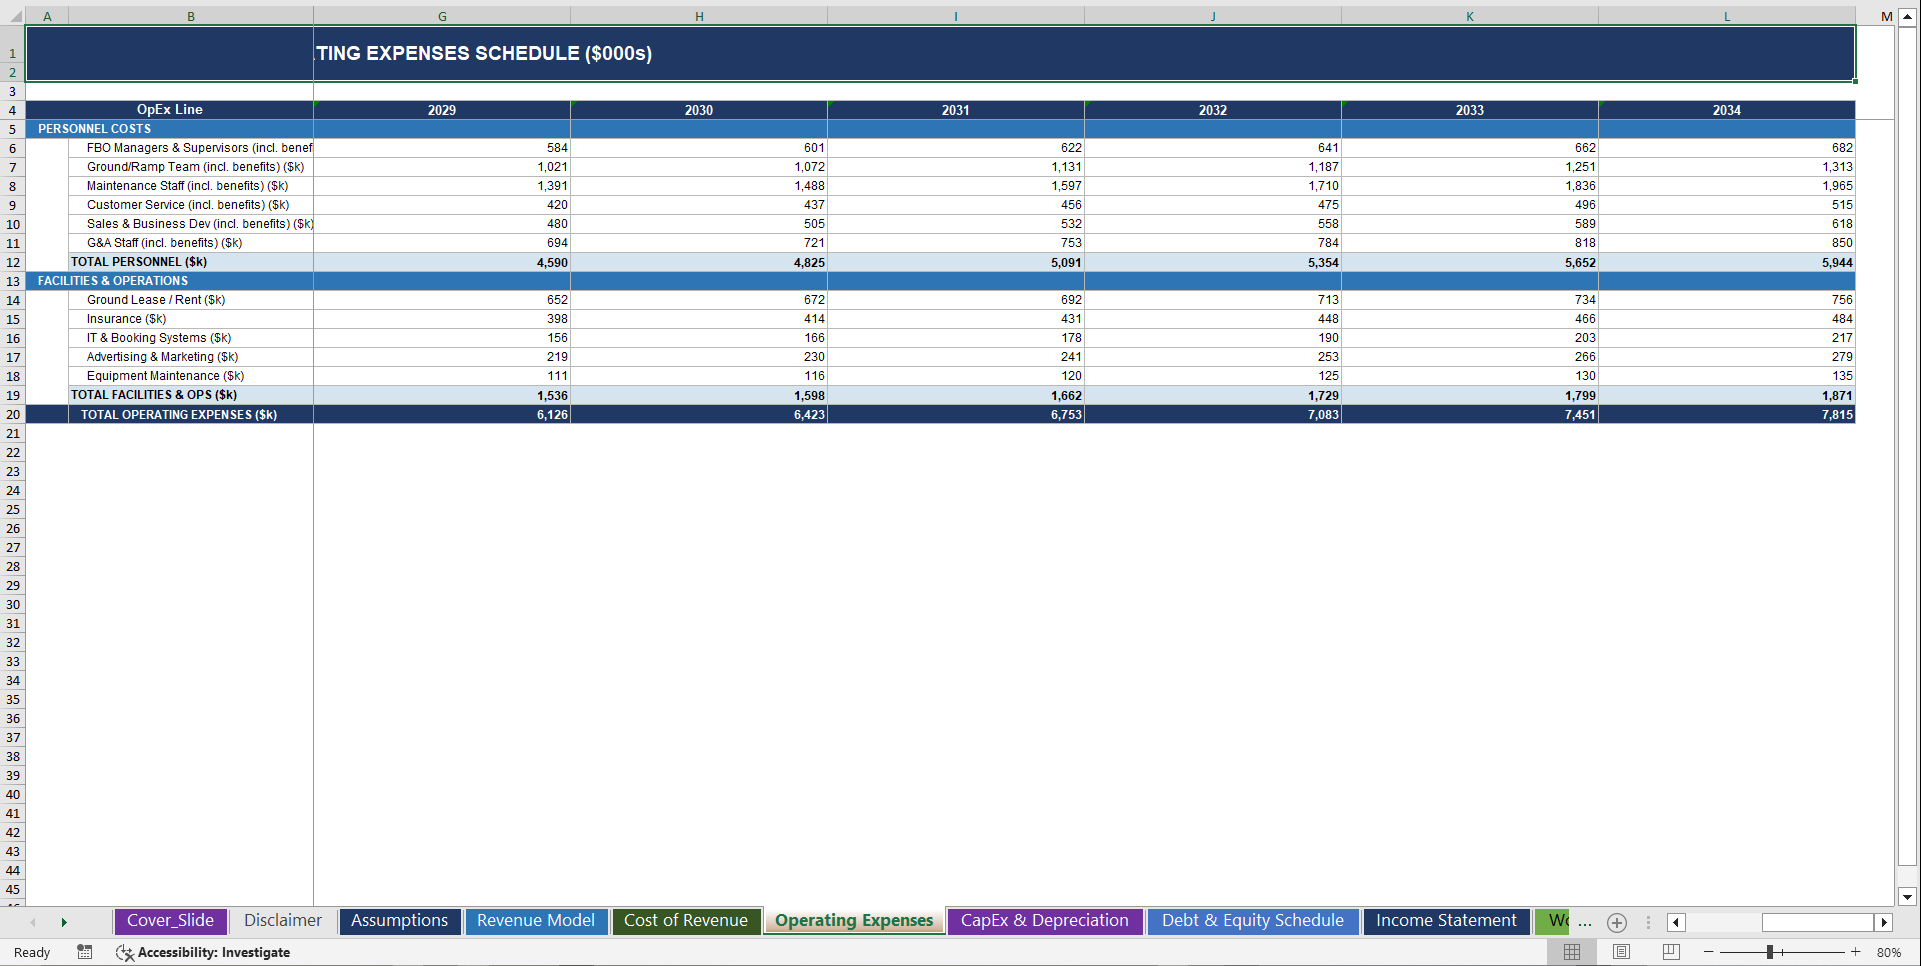
🧾 Operating Expenses – Personnel and Facilities, Modeled by Department
Personnel Costs – six roles, each including benefits and payroll tax multiplier:
• FBO Managers & Supervisors
• Ground / Ramp Team
• Maintenance Staff
• Customer Service
• Sales & Business Development
• G&A Staff
Facilities & Operations:
• Ground Lease / Rent
• Insurance
• IT & Booking Systems
• Advertising & Marketing
• Equipment Maintenance
The sheet calculates Total Personnel, Total Facilities & Ops, and Total Operating Expenses across all 10 years.
🏗 CapEx & Depreciation Schedule – Built for Capital-Intensive Aviation Infrastructure
Capital expenditure categories modeled across 10 years:
• Hangar Construction / Expansion
• Fuel Infrastructure
• Ground Support Equipment
• Maintenance Tools & Facilities
• Security & IT Systems
The sheet includes a full PP&E roll-forward:
• Total CapEx per year
• Cumulative Gross Assets
• Annual Depreciation
• Cumulative Depreciation
• Net PP&E (book value)
Depreciation flows automatically into the Income Statement, Cash Flow Statement, and Balance Sheet. Every capital investment tracked, depreciated, and reconciled.
💼 Working Capital Schedule – FBO-Specific Cash Flow Dynamics
Working capital line items modeled across 10 years:
Current Assets
• Accounts Receivable – driven by AR Days assumption
• Fuel Inventory – driven by Fuel Inventory Days applied to fuel procurement cost
• Prepaid Expenses
Current Liabilities
• Accounts Payable – driven by AP Days assumption
• Accrued Expenses – one month of personnel cost accrual
• Deferred Revenue – driven by Deferred Revenue Days
Calculated outputs:
• Total Current Assets
• Total Current Liabilities
• Net Working Capital
• Change in Net Working Capital – flowing directly into the Cash Flow Statement
💳 Debt & Equity Schedule – Complete Financing Structure
Debt Schedule:
• Opening Debt Balance roll-forward
• New Debt Drawdowns per year
• Principal Repayments per year
• Interest Expense on average debt balance
• Closing Debt Balance
Equity Schedule:
• Opening Paid-In Capital
• Equity Raises by year
• Closing Paid-In Capital
Model your entire financing structure across 10 years – from opening debt balances through equity raises and full debt repayment.
💵 Fully Integrated 3-Statement Financial Model
This is not a standalone income statement. This is not a cash flow calculator. Every assumption feeds every output – automatically.
Change transient arrivals – fuel revenue updates. Fuel revenue updates – COGS updates. COGS updates – gross profit updates. Gross profit flows into EBITDA. EBITDA flows into net income. Net income flows into retained earnings. Retained earnings flows into the balance sheet. The balance sheet balances. Cash reconciles.
Every single time. Automatically.
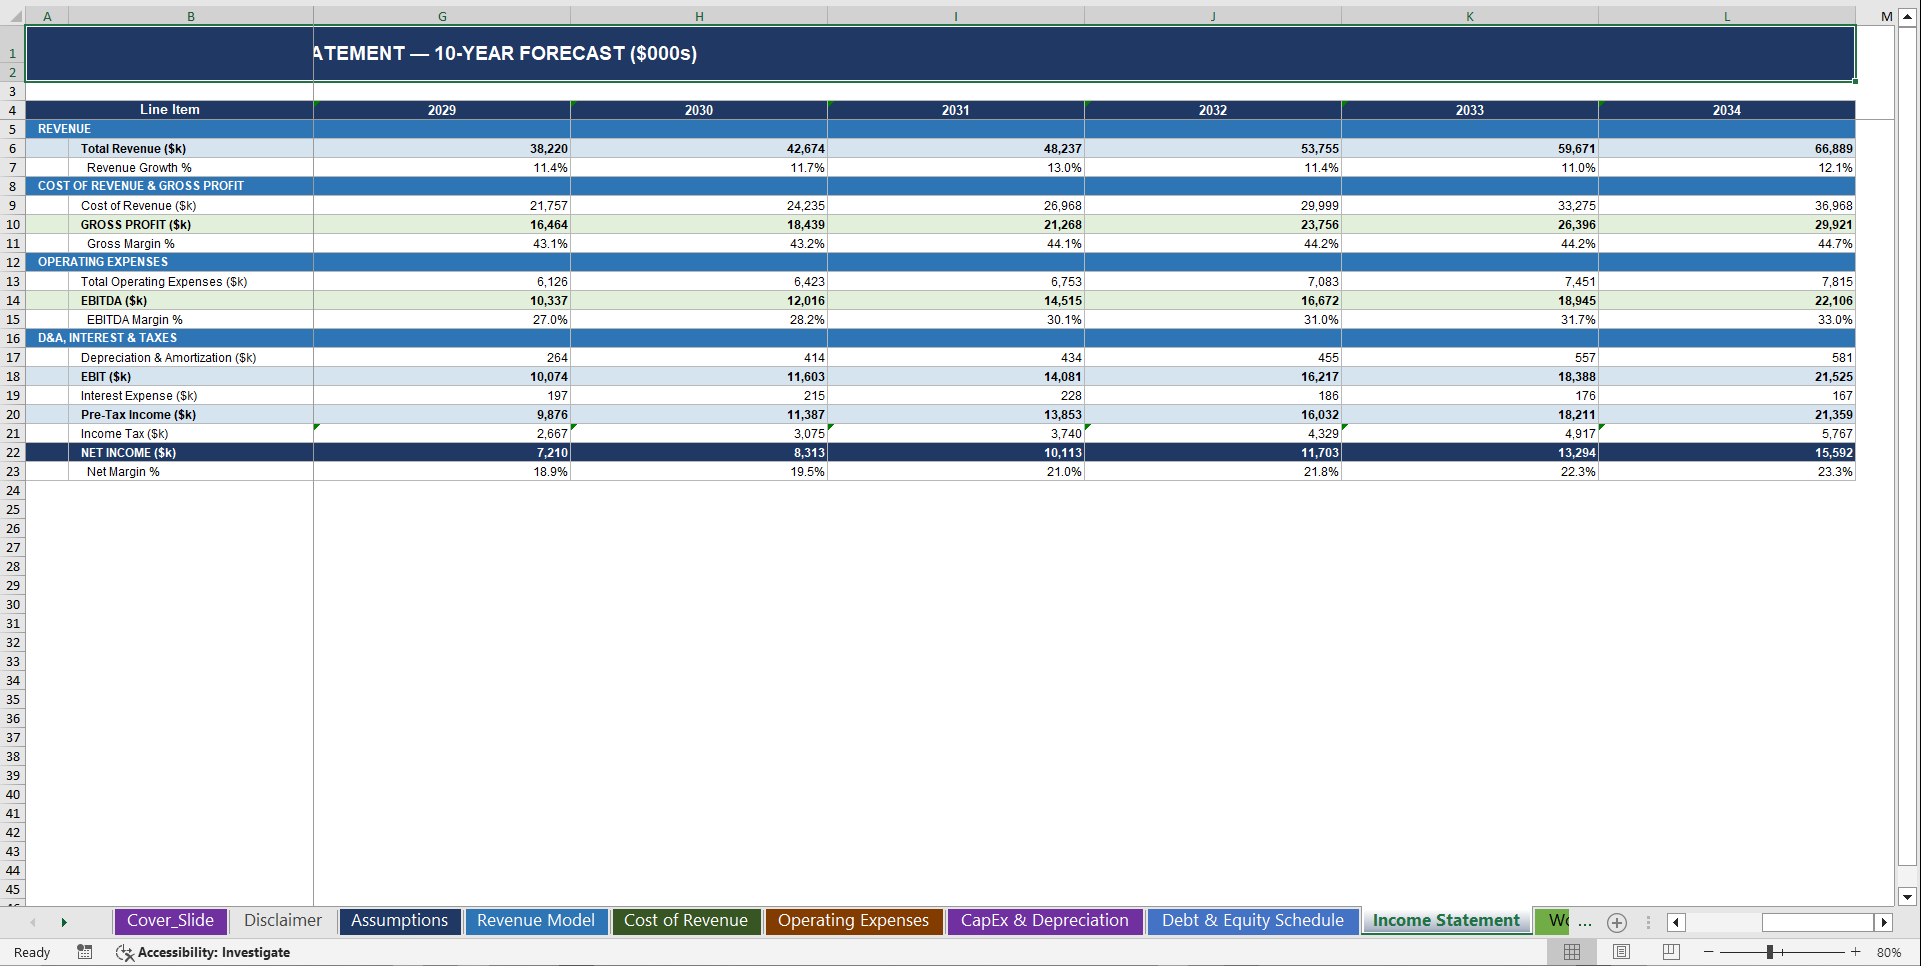
📑 Income Statement – 10-Year FBO P&L
• Total Revenue
• Revenue Growth %
• Cost of Revenue
• Gross Profit & Gross Margin %
• Total Operating Expenses
• EBITDA & EBITDA Margin %
• Depreciation & Amortization
• EBIT
• Interest Expense
• Pre-Tax Income
• Income Tax
• Net Income & Net Margin %
💰 Cash Flow Statement – Indirect Method, Fully Linked
Operating Activities
Net Income → Add: Depreciation & Amortization → Change in Working Capital → Cash from Operations
Investing Activities
Capital Expenditures → Cash from Investing
Financing Activities
New Debt Proceeds → Debt Repayments → Equity Raises → Cash from Financing
Cash Position
Net Change in Cash → Opening Cash Balance → Closing Cash Balance – linked directly to the Balance Sheet
🧾 Balance Sheet – Fully Reconciled Across Every Year
Assets
• Cash & Equivalents (linked from Cash Flow Statement)
• Accounts Receivable
• Fuel Inventory
• Prepaid Expenses
• Total Current Assets
• Net PP&E
• Lease Deposits
• Total Non-Current Assets
• Total Assets
Liabilities
• Accounts Payable
• Accrued Expenses
• Deferred Revenue
• Current Portion of Debt
• Total Current Liabilities
• Long-Term Debt
• Total Non-Current Liabilities
• Total Liabilities
Shareholders' Equity
• Paid-In Capital
• Opening Retained Earnings
• Net Income
• Retained Earnings
• Total Equity
• Total Liabilities & Equity
Live Balance Check row included – flags immediately if assets do not equal liabilities plus equity. Across every year of the forecast.
📊 Sensitivity Analysis – Stress Test Your FBO Model
Base Case Outputs – linked live from the model:
• Base Case Revenue
• Base Case EBITDA
• Base Case Net Income
• Base Case Cash Balance
Fuel Price Sensitivity – Year 5 EBITDA Impact:
Tests EBITDA across a range of Jet-A retail price scenarios from −1.00 to +1.00 per gallon versus the base case – showing the direct EBITDA impact of fuel price movements at Year 5 operating scale.
Metrics tested across all five scenarios: Total Revenue, EBITDA, Net Income, EBITDA Margin %, and Cash Balance.
Know your downside before your lender or investor asks about it.
📈 Executive Dashboard – Investor-Ready in One Sheet
9 KPI boxes – Year 5 and Year 10 metrics:
• Y10 Revenue
• Y10 EBITDA
• Y10 Net Income
• Y10 EBITDA Margin %
• Y10 Cash Balance
• Y5 Gross Margin %
• Y10 Based Aircraft
• Y10 Fuel Gallons Sold (k)
• Y5 Net Margin %
6 fully working dynamic charts – all linked live to the model:
1. Total Revenue – 10-Year Forecast (bar chart)
2. EBITDA & Net Income – 10-Year Trend (line chart)
3. Revenue Mix by Service Line – Fuel, Hangar & Tie-Down, MRO, Services (stacked bar chart)
4. Cash Balance – Runway (line chart)
5. Margin Trends – Gross Margin % & EBITDA Margin % (line chart)
6. Operations Volume – Transient Arrivals & Based Aircraft (bar chart)
All charts update automatically when any assumption changes.
⚙️ Clean, Professional Assumption Structure – Everything in One Place
All model inputs centralized in the Assumptions sheet, organized into seven sections:
1. Aircraft Operations – based aircraft, transient arrivals, fuel uplift, Jet-A/Avgas mix, hangar capacity and occupancy, tie-down spots and utilization
2. Fuel Pricing & Margins – Jet-A and Avgas retail prices, procurement costs, fuel surcharge rate
3. Pricing – Services – hangar rent per slot, tie-down fee per spot, landing/handling fee, MRO rate and hours, ground handling, concierge, retail, and charter revenue rates
4. Cost of Revenue Drivers – ramp labor cost, MRO labor cost, parts ratio, utilities, security, 3rd-party services
5. Personnel – salary budgets by department with benefits and payroll tax multiplier
6. OpEx – Facilities & Other – ground lease, insurance, IT, marketing, equipment maintenance
7. CapEx Schedule – five asset categories with blended depreciation life
8. Financing & Tax – opening debt, drawdowns, repayments, interest rate, tax rate, opening cash, opening equity, equity raises
9. Working Capital – AR Days, AP Days, Fuel Inventory Days, Deferred Revenue Days
One change. Entire model updates.
🎯 Who This FBO Financial Model Is Built For
✔ FBO owners and operators building investor-ready financial projections
✔ Aviation startup founders modeling fuel economics and hangar scale-up
✔ Airport authority finance teams evaluating FBO concession economics
✔ FBO acquisition targets preparing for investor or buyer due diligence
✔ Aviation CFOs and financial analysts building institutional-grade FBO models
✔ Private equity and infrastructure investors evaluating FBO platform investments
✔ Lenders and aircraft finance teams assessing FBO loan serviceability
✔ Aviation consultants and investment bankers advising on FBO transactions
✔ Pilots and aircraft owners evaluating FBO business plans
If your business fuels aircraft, leases hangar space, services planes, and generates revenue from flight operations – this model was built for you.
🚀 The Complete FBO Financial Forecasting System
The FBO Advanced Financial Model connects:
✈ Aircraft operations – based aircraft and transient arrivals
⛽ Fuel revenue – Jet-A, Avgas, and surcharge income
🏗 Hangar and tie-down rental income
🔧 MRO labor and parts revenue
🛎 Ground handling, concierge, and retail services
👥 Personnel costs across six departments
🏭 Capital expenditure and PP&E depreciation
💼 Working capital and cash conversion
💳 Debt and equity financing structures
…into a single integrated 10-year financial forecasting system that updates automatically when any assumption changes.
Everything flows into:
📊 Clear, institutional-grade financial projections
📈 Operational KPIs and aviation performance metrics
💰 Fully integrated Income Statement, Cash Flow Statement, and Balance Sheet
This is the FBO financial model serious aviation operators and investors actually use.
Key Words:
Strategy & Transformation, Growth Strategy, Strategic Planning, Strategy Frameworks, Innovation Management, Pricing Strategy, Core Competencies, Strategy Development, Business Transformation, Marketing Plan Development, Product Strategy, Breakout Strategy, Competitive Advantage, Mission, Vision, Values, Strategy Deployment & Execution, Innovation, Vision Statement, Core Competencies Analysis, Corporate Strategy, Product Launch Strategy, BMI, Blue Ocean Strategy, Breakthrough Strategy, Business Model Innovation, Business Strategy Example, Corporate Transformation, Critical Success Factors, Customer Segmentation, Customer Value Proposition, Distinctive Capabilities, Enterprise Performance Management, KPI, Key Performance Indicators, Market Analysis, Market Entry Example, Market Entry Plan, Market Intelligence, Market Research, Market Segmentation, Market Sizing, Marketing, Michael Porter's Value Chain, Organizational Transformation, Performance Management, Performance Measurement, Platform Strategy, Product Go-to-Market Strategy, Reorganization, Restructuring, SWOT, SWOT Analysis, Service 4.0, Service Strategy, Service Transformation, Strategic Analysis, Strategic Plan Example, Strategy Deployment, Strategy Execution, Strategy Frameworks Compilation, Strategy Methodologies, Strategy Report Example, Value Chain, Value Chain Analysis, Value Innovation, Value Proposition, Vision Statement, Corporate Strategy, Business Development, Business plan pdf, business plan, PDF, Business Plan DOC, Business Plan Template, PPT, Market strategy playbook, strategic market planning, competitive analysis tools, market segmentation frameworks, growth strategy templates, product positioning strategy, market execution toolkit, strategic alignment playbook, KPI and OKR frameworks, business growth strategy guide, cross-functional strategy templates, market risk management, market strategy PowerPoint doc, guide, ebook, e-book ,McKinsey Change Playbook, Organizational change management toolkit, Change management frameworks 2025, Influence model for change, Change leadership strategies, Behavioral change in organizations, Change management PowerPoint templates, Transformational leadership in change, supply chain KPIs, supply chain KPI toolkit, supply chain PowerPoint template, logistics KPIs, procurement KPIs, inventory management KPIs, supply chain performance metrics, manufacturing KPIs, supply chain dashboard, supply chain strategy KPIs, reverse logistics KPIs, sustainability KPIs in supply chain, financial supply chain KPIs, warehouse KPIs, digital supply chain KPIs, 1200 KPIs, supply chain scorecard, KPI examples, supply chain templates, Corporate Finance SOPs, Finance SOP Excel Template, CFO Toolkit, Finance Department Procedures, Financial Planning SOPs, Treasury SOPs, Accounts Payable SOPs, Accounts Receivable SOPs, General Ledger SOPs, Accounting Policies Template, Internal Controls SOPs, Finance Process Standardization, Finance Operating Procedures, Finance Department Excel Template, FP&A Process Documentation, Corporate Finance Template, Finance SOP Toolkit, CFO Process Templates, Accounting SOP Package, Tax Compliance SOPs, Financial Risk Management Procedures.
NOTE: Our digital products are sold on an "as is" basis, making returns and refunds unavailable post-download. Please preview and inquire before purchasing. Please contact us before purchasing if you have any questions! This policy aligns with the standard Flevy Terms of Usage.
Got a question about the product? Email us at support@flevy.com or ask the author directly by using the "Ask the Author a Question" form. If you cannot view the preview above this document description, go here to view the large preview instead.
Source: Best Practices in Airline Industry, Integrated Financial Model Excel: Fixed-Base Operator (FBO) – 10 Year Financial Model Excel (XLSX) Spreadsheet, SB Consulting
ABOUT THE AUTHOR
SB Consulting is dedicated to empowering businesses to communicate their ideas with impact. This consulting firm specializes in teaching organizations how to create effective corporate and management presentations. With training from top-tier global consulting firms, including McKinsey, BCG, and Porsche Consulting, extensive expertise in presentation design and ... [read more]
Ask the Author a Question
You must be logged in to contact the author.
