

Airline Financial Model (Aircraft Lease & Capex Option) – Excel XLSX
Excel (XLSX)
BENEFITS OF THIS DOWNLOADABLE EXCEL DOCUMENT
- Provides a complete 5-year financial forecasting framework for airlines operating a mix of leased and purchased aircraft, with sector-level revenue modeling.
- Delivers detailed visibility into aircraft utilization, ownership costs, operating expenses, and cash flows to support strategic planning and investment decisions.
- Offers investor-ready financial statements, validation checks, and KPIs that enable clear communication, reliable budgeting, and informed airline management.
CAPITAL BUDGETING EXCEL DESCRIPTION
This financial model is meticulously designed to analyze and forecast the financial performance of a commercial airline operating a mixed fleet of leased and purchased aircraft, providing detailed forecasts for different aircraft types deployed across different routes. It captures the full set of revenue and cost drivers unique to the aviation sector, including passenger revenue, ancillary income, and cargo operations. The model segments performance by aircraft type, route structure, ownership structure (leased vs. purchased), and seasonal demand patterns to deliver a granular and operationally realistic projection framework.
The model incorporates all critical operational parameters such as block hours, turnaround times, aircraft utilization, load factors, cargo tonne-kilometer metrics, fuel burn, and monthly fleet additions (both new purchases and new leases). Seasonal variations, fare and cargo price indices, ramp-up curves, and route-level distance and block-time structures are fully integrated to ensure realistic, data-driven airline financial forecasts.
Built over a 5-year horizon (60 months) with monthly and annual financial outputs, this financial model serves as a comprehensive tool for route profitability analysis, fleet planning, capital budgeting, investor communication, and financing assessments for airlines adopting a Lease + Purchase fleet strategy.
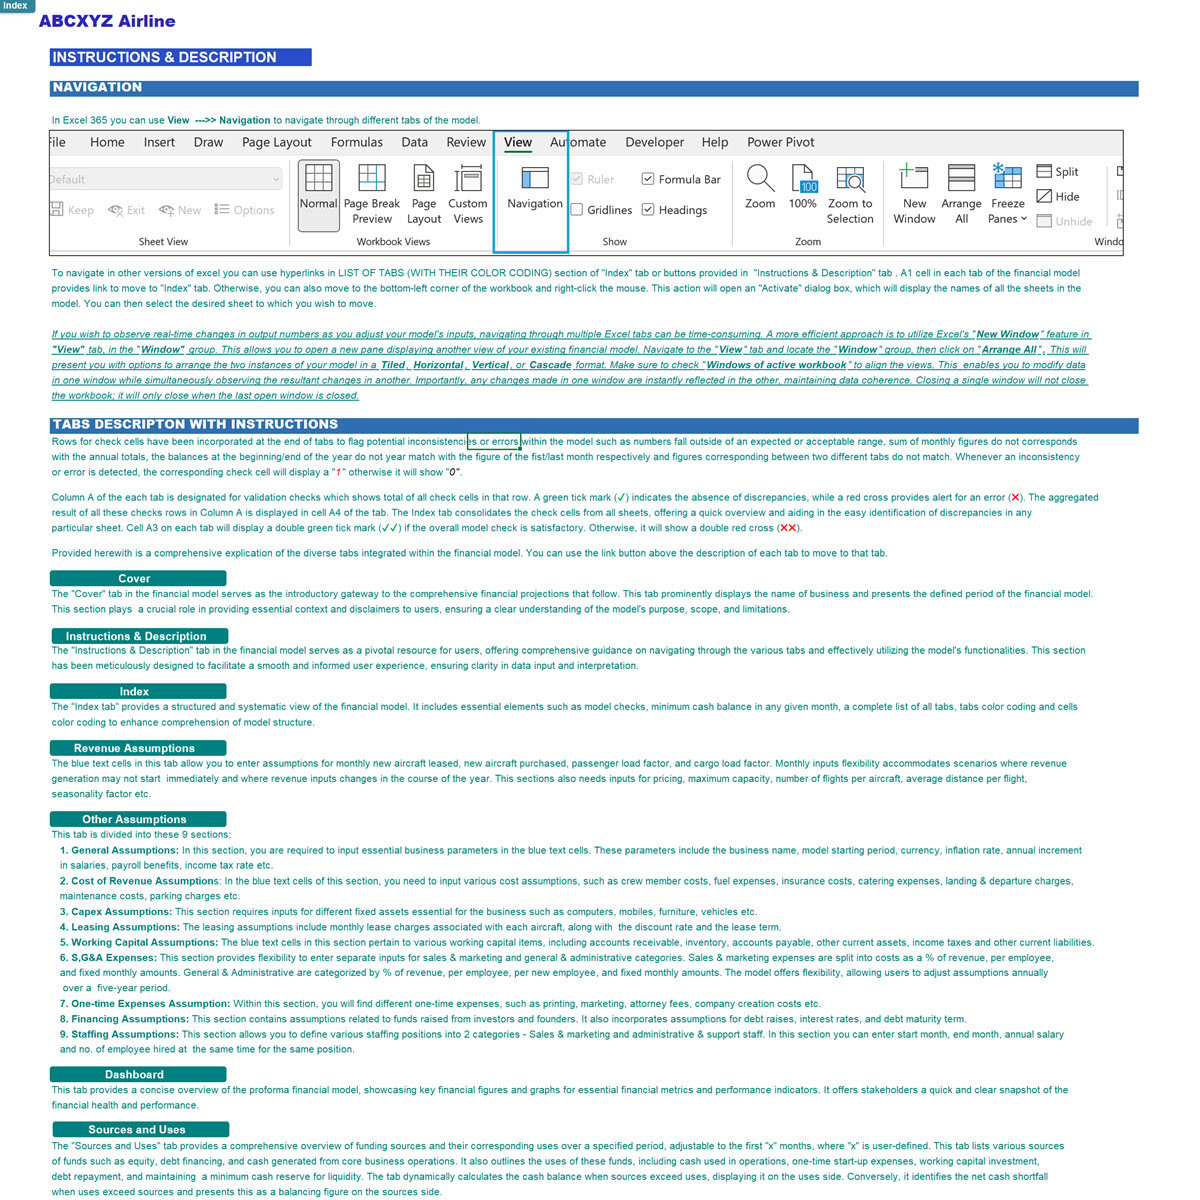
Model Structure – 5 Main Sections
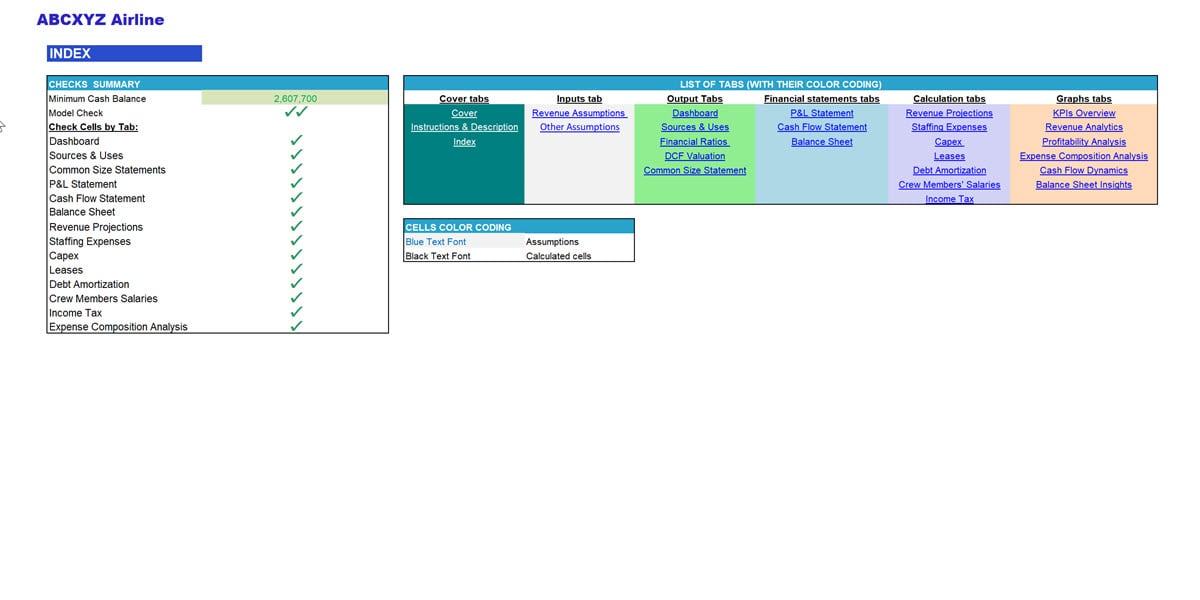
1. Cover Section
• Index of model tabs with tab-color mapping
• Summary of all checks and integrity indicators
• Color-coding legend for assumptions, links, formulas, and outputs
2. Input Section (Assumptions Tab)
All assumptions are consolidated into a clean, user-friendly tab. Inputs are placed in Light Gray Cells with Blue Text for clarity.
Key input areas include:
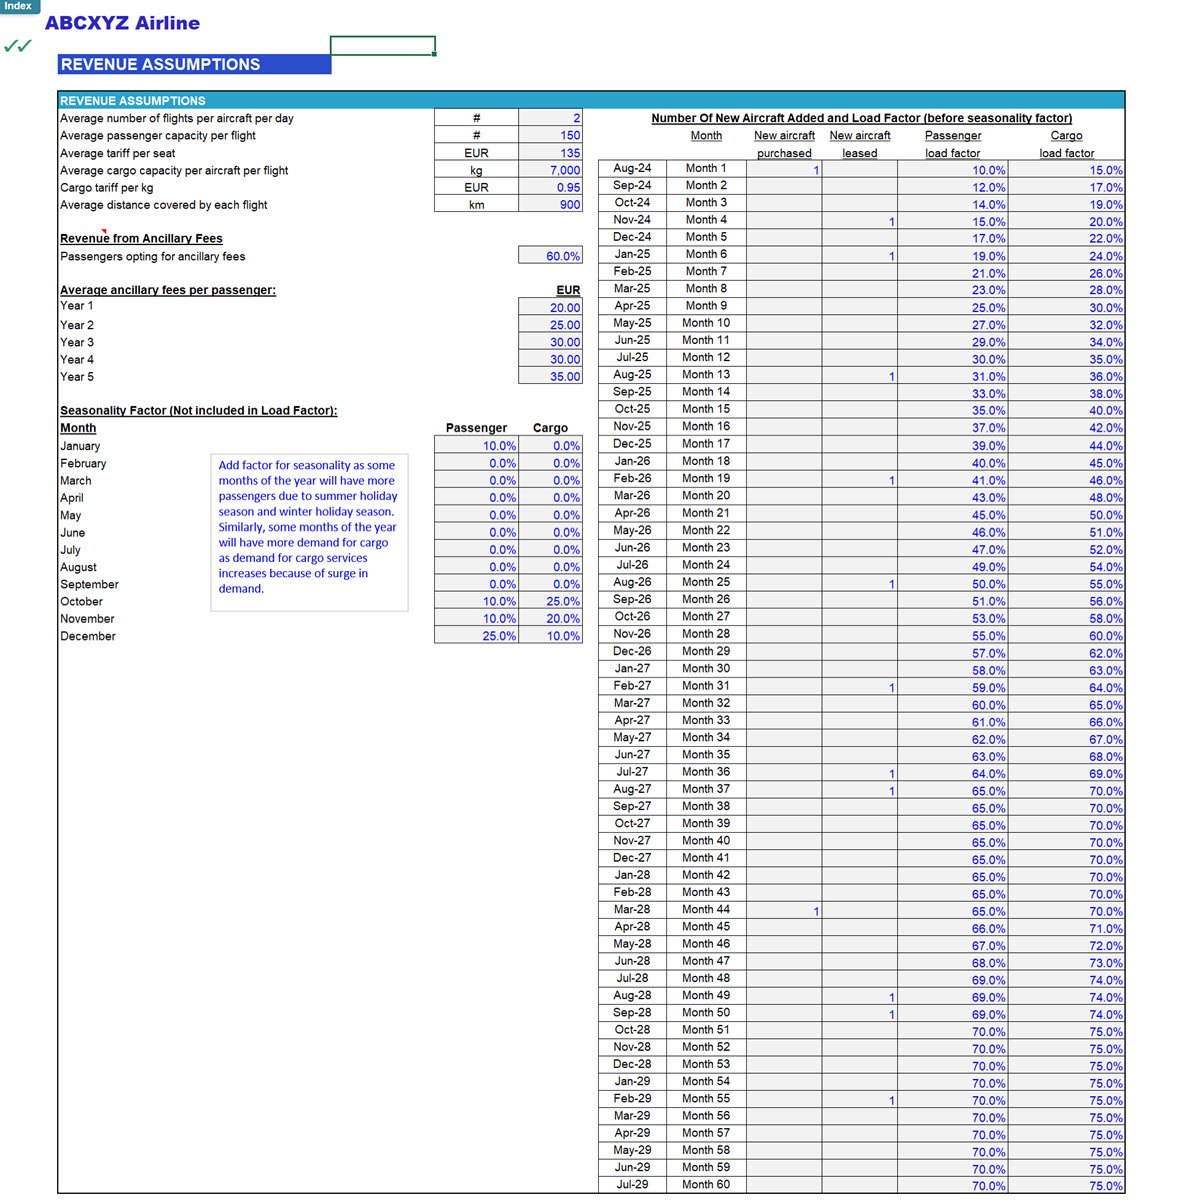
• Revenue Assumptions
• Passenger seat configuration by aircraft type (Economy & Business)
• Sector distances, block times, turnaround times
• Monthly load factor schedule + ramp-up curve
• Passenger base fares by route and class; yield per RPK
• Cargo capacity per aircraft (kg), cargo tariff per kg, yield per kg-km
• Seasonal price indices for passenger and cargo revenue
• Ancillary revenue
• Operational / Fleet Assumptions
• Fleet size by aircraft type with separate induction schedules for leased and purchased aircraft
• Serviceable hours per aircraft per day
• Allocation of utilized hours by route
• Fuel burn per block hour and ATF price assumptions
• Maintenance cycles and cost indexation
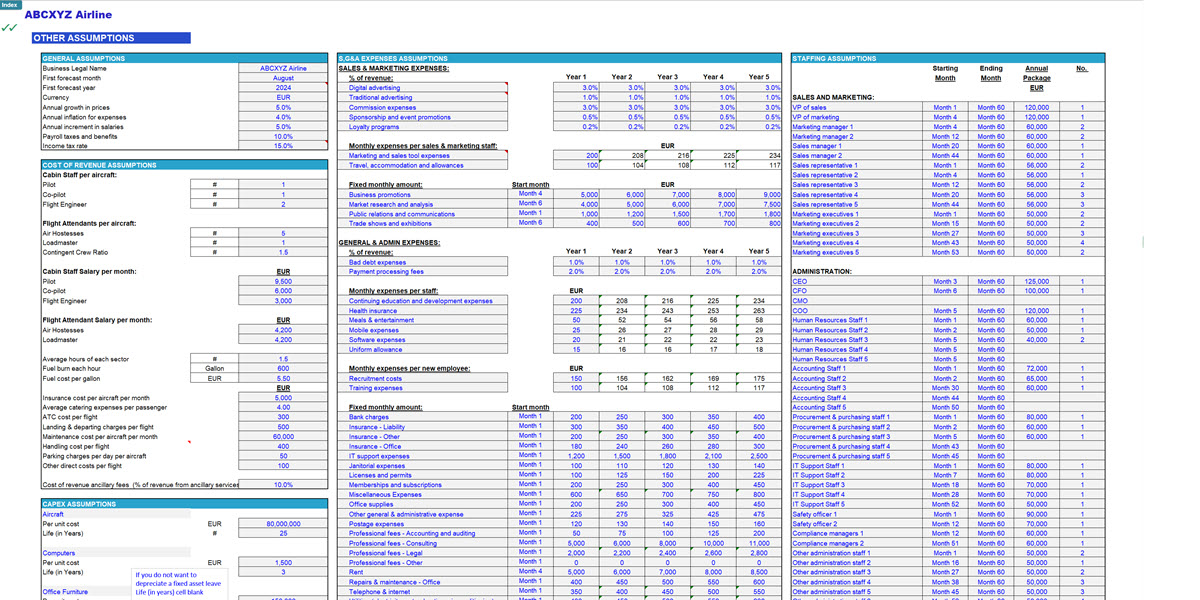
• General Assumptions
• Airline name, forecast start date, reporting currency
• Inflation rate, indexation factors, and corporate tax rate
• Cost of Revenue
• Fuel cost per block hour
• ATC, navigation, landing & departure fees
• Ground handling, dispatch, and station charges
• Catering and ancillary-related operating costs
• Direct Operating Expenses (DOE)
• Lease rentals for leased aircraft
• Crew salaries and benefits
• Aircraft maintenance
• Aircraft insurance
• Hangar & long-term parking charges
• S,G&A Expenses
• Administrative salaries
• Sales & distribution
• Utilities, IT systems, reservation platforms
• Marketing and overheads
• Working Capital
• Receivable and payable days
• Minimum cash balance requirements
• Financing & One-Time Costs
• Equity and debt funding for aircraft purchases
• Pre-operational costs: licensing, certification, branding, launch marketing
• Loan schedules for purchased aircraft
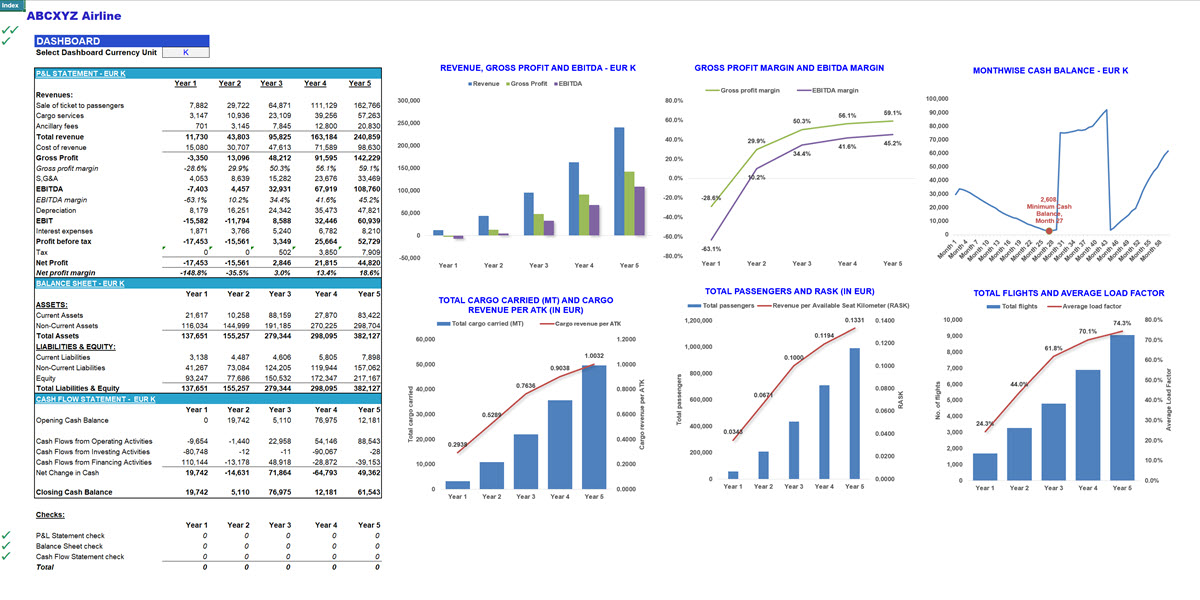
3. Output Tabs Section
• Dashboard with KPIs: revenue, margins, aircraft utilization, ASK/RPK/ATK/RTK, RASK/CASK
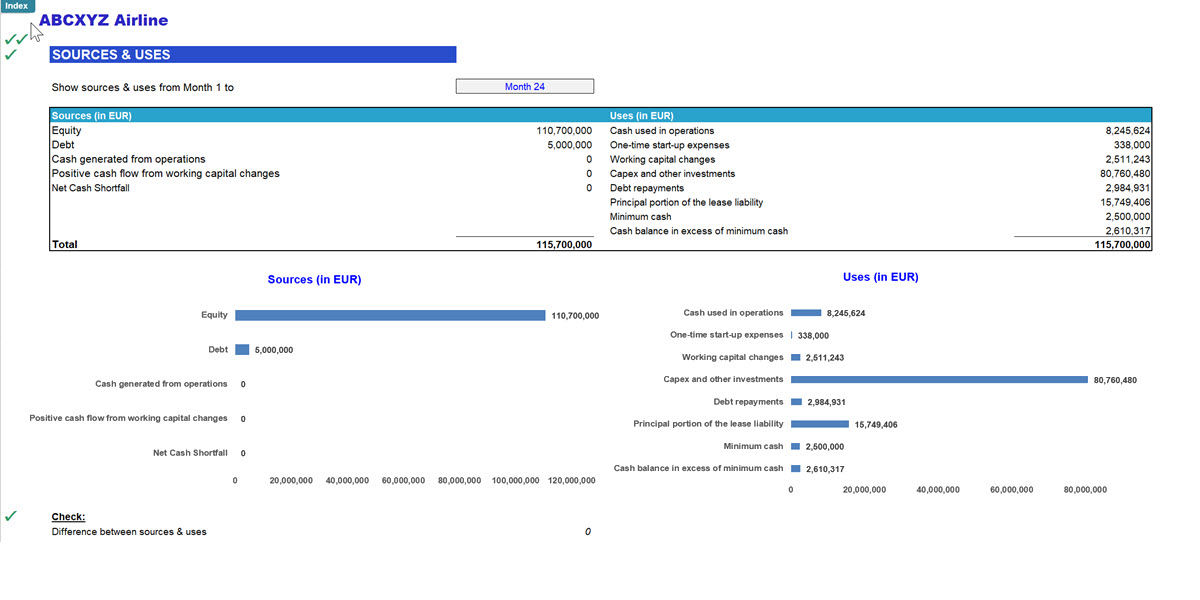
• Sources & Uses showing equity, debt, lease obligations, and aircraft purchase funding
• Valuation with DCF analysis and sensitivity scenarios
4. Financial Statements Section
• Profit & Loss Statement
• Cash Flow Statement
• Balance Sheet
5. Calculations Section
• Detailed build-up for passenger, cargo, and ancillary revenue
• Block-hour calculations and aircraft utilization
• Cost of revenue calculations (fuel, ATC, handling, catering)
• Direct operating costs (lease, depreciation, crew, maintenance, insurance)
• CapEx schedule for aircraft purchases
Technical Specifications
• No VBA / No Macros – fully transparent and editable
• Circular-reference free
• Compatible with Excel 2010 or later
Validation Checks
Built-in validation ensures model accuracy and completeness.
• Automated error flags in each tab
• Model-wide integrity dashboard with green ticks (✓) for correct inputs and red crosses (✗) for errors
Why Choose This Model?
This financial model is purpose-built for airlines using a hybrid fleet ownership strategy, combining leased and purchased aircraft. It provides a robust, flexible, and investor-ready framework for evaluating operational performance, capital structure, route profitability, and financing requirements. Ideal for airline startups, expanding carriers, aviation consultants, and financial analysts, the model delivers clarity, credibility, and actionable insights for strategic planning and investor communication.
For tailored customization, we can adapt the model to your specific fleet mix, acquisition strategy, network structure, and financial requirements.
Got a question about the product? Email us at support@flevy.com or ask the author directly by using the "Ask the Author a Question" form. If you cannot view the preview above this document description, go here to view the large preview instead.
TOPIC FAQ
What key performance metrics should an airline financial model forecast?
Airline financial models typically forecast passenger revenue, ancillary income, cargo revenue, ASK/RPK/ATK/RTK, load factors, RASK/CASK, aircraft utilization, block hours, fuel burn, and maintenance costs. These KPIs feed investor and operational dashboards such as RASK/CASK and aircraft utilization metrics.How do I model the financial impact of leasing versus purchasing aircraft?
Model leased and purchased aircraft on separate induction schedules, include lease rentals under direct operating expenses, and model purchase financing via debt schedules, depreciation, and capex. A complete model also shows effects on cash flow and balance sheet through lease rentals and loan schedules.What inputs are required to build route-level profitability forecasts?
Essential inputs include aircraft seat configuration by class, sector distances, block and turnaround times, monthly load-factor schedules and ramp-up, passenger fares by class or yield per RPK, cargo capacity and tariff, and route-level costs like fuel per block hour. These drive route-level profitability and block-hour calculations.How can seasonality and ramp-up be incorporated into airline forecasts?
Use monthly load-factor schedules, ramp-up curves for new routes or aircraft, and seasonal price indices for passenger and cargo revenue. Modeling these inputs at a monthly granularity enables realistic seasonal revenue and utilization patterns, anchored by monthly load factor schedules.What features should I prioritize when buying an airline financial model for investor presentations?
Prioritize transparent formulas (no hidden macros), a KPI dashboard, Sources & Uses, DCF valuation, full financial statements, and built-in validation checks to support diligence. Models that export P&L, Cash Flow, Balance Sheet, and DCF outputs are preferable for investor communication and valuation.How do I judge whether a pre-built airline model provides good value for my team?
Assess whether it supports your fleet mix and ownership strategy, offers route-level detail, includes financing and loan schedules, provides monthly outputs over a multi-year horizon, and has validation checks. A model covering mixed leased/purchased fleets with a 5-year (60-month) horizon indicates substantial coverage.What modeling approach suits a startup airline planning phased fleet additions?
Use monthly induction schedules for leased and purchased aircraft, ramp-up curves, block-hour and utilization modeling by route, and detailed pre-operational costs and funding plans. This approach connects fleet additions to cash flow and financing needs and supports monthly fleet additions planning.Which validation and audit features improve model reliability for airline finance teams?
Useful validation features include automated error flags in each tab, a model-wide integrity dashboard with green ticks and red crosses, color-coded assumption cells and links, circular-reference-free calculations, and transparent, non-macro formulas to facilitate auditing and review.Source: Best Practices in Capital Budgeting, Airline Industry, Integrated Financial Model Excel: Airline Financial Model (Aircraft Lease & Capex Option) Excel (XLSX) Spreadsheet, ExcelFinModels
ABOUT THE AUTHOR
I am a finance professional with over 15 years of experience in financial modeling, analysis, planning, budgeting, and forecasting on various freelancing platforms. I have assisted over 500 start-ups and SMBs across diverse industries in securing over $1 billion in funding, internal planning, financial reporting, and strategy formulation. Additionally, I have provided services to numerous ... [read more]
Ask the Author a Question
You must be logged in to contact the author.
