Finance KPI Excel Dashboard   Excel template (XLSX)
$49.00

Finance KPI Excel Dashboard (Excel template (XLSX)) Preview Image
Flevy is the marketplace for business best practices.
Finance KPI Excel Dashboard (Excel template (XLSX)) Preview Image
Arrow   Click main image to view in full screen.

Finance KPI Excel Dashboard (Excel XLSX)

Excel (XLSX)

#1 in Key Performance Indicators $49.00

Add to Cart


Immediate download
Fully editable Excel
Free lifetime updates

BENEFITS OF THIS EXCEL DOCUMENT

  1. Excel XLSX File

KEY PERFORMANCE INDICATORS EXCEL DESCRIPTION

This product (Finance KPI Excel Dashboard) is an Excel template (XLSX), which you can download immediately upon purchase.

Take control of your performance tracking with this clean, structured, and easy-to-use KPI template. Whether you're managing a team, a department, or an entire organization, this tool helps you keep your goals measurable, aligned, and on track—without complexity.
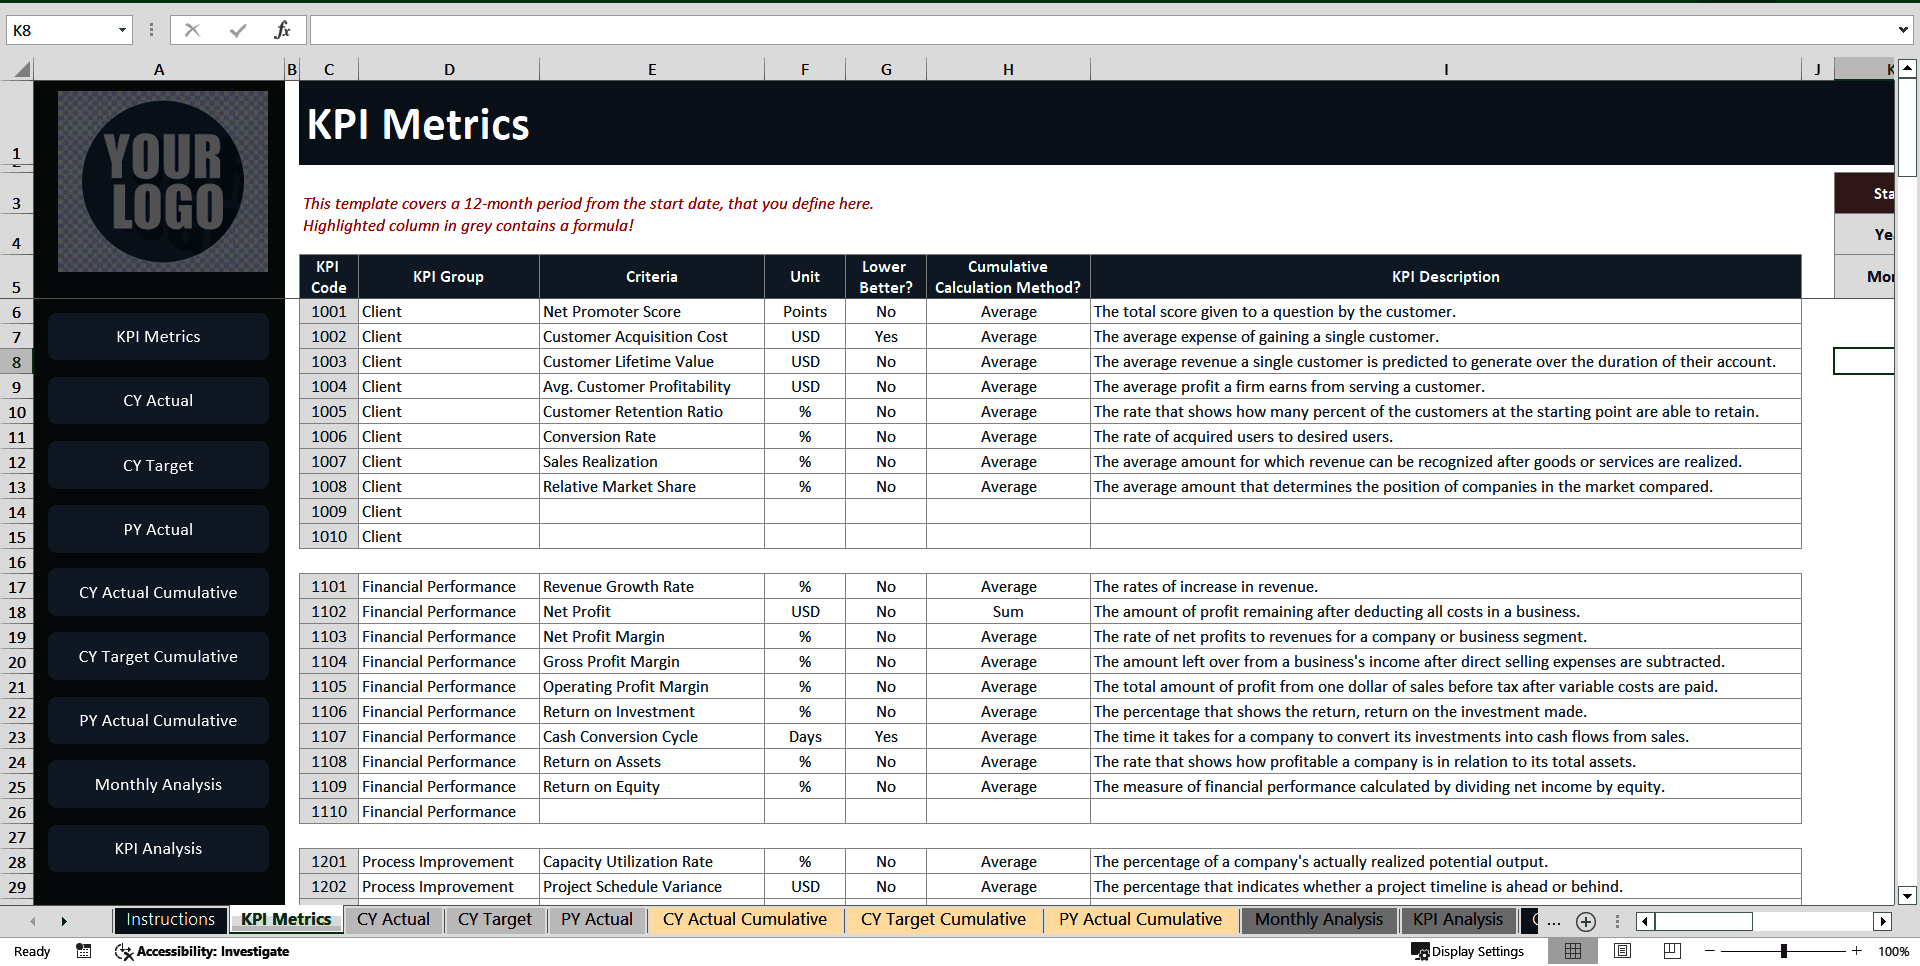
KPI METRICS SETUP
• KPI Code: Assign a distinct code to each KPI to keep things organized and traceable.
• KPI Group: Group KPIs by category or department using consistent naming conventions for better filtering and analysis.
• Criteria: Name the specific performance indicator you're tracking.
• Unit: Specify the measurement unit (e.g., %, hours, units) for clarity and consistency.
• Lower Better: Indicate if a lower number reflects better performance by choosing "Yes" or leave blank for the default.
• Cumulative Method (Sum or Average): Choose how you want your year-to-date totals calculated—ideal for distinguishing between numeric totals and ratios/percentages.
• KPI Description: Use this space to briefly explain the purpose or logic behind each KPI.

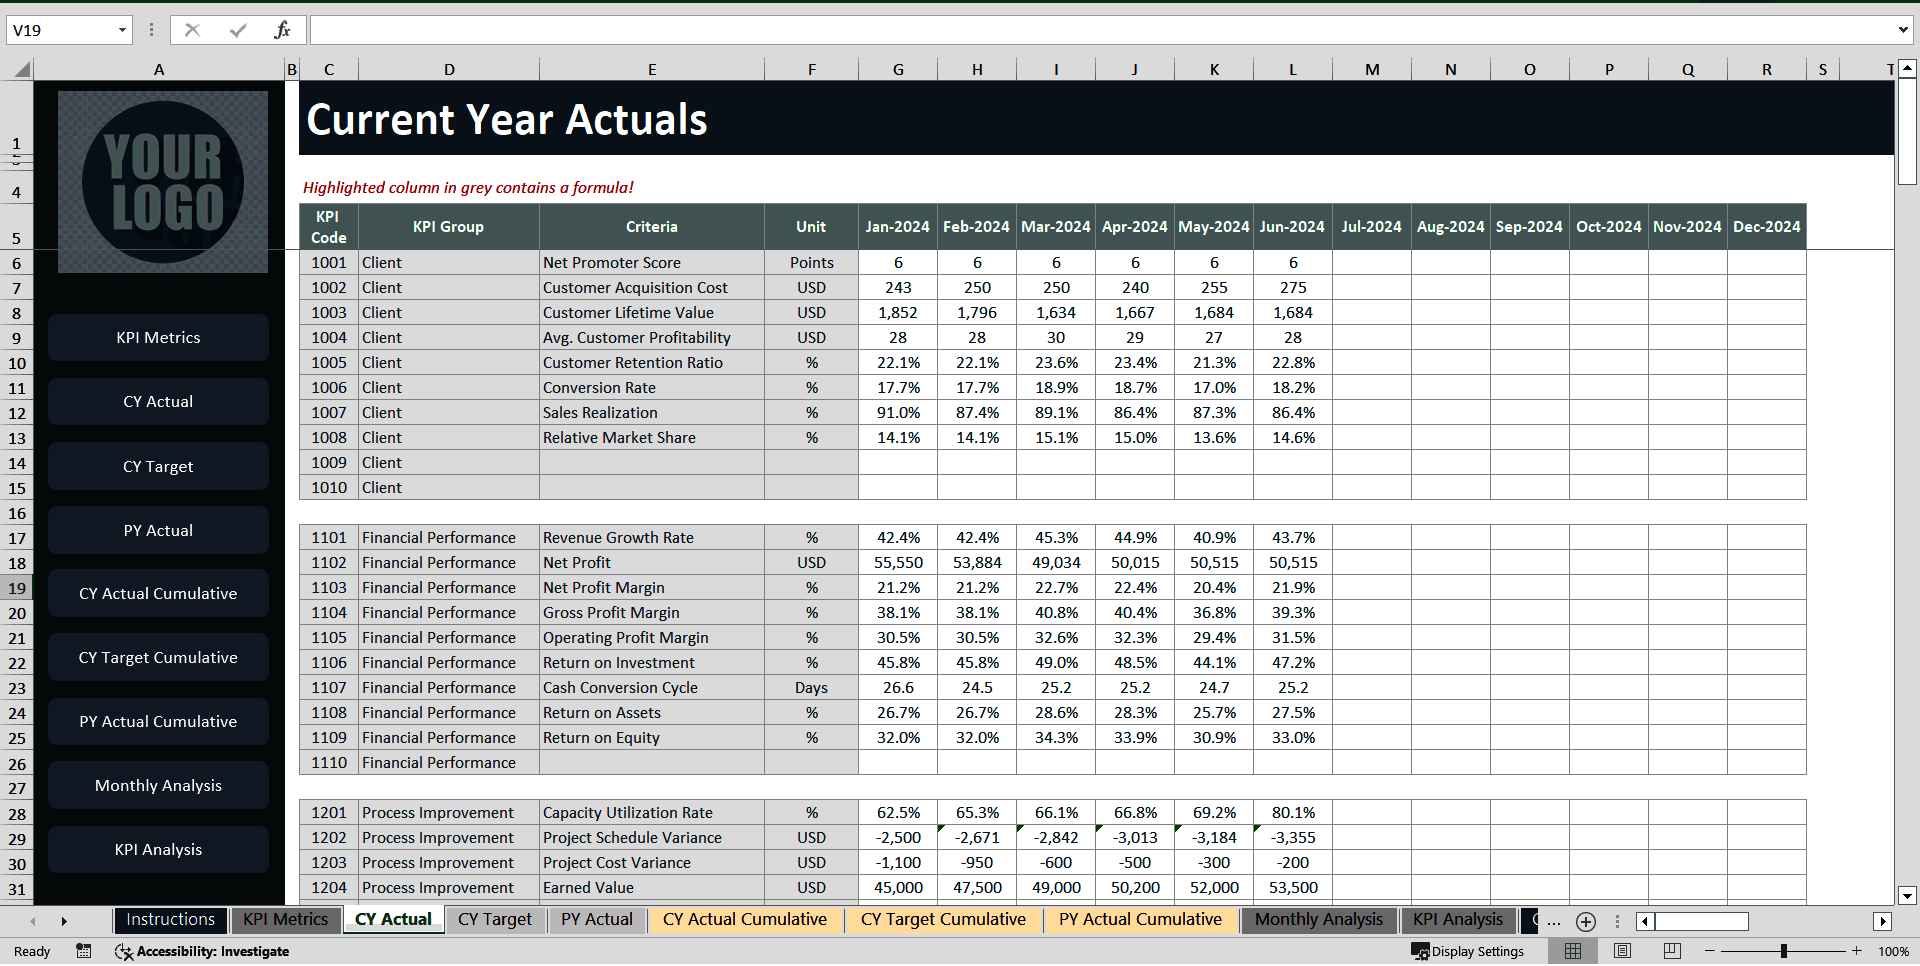
ACTUALS – CURRENT YEAR
• Enter real-time data month-by-month for each KPI.
• White cells are for manual input; gray cells are protected and automatically update based on your setup.
• The months displayed are tied to the date format you've selected in the main settings.

TARGETS – CURRENT YEAR
• Define your expected performance values for each KPI throughout the year.
• All calculations and comparisons are handled automatically—only input is needed in editable fields.
• Monthly layout adjusts according to your selected fiscal/calendar start.

ACTUALS – PREVIOUS YEAR
• Add your past year's KPI data for side-by-side comparison with current figures.
• Protected cells will automatically adjust based on your inputs and metric settings.
• Use this to analyze growth, performance dips, and progress over time.

CUMULATIVE DATA – CURRENT YEAR
• Automatically displays cumulative totals for the current year.
• Totals are calculated using the Sum or Average rule defined in the Metrics section.
• No need for manual calculation—everything updates dynamically.

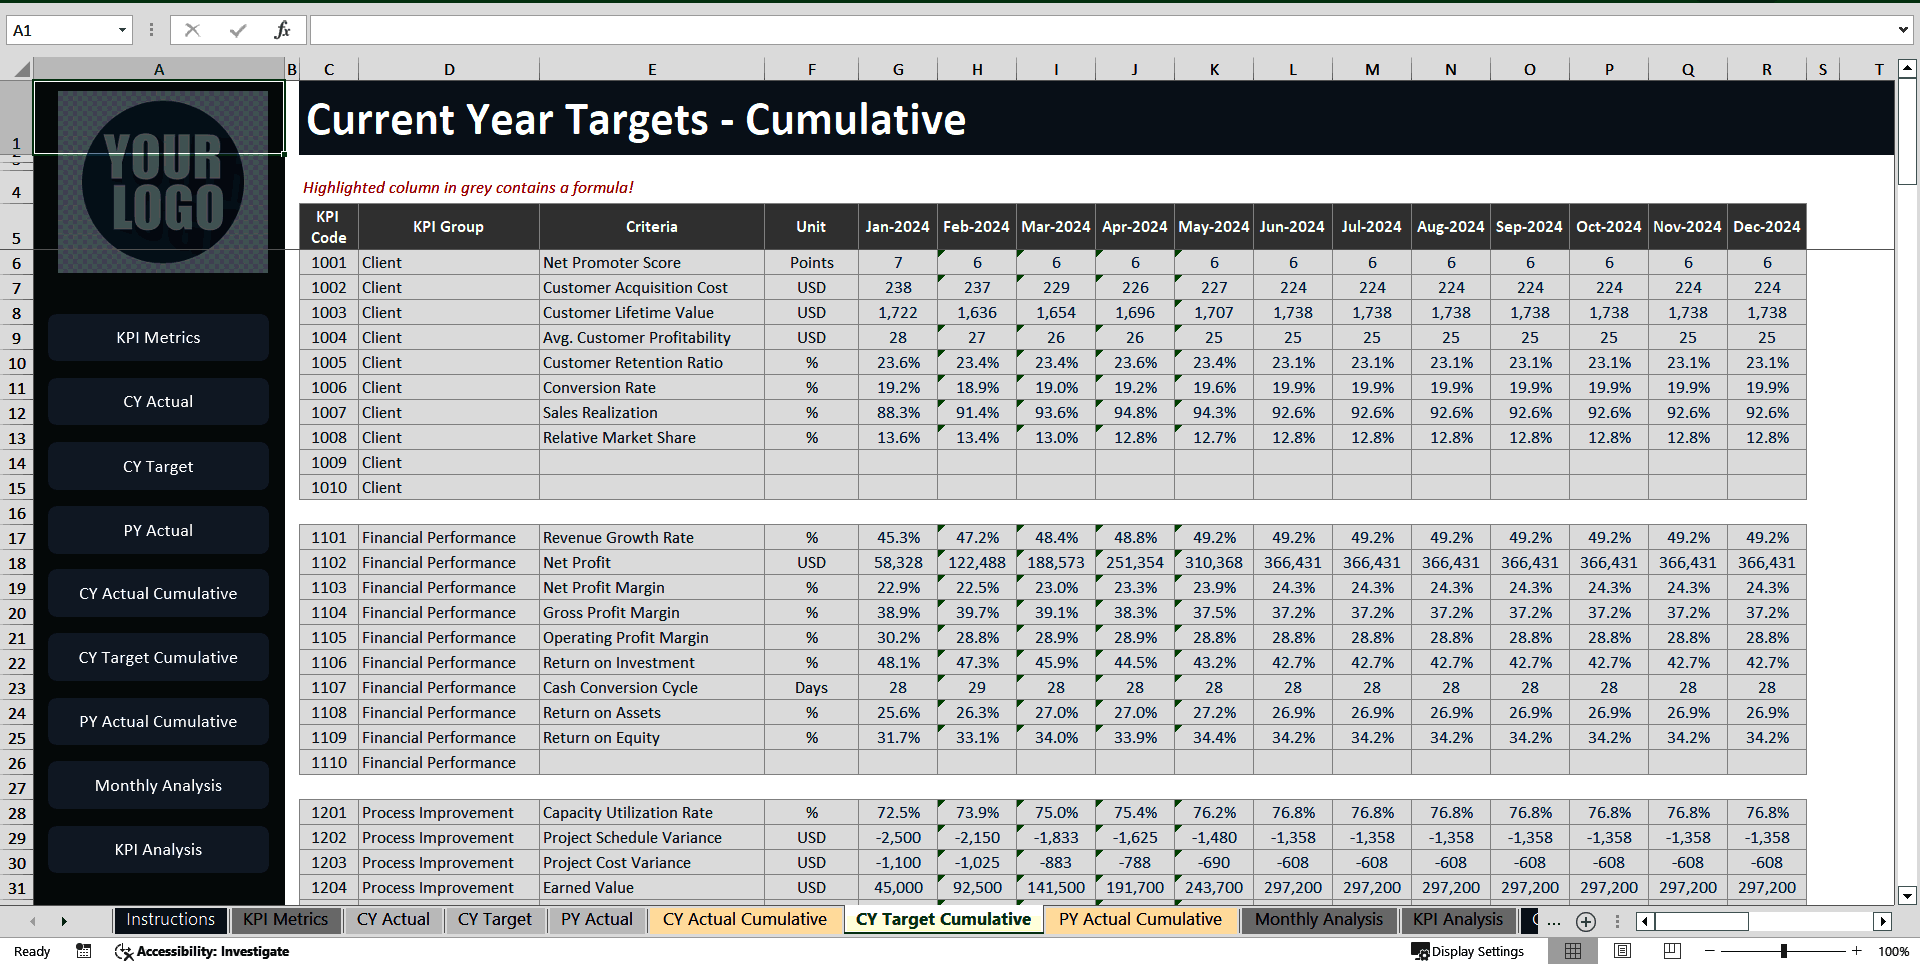
CUMULATIVE TARGETS – CURRENT YEAR
• Tracks progress against your yearly goals.
• Automatically adjusts based on the method selected and values entered in the targets section.
• Helps visualize how close you are to your objectives.

CUMULATIVE DATA – PREVIOUS YEAR
• Shows year-to-date totals for last year's performance.
• Useful for benchmarking and highlighting long-term performance shifts.
• Fully calculated—just plug in your previous year's data.

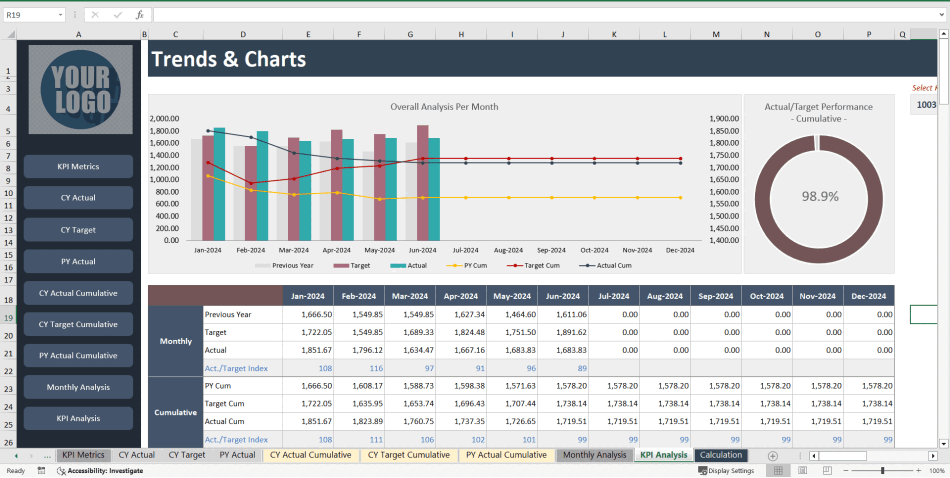
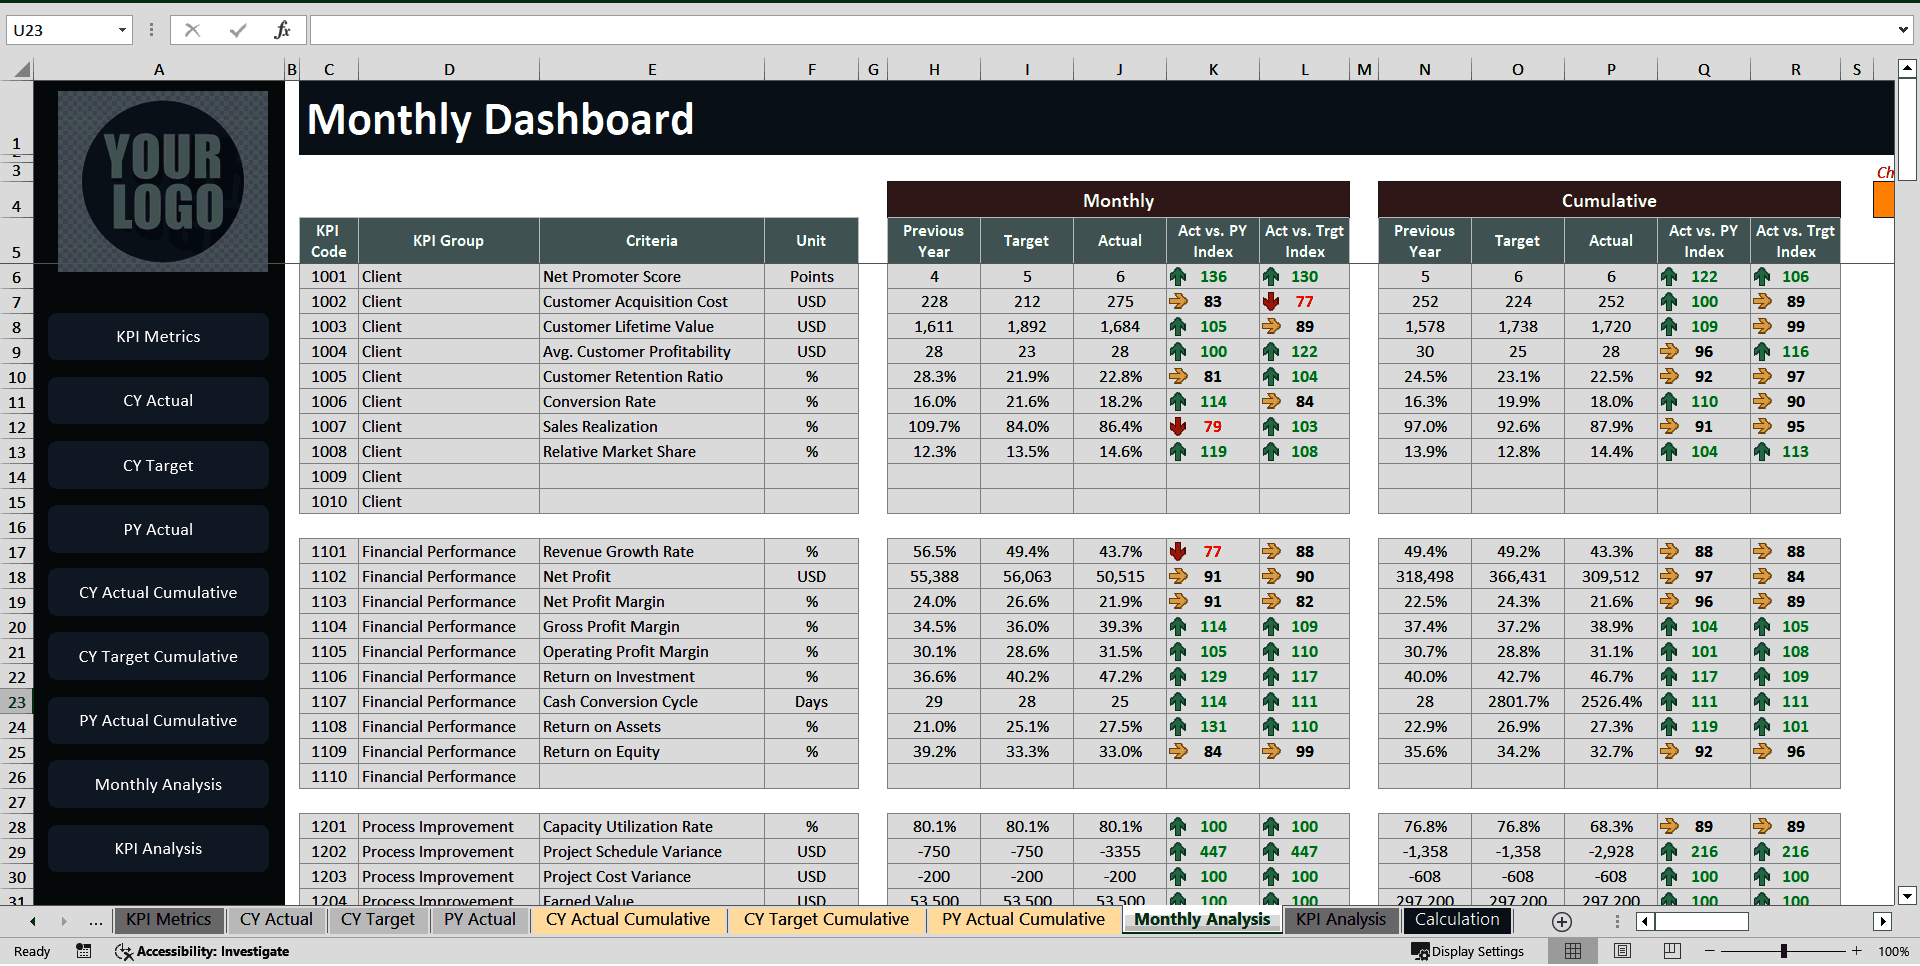
MONTHLY PERFORMANCE SNAPSHOT
• Quickly analyze monthly performance using visual indicators.
• Choose any month from the dropdown to see how actuals stack up against targets and last year.
• Color-coded system:

• Green: Meeting or exceeding expectations
• Yellow: 80 to 99 percent of target
• Red: Below 80 percent – needs attention
• No manual calculations required—this section runs automatically.

TRENDS & KPI VISUALS
• Select any KPI to explore detailed monthly and cumulative trends.
• Line and doughnut charts help present data in a clear, visual format.
• Ideal for reporting and stakeholder reviews.

Simple. Flexible. Effective.
This template was built with real users in mind—designed to save time, reduce manual work, and give you the insight you need to improve performance. Whether for internal tracking or client reporting, it brings structure and professionalism to your data.

Got a question about the product? Email us at support@flevy.com or ask the author directly by using the "Ask the Author a Question" form. If you cannot view the preview above this document description, go here to view the large preview instead.

Source: Best Practices in Key Performance Indicators Excel: Finance KPI Excel Dashboard Excel (XLSX) Spreadsheet, Improve Your Excel


$49.00

Add to Cart
  

ABOUT THE AUTHOR

Author image
Additional documents from author: 84

Introducing our Excel Premium Templates – your solution to simplifying your tasks. Our collection offers meticulously designed templates that are crafted to streamline your work processes and enhance efficiency. Whether you're managing budgets, creating reports, or organizing data, our premium templates are tailored to cater to your specific needs. With user-friendly interfaces and ... [read more]

Ask the Author a Question

You must be logged in to contact the author.

Click here to log in Click here register

Did you know?
The average daily rate of a McKinsey consultant is $6,625 (not including expenses). The average price of a Flevy document is $65.


Trusted by over 10,000+ Client Organizations
Since 2012, we have provided best practices to over 10,000 businesses and organizations of all sizes, from startups and small businesses to the Fortune 100, in over 130 countries.
AT&T GE Cisco Intel IBM Coke Dell Toyota HP Nike Samsung Microsoft Astrazeneca JP Morgan KPMG Walgreens Walmart 3M Kaiser Oracle SAP Google E&Y Volvo Bosch Merck Fedex Shell Amgen Eli Lilly Roche AIG Abbott Amazon PwC T-Mobile Broadcom Bayer Pearson Titleist ConEd Pfizer NTT Data Schwab


Read Customer Testimonials

 
"The wide selection of frameworks is very useful to me as an independent consultant. In fact, it rivals what I had at my disposal at Big 4 Consulting firms in terms of efficacy and organization."

– Julia T., Consulting Firm Owner (Former Manager at Deloitte and Capgemini)
 
"Last Sunday morning, I was diligently working on an important presentation for a client and found myself in need of additional content and suitable templates for various types of graphics. Flevy.com proved to be a treasure trove for both content and design at a reasonable price, considering the time I "

– M. E., Chief Commercial Officer, International Logistics Service Provider
 
"I have used FlevyPro for several business applications. It is a great complement to working with expensive consultants. The quality and effectiveness of the tools are of the highest standards."

– Moritz Bernhoerster, Global Sourcing Director at Fortune 500
 
"My FlevyPro subscription provides me with the most popular frameworks and decks in demand in today’s market. They not only augment my existing consulting and coaching offerings and delivery, but also keep me abreast of the latest trends, inspire new products and service offerings for my practice, and educate me "

– Bill Branson, Founder at Strategic Business Architects
 
"As a niche strategic consulting firm, Flevy and FlevyPro frameworks and documents are an on-going reference to help us structure our findings and recommendations to our clients as well as improve their clarity, strength, and visual power. For us, it is an invaluable resource to increase our impact and value."

– David Coloma, Consulting Area Manager at Cynertia Consulting
 
"Flevy is our 'go to' resource for management material, at an affordable cost. The Flevy library is comprehensive and the content deep, and typically provides a great foundation for us to further develop and tailor our own service offer."

– Chris McCann, Founder at Resilient.World
 
"I have found Flevy to be an amazing resource and library of useful presentations for lean sigma, change management and so many other topics. This has reduced the time I need to spend on preparing for my performance consultation. The library is easily accessible and updates are regularly provided. A wealth of great information."

– Cynthia Howard RN, PhD, Executive Coach at Ei Leadership
 
"As a small business owner, the resource material available from FlevyPro has proven to be invaluable. The ability to search for material on demand based our project events and client requirements was great for me and proved very beneficial to my clients. Importantly, being able to easily edit and tailor "

– Michael Duff, Managing Director at Change Strategy (UK)


Your Recently Viewed Documents


Customers Also Like These Documents

Related Management Topics


Human Resources Logistics KPI Hiring Transportation Hotel Industry Valuation Model Example Integrated Financial Model Healthcare Scheduling Costing Customer Relationship Management Workplace Safety

Download our FREE Strategy & Transformation Framework Templates

Download our free compilation of 50+ Strategy & Transformation slides and templates. Frameworks include McKinsey 7-S, Balanced Scorecard, Disruptive Innovation, BCG Curve, and many more.