
Cost-Benefit Analysis Toolkit – Excel XLSX
Excel (XLSX)
BENEFITS OF THIS DOWNLOADABLE EXCEL DOCUMENT
- Provides a fully dynamic Excel framework for evaluating any investment decision with automatic NPV, IRR, Payback Period and Profitability Index calculations.
- Delivers a complete 7-sheet cost-benefit appraisal system covering one-off costs, ongoing revenues, cash flow, P&L impact and an executive dashboard -- all connected and ready to use.
- Enables finance teams, PMOs and operations leaders to build boardroom-ready business cases with standardized financial methodology and zero manual formula work.
BUSINESS CASE DEVELOPMENT EXCEL DESCRIPTION
Curated by McKinsey-trained Executives
🚨 THE MOST COMPLETE COST-BENEFIT ANALYSIS TOOLKIT🚨
💣 A FULLY DYNAMIC, FORMULA-DRIVEN FINANCIAL DECISION ENGINE – DELIVERED AS A READY-TO-DEPLOY EXCEL TEMPLATE 💣
🔥 THIS IS WHAT HAPPENS WHEN YOU STOP GUESSING ON INVESTMENTS… AND START MAKING DECISIONS WITH FINANCIAL PRECISION 🔥
Most organizations are not failing because of bad ideas.
They are failing because nobody can prove which ideas are worth funding.
❌ Investment decisions made on gut feel with no financial model behind them
❌ NPV, IRR and Payback Period calculated differently by every team
❌ Business cases built from scratch every single time
❌ Cash flow projections scattered across disconnected spreadsheets
❌ No visibility on when a project actually breaks even
❌ Finance and operations looking at completely different numbers
❌ Capital allocation decisions made without profitability evidence
❌ P&L impacts and cash impacts confused and misreported
❌ Leadership asking for numbers that take days to pull together
❌ Approved projects that should never have been approved
Let's be real:
> If your organization has no standardized financial appraisal system… you are not making investment decisions. You are making expensive guesses with other people's money.
One bad investment approved.
One profitable project rejected.
One business case built on wrong assumptions.
One board presentation with inconsistent numbers.
That is all it takes to destroy financial credibility.
🚀 INTRODUCING: THE ADVANCED COST-BENEFIT ANALYSIS TOOLKIT – EXCEL EDITION
💣 A COMPLETE FINANCIAL APPRAISAL AND INVESTMENT DECISION SYSTEM
✔ 375+ live formulas across 7 fully connected worksheets
✔ Delivered as a ready-to-use, pre-populated Excel template
✔ Built for finance teams, PMOs, COO organizations and investment committees
✔ Covers one-off costs, ongoing costs, revenues, cash flow, P&L, appraisal metrics and executive dashboards
✔ Designed for speed, accuracy, repeatability and boardroom-ready output
✔ Creates a single source of financial truth across every investment decision
🧠 WHAT IS BUILT INTO EVERY SHEET
Every worksheet is professionally structured with:
✔ Blue input cells – the only cells you ever touch
✔ Fully dynamic formulas that update every output automatically
✔ Industry-standard color coding for inputs, formulas and cross-sheet links
✔ Conditional formatting that flags risk, negative cash flow and breakeven
✔ Named ranges for clean, auditable formula logic
✔ Pre-populated exemplary data so you can see it working immediately
📚 FULL TOOLKIT OVERVIEW
🧩 SHEET 1 – INSTRUCTIONS
Comprehensive guidance on every input, every formula and every metric. Color coding explained. Navigation mapped. Methodology documented. You will never need to guess how anything works.
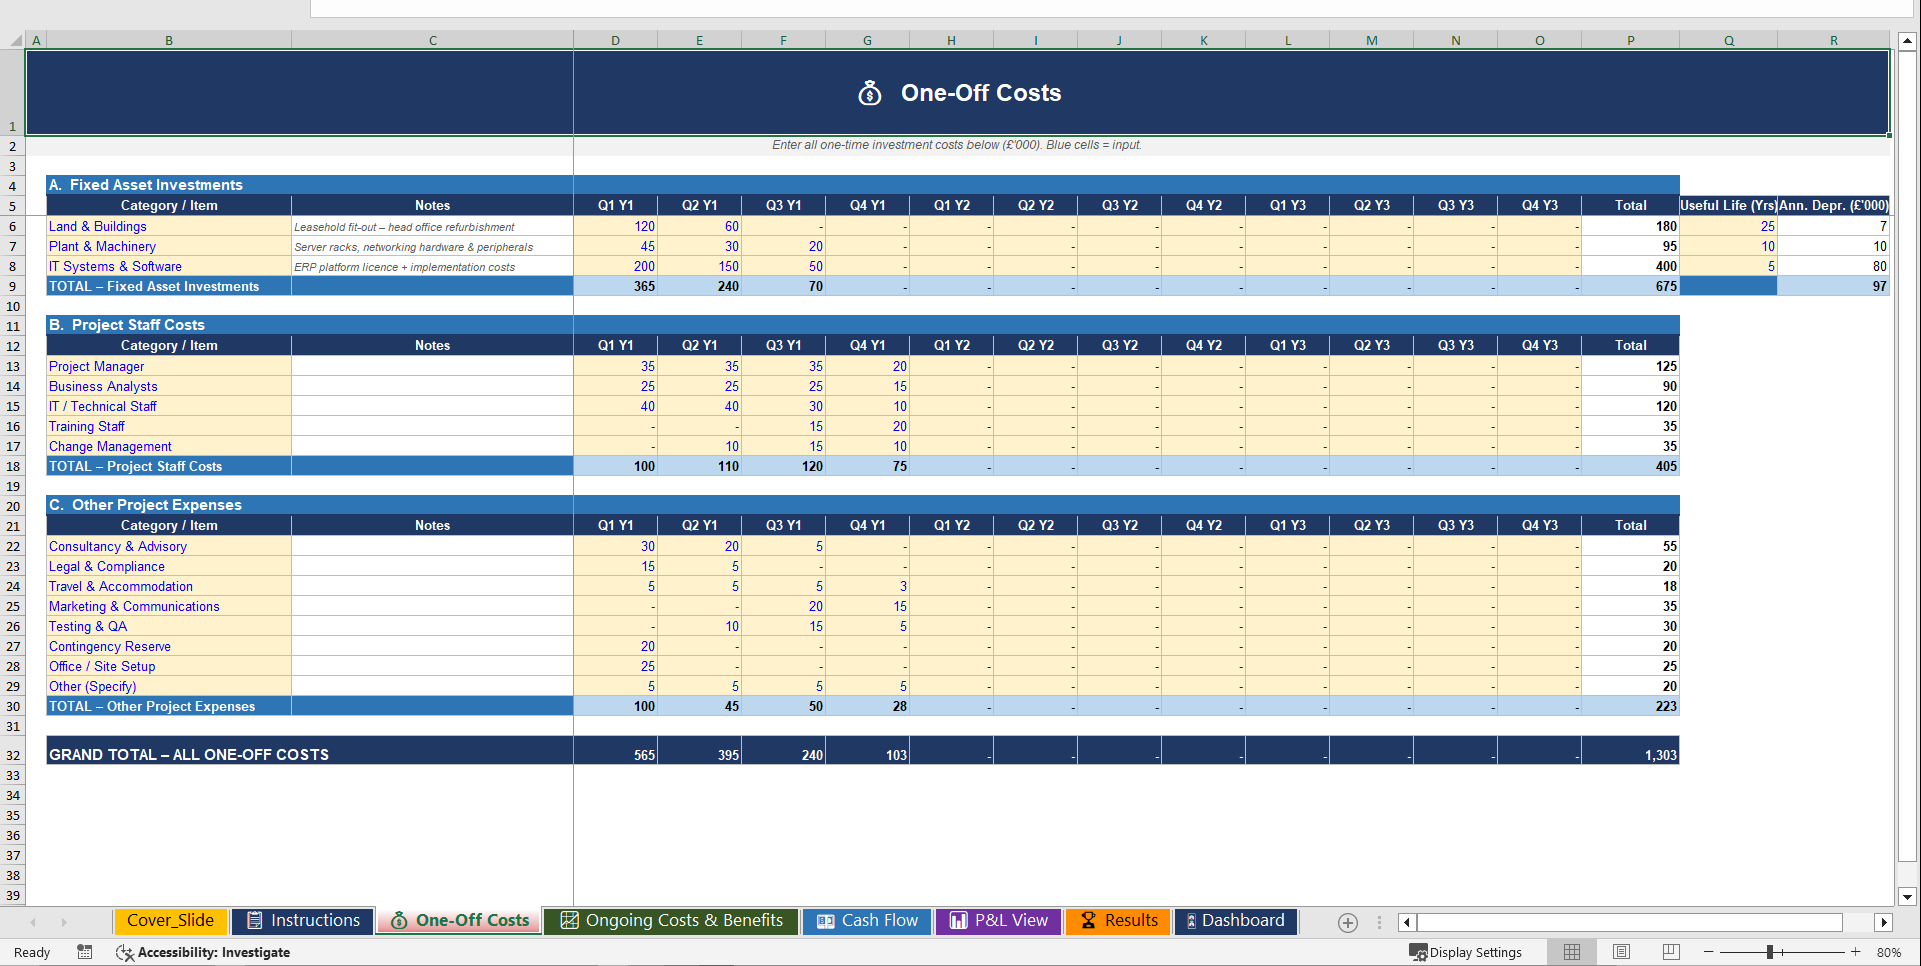
💰 SHEET 2 – ONE-OFF COSTS
Three fully structured cost tables covering Fixed Asset Investments with automatic straight-line depreciation, Project Staff Costs across five categories, and Other Project Expenses across eight categories. Twelve quarterly periods. Every line item totalled automatically.
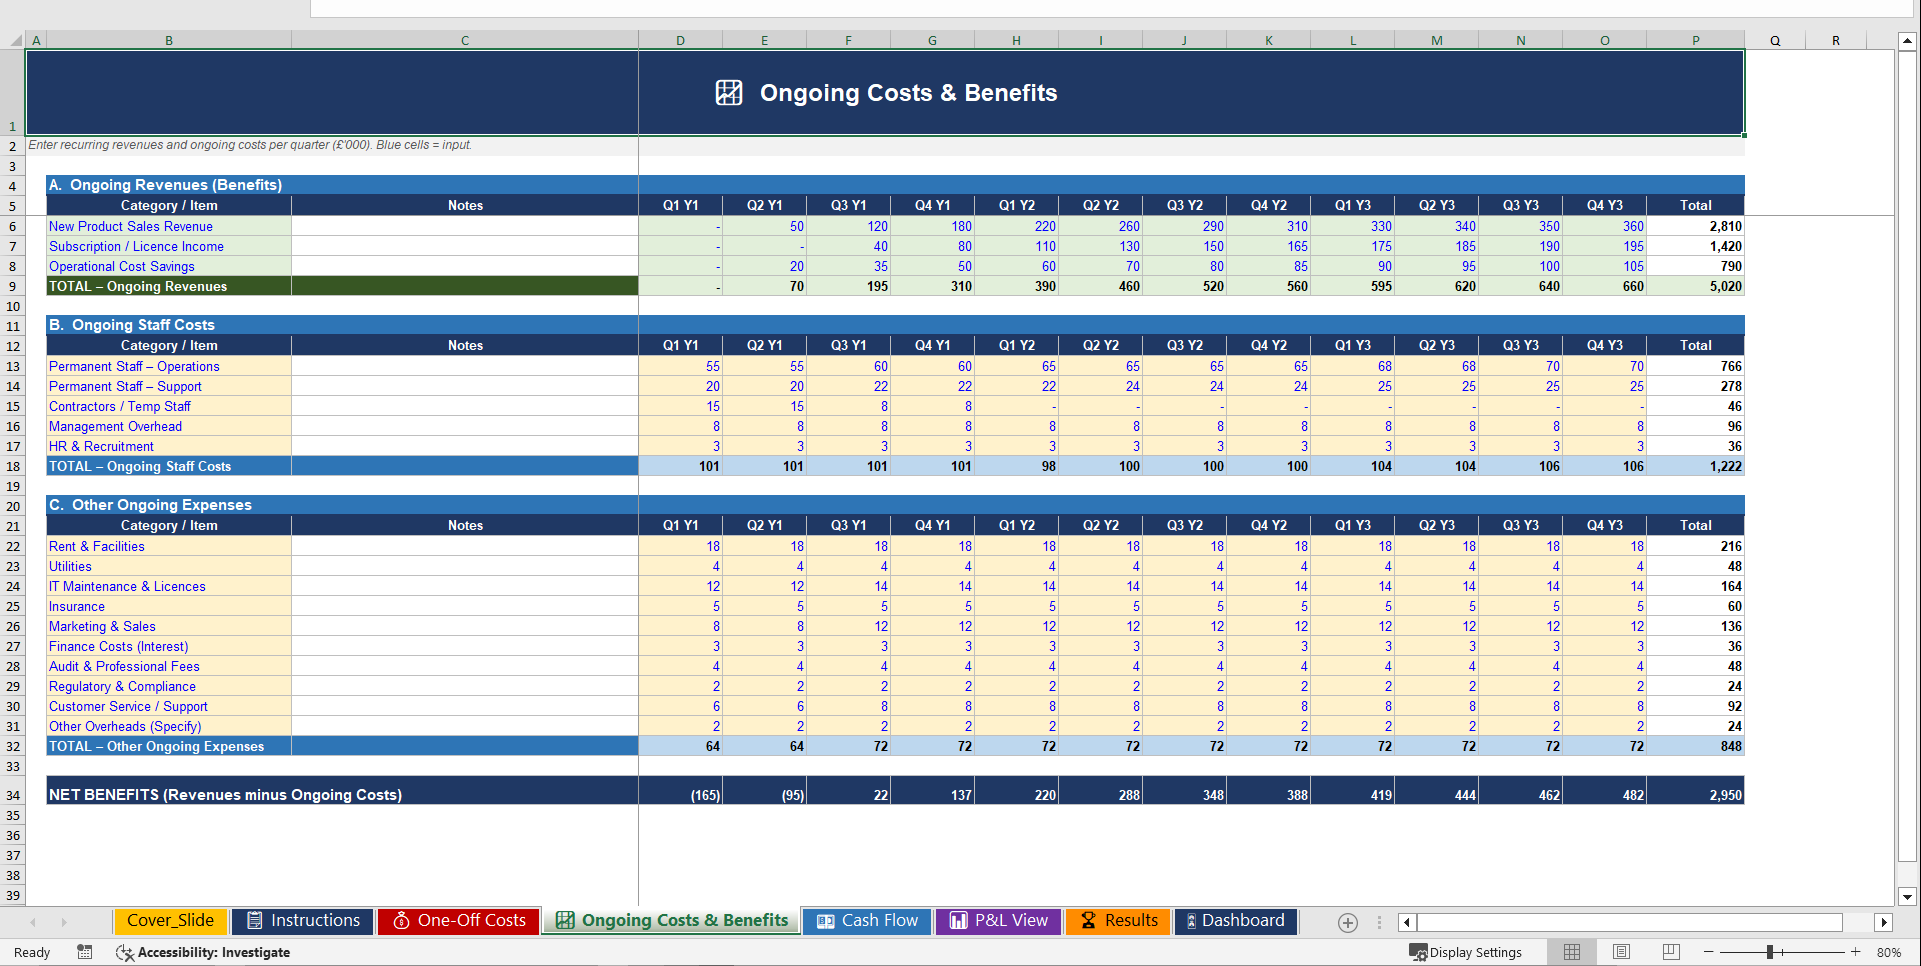
📈 SHEET 3 – ONGOING COSTS & BENEFITS
Three revenue streams. Five ongoing staff cost categories. Ten recurring expense lines. Net Benefits calculated automatically every quarter as revenues minus all ongoing costs. Every number connected. Every change instant.
💵 SHEET 4 – CASH FLOW
Full cash inflow and outflow analysis across twelve quarters. Net cash flow per period calculated automatically. Cumulative cash flow tracked with conditional formatting – red when negative, green when positive. Breakeven visible at a glance.
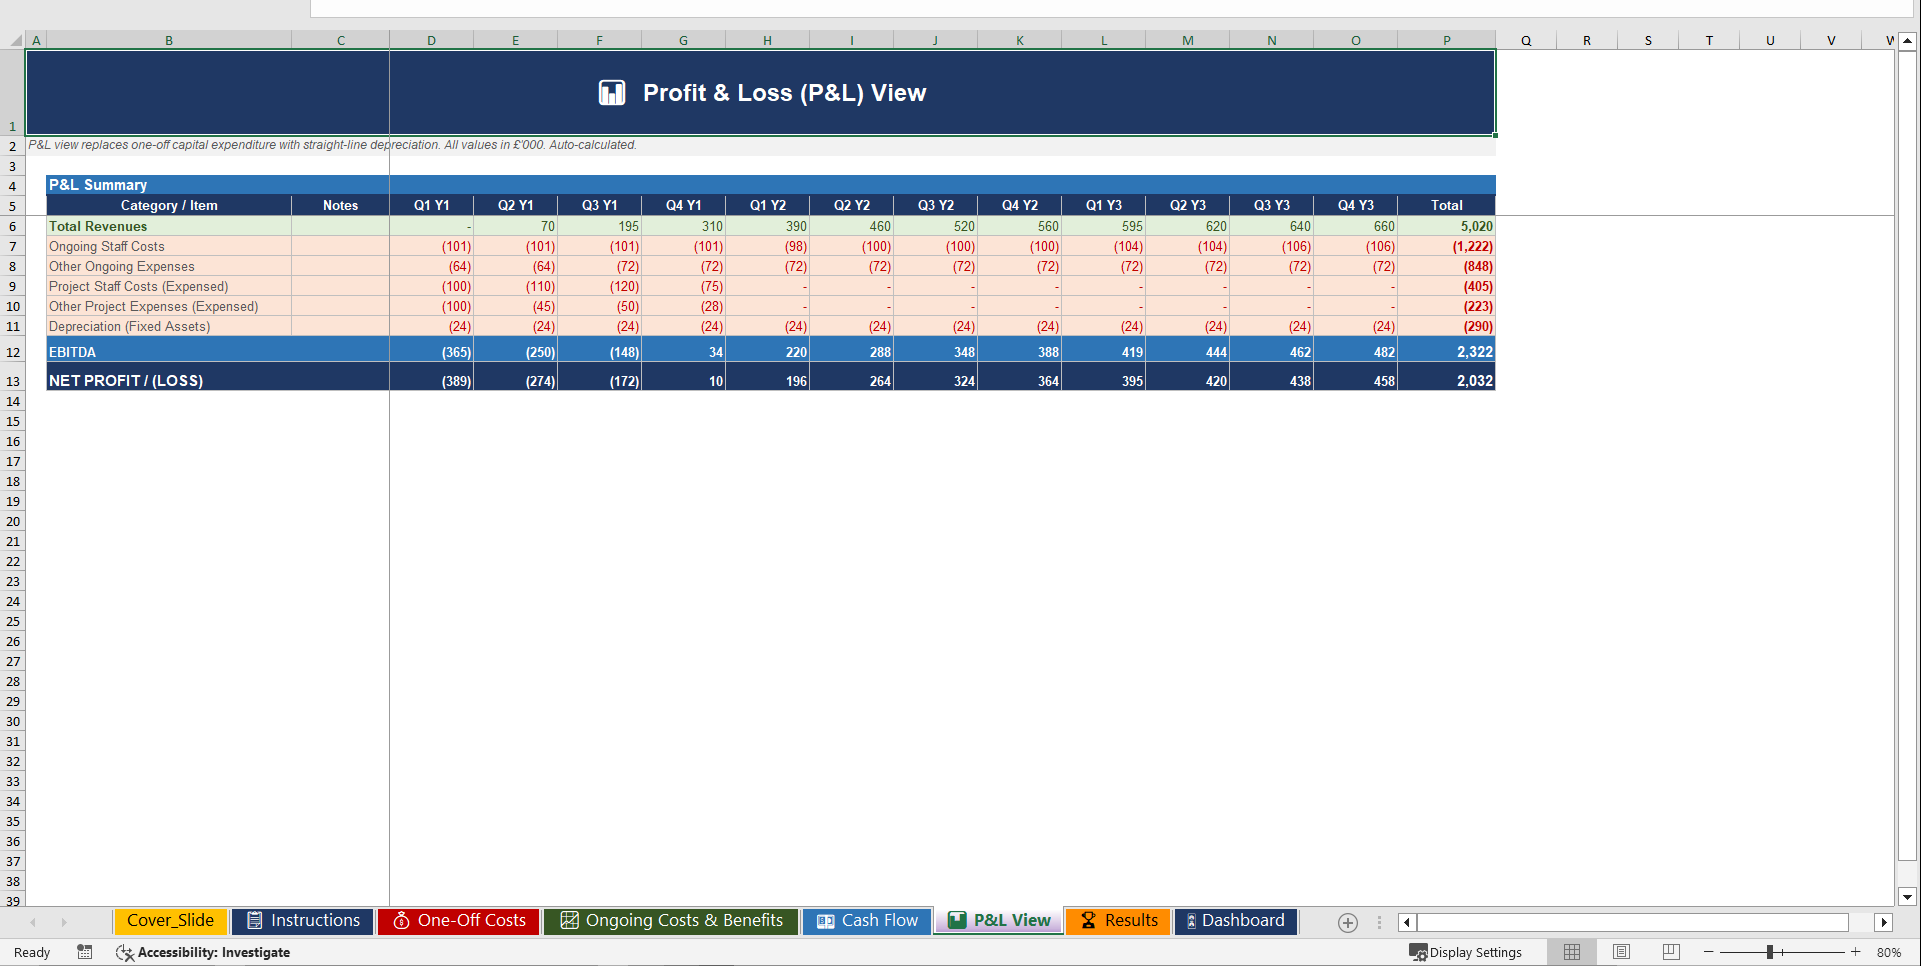
📊 SHEET 5 – P&L VIEW
Profit and loss impact including straight-line depreciation on every fixed asset. EBITDA calculated per quarter. Net profit or loss tracked across the full three-year horizon. Cash view and accounting view kept completely separate and fully reconciled.
🏆 SHEET 6 – RESULTS
Every key appraisal metric calculated automatically:
✔ Total One-Off Investment
✔ Average Net Benefits Per Annum
✔ NPV – Net Present Value
✔ IRR – Internal Rate of Return
✔ Payback Period in Quarters
✔ Profitability Index
✔ Cash View vs P&L View Summary Table
✔ Dynamic charts updating live with your data
🎛 SHEET 7 – EXECUTIVE DASHBOARD
Six KPI tiles. Four dynamic charts. Cumulative cash flow trends. Revenue vs cost comparisons. Net cash flow per quarter. P&L revenue against net profit. Everything a board, CFO or investment committee needs. On one screen. In under ten seconds.
💣 WHAT THIS TOOLKIT DELIVERS
This is not a spreadsheet template.
This is a COMPLETE FINANCIAL APPRAISAL AND INVESTMENT DECISION SYSTEM IN EXCEL FORMAT.
✔ Standardizes investment evaluation across every team and every project
✔ Eliminates inconsistent business case methodology
✔ Creates a single auditable source of financial truth
✔ Calculates NPV, IRR and Payback Period automatically – no manual formulas
✔ Separates cash impacts from P&L impacts with full reconciliation
✔ Tracks depreciation automatically based on your asset useful life inputs
✔ Produces boardroom-ready output the moment data is entered
✔ Reduces business case build time from days to under one hour
✔ Flags negative cash flow and breakeven automatically with conditional formatting
✔ Scales from a startup investment decision to an enterprise capital allocation process
🏢 BUILT FOR
✔ CFOs and Finance Directors
✔ PMOs and Program Management Offices
✔ COO Organizations and Operations Leaders
✔ Investment Committees and Capital Allocation Panels
✔ Strategy and Transformation Teams
✔ Business Case Authors and Project Sponsors
✔ Enterprise Change Management Teams
✔ Product and Engineering Leadership
✔ Shared Services and Centre of Excellence Teams
✔ Scaling Startups and Large Enterprises
🚨 FINAL TRUTH
If your organization has no standardized cost-benefit appraisal system:
❌ Every business case gets built differently
❌ NPV and IRR mean different things to different people
❌ Finance and operations never agree on the numbers
❌ Investment decisions take longer than the opportunities last
❌ Bad projects get funded and good projects get rejected
❌ Leadership loses confidence in financial forecasting
❌ Accountability for ROI disappears after approval
❌ Post-investment reviews reveal what everyone already knew
💣 THAT IS NOT FINANCIAL DECISION-MAKING – THAT IS CAPITAL DESTRUCTION WITH EXTRA STEPS.
🚀 THIS IS THE TRANSFORMATION
From gut-feel decisions → to data-driven investment appraisal
From inconsistent business cases → to standardized financial methodology
From scattered spreadsheets → to one connected financial model
From manual NPV calculations → to automatic appraisal metrics
From delayed business cases → to boardroom-ready output in under an hour
From tribal finance knowledge → to institutionalized investment evaluation
Key Words:
Strategy & Transformation, Growth Strategy, Strategic Planning, Strategy Frameworks, Innovation Management, Pricing Strategy, Core Competencies, Strategy Development, Business Transformation, Marketing Plan Development, Product Strategy, Breakout Strategy, Competitive Advantage, Mission, Vision, Values, Strategy Deployment & Execution, Innovation, Vision Statement, Core Competencies Analysis, Corporate Strategy, Product Launch Strategy, BMI, Blue Ocean Strategy, Breakthrough Strategy, Business Model Innovation, Business Strategy Example, Corporate Transformation, Critical Success Factors, Customer Segmentation, Customer Value Proposition, Distinctive Capabilities, Enterprise Performance Management, KPI, Key Performance Indicators, Market Analysis, Market Entry Example, Market Entry Plan, Market Intelligence, Market Research, Market Segmentation, Market Sizing, Marketing, Michael Porter's Value Chain, Organizational Transformation, Performance Management, Performance Measurement, Platform Strategy, Product Go-to-Market Strategy, Reorganization, Restructuring, SWOT, SWOT Analysis, Service 4.0, Service Strategy, Service Transformation, Strategic Analysis, Strategic Plan Example, Strategy Deployment, Strategy Execution, Strategy Frameworks Compilation, Strategy Methodologies, Strategy Report Example, Value Chain, Value Chain Analysis, Value Innovation, Value Proposition, Vision Statement, Corporate Strategy, Business Development, Business plan pdf, business plan, PDF, Business Plan DOC, Business Plan Template, PPT, Market strategy playbook, strategic market planning, competitive analysis tools, market segmentation frameworks, growth strategy templates, product positioning strategy, market execution toolkit, strategic alignment playbook, KPI and OKR frameworks, business growth strategy guide, cross-functional strategy templates, market risk management, market strategy PowerPoint doc, guide, ebook, e-book ,McKinsey Change Playbook, Organizational change management toolkit, Change management frameworks 2025, Influence model for change, Change leadership strategies, Behavioral change in organizations, Change management PowerPoint templates, Transformational leadership in change, supply chain KPIs, supply chain KPI toolkit, supply chain PowerPoint template, logistics KPIs, procurement KPIs, inventory management KPIs, supply chain performance metrics, manufacturing KPIs, supply chain dashboard, supply chain strategy KPIs, reverse logistics KPIs, sustainability KPIs in supply chain, financial supply chain KPIs, warehouse KPIs, digital supply chain KPIs, 1200 KPIs, supply chain scorecard, KPI examples, supply chain templates, Corporate Finance SOPs, Finance SOP Excel Template, CFO Toolkit, Finance Department Procedures, Financial Planning SOPs, Treasury SOPs, Accounts Payable SOPs, Accounts Receivable SOPs, General Ledger SOPs, Accounting Policies Template, Internal Controls SOPs, Finance Process Standardization, Finance Operating Procedures, Finance Department Excel Template, FP&A Process Documentation, Corporate Finance Template, Finance SOP Toolkit, CFO Process Templates, Accounting SOP Package, Tax Compliance SOPs, Financial Risk Management Procedures.
NOTE: Our digital products are sold on an "as is" basis, making returns and refunds unavailable post-download. Please preview and inquire before purchasing. Please contact us before purchasing if you have any questions! This policy aligns with the standard Flevy Terms of Usage.
Got a question about the product? Email us at support@flevy.com or ask the author directly by using the "Ask the Author a Question" form. If you cannot view the preview above this document description, go here to view the large preview instead.
Source: Best Practices in Business Case Development Excel: Cost-Benefit Analysis Toolkit Excel (XLSX) Spreadsheet, SB Consulting
ABOUT THE AUTHOR
SB Consulting is dedicated to empowering businesses to communicate their ideas with impact. This consulting firm specializes in teaching organizations how to create effective corporate and management presentations. With training from top-tier global consulting firms, including McKinsey, BCG, and Porsche Consulting, extensive expertise in presentation design and ... [read more]
Ask the Author a Question
You must be logged in to contact the author.
