This product (Computer Industry Analysis Training) is a 91-slide PPT PowerPoint presentation slide deck (PPT), which you can download immediately upon purchase.
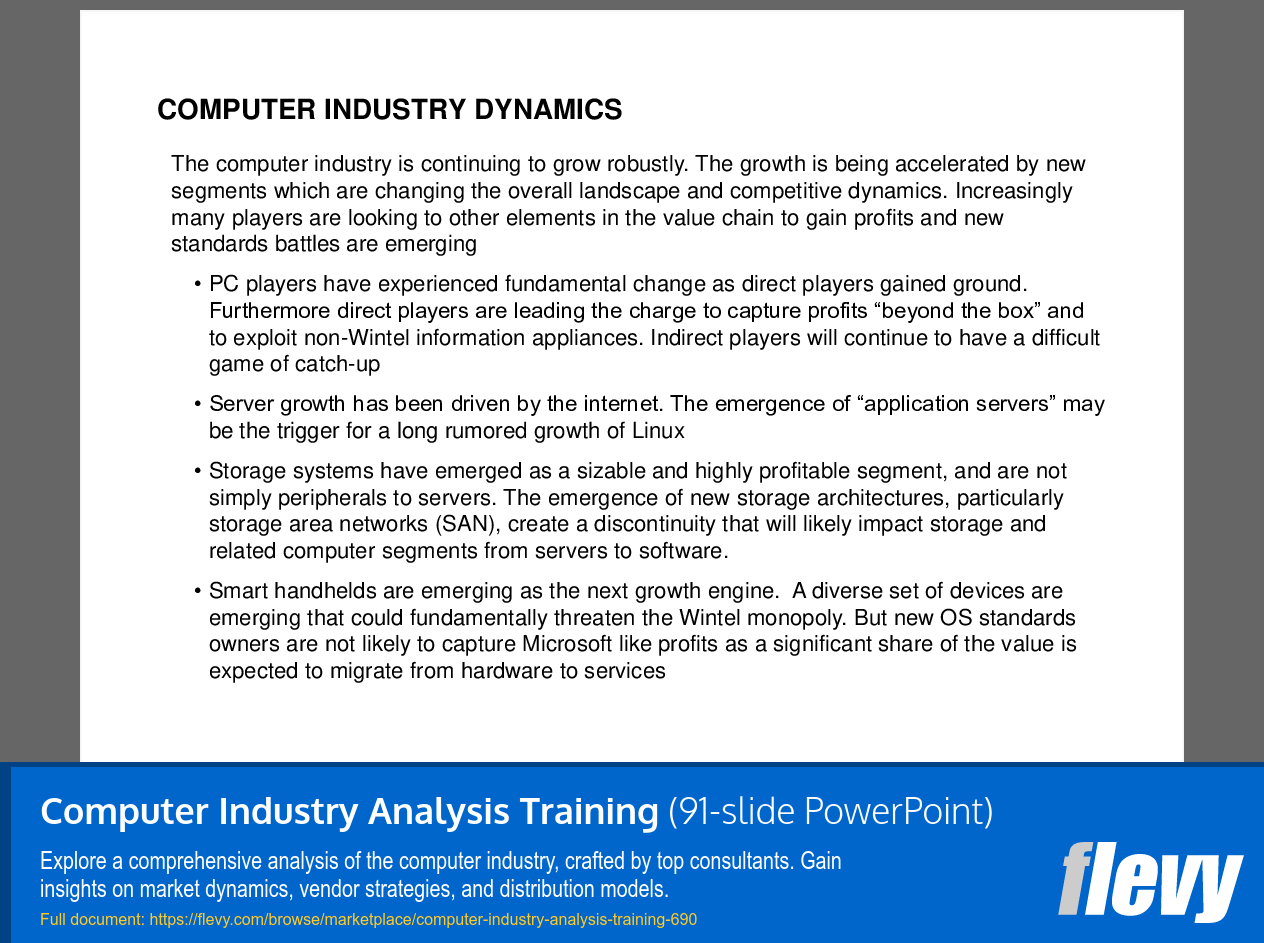
This presentation is developed by a leading consulting firm on the computer industry dynamics. The data in the document is a bit outdated but the document provides an excellent example of what the key elements of an industry analysis are and how some key framework and concepts are applied in such an analysis. Many slides in the presentation are re-useable in other consulting projects.
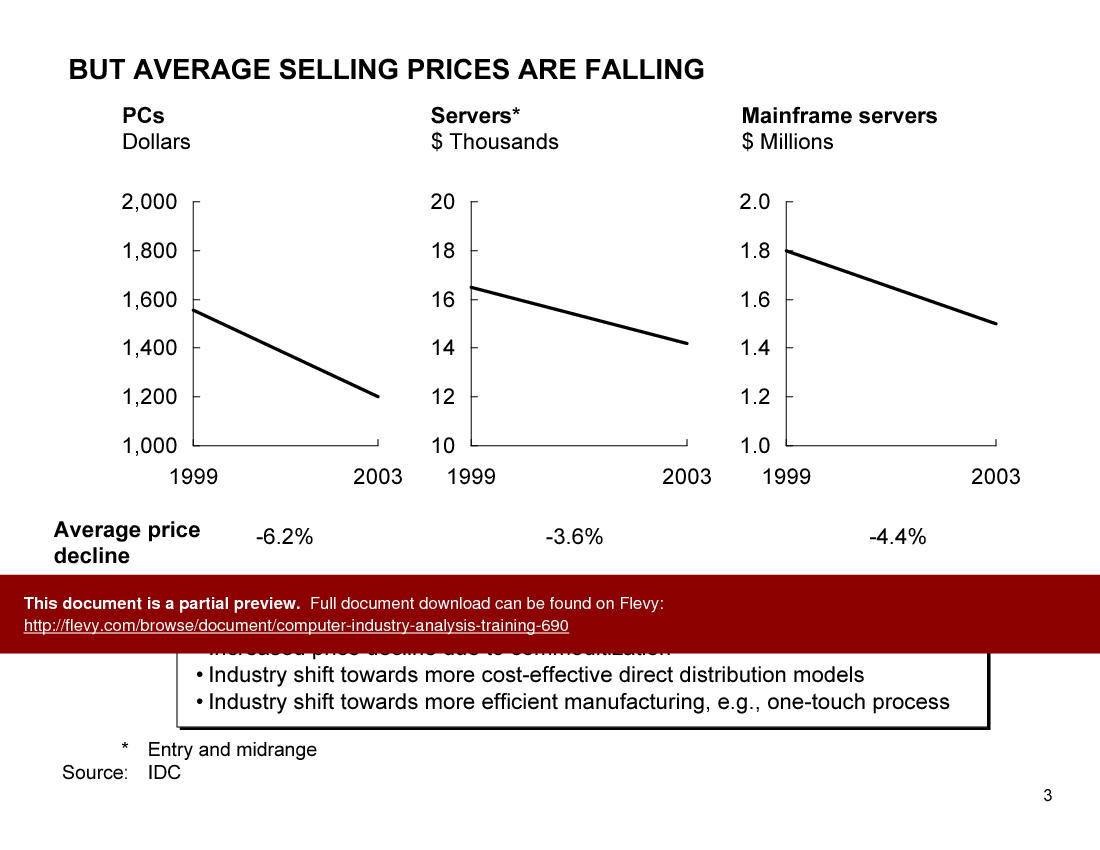
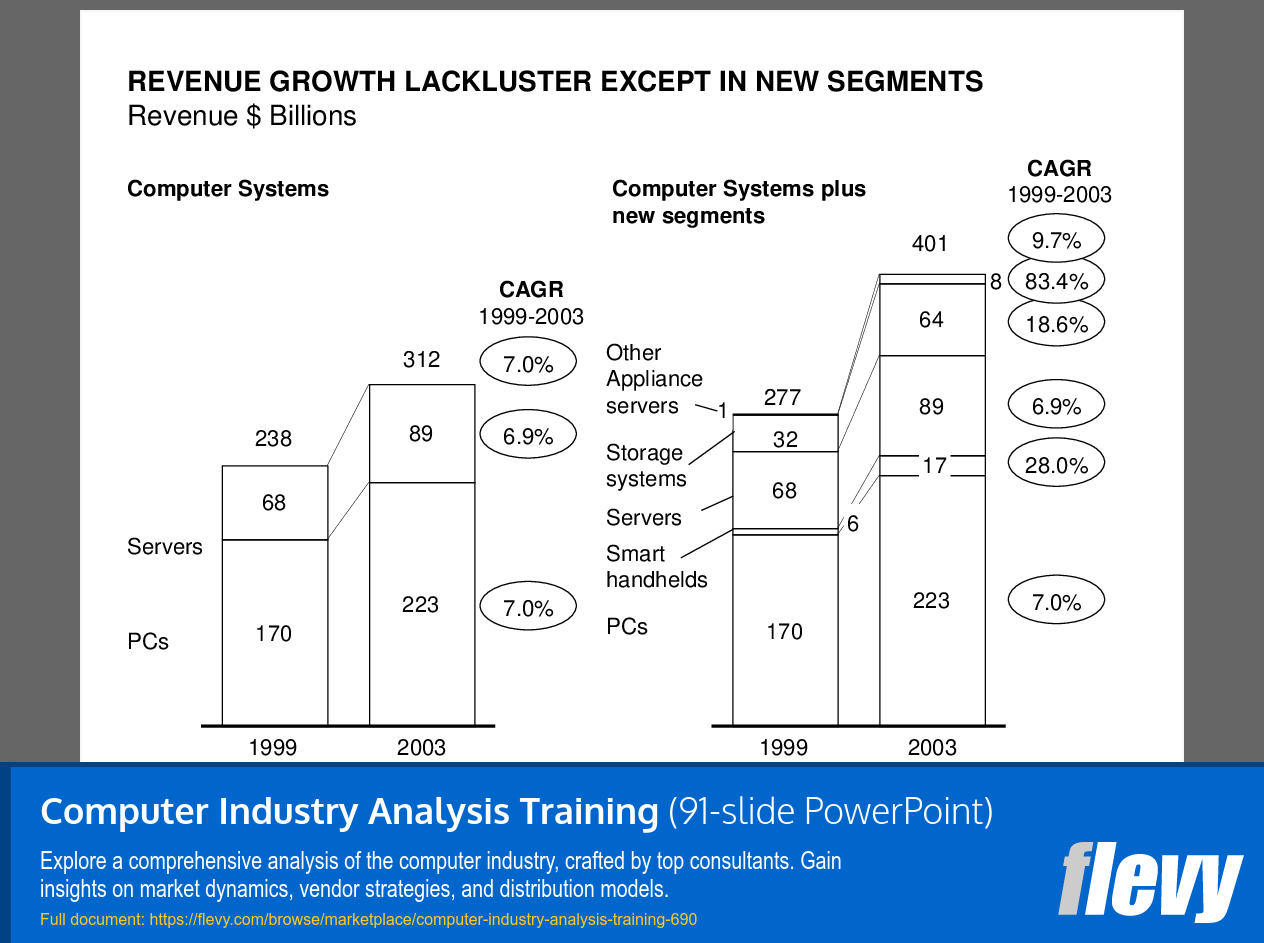
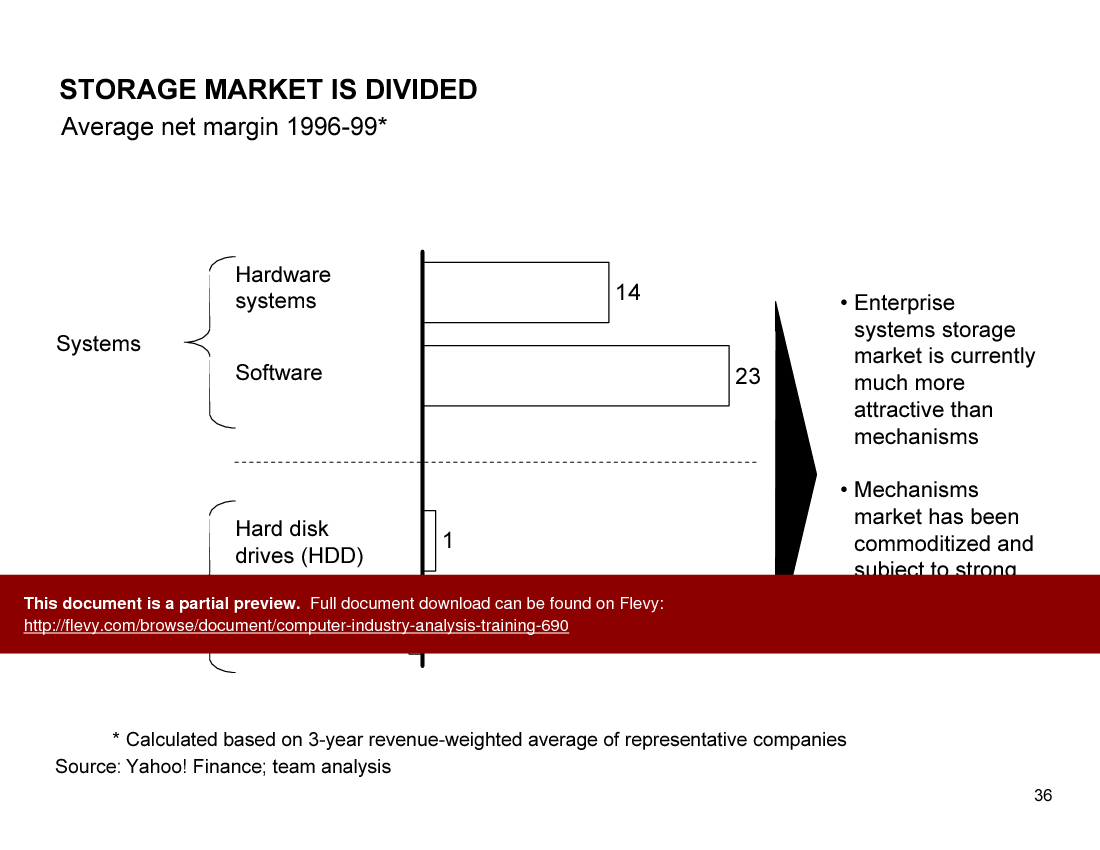
This comprehensive presentation delves into the critical aspects of the computer industry, offering a granular view of market dynamics and trends. It highlights the persistent decline in average selling prices across PCs, servers, and mainframe servers, emphasizing the industry's shift towards cost-effective distribution models and efficient manufacturing processes. This document is a valuable resource for understanding the economic forces shaping the computer market.
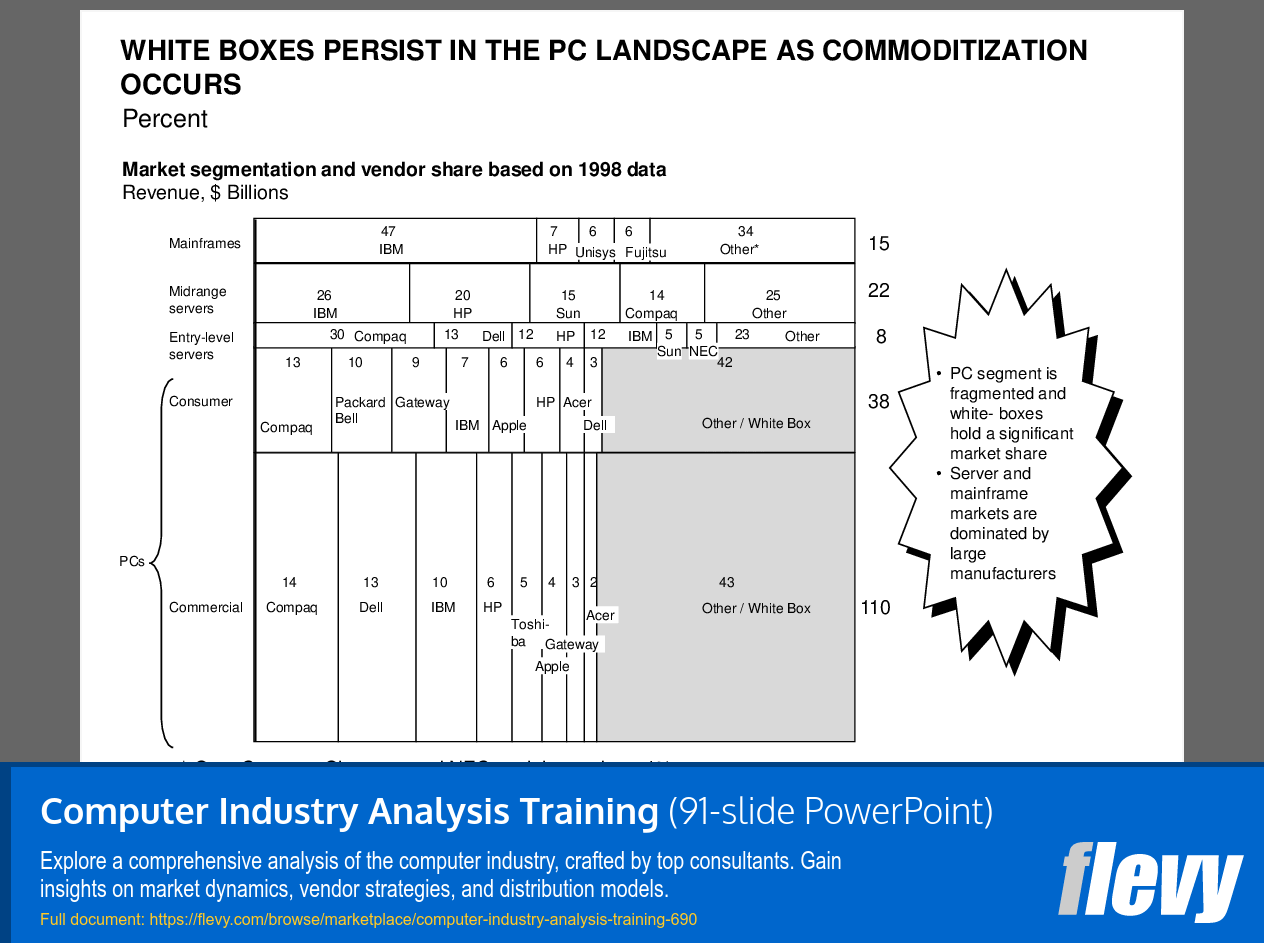
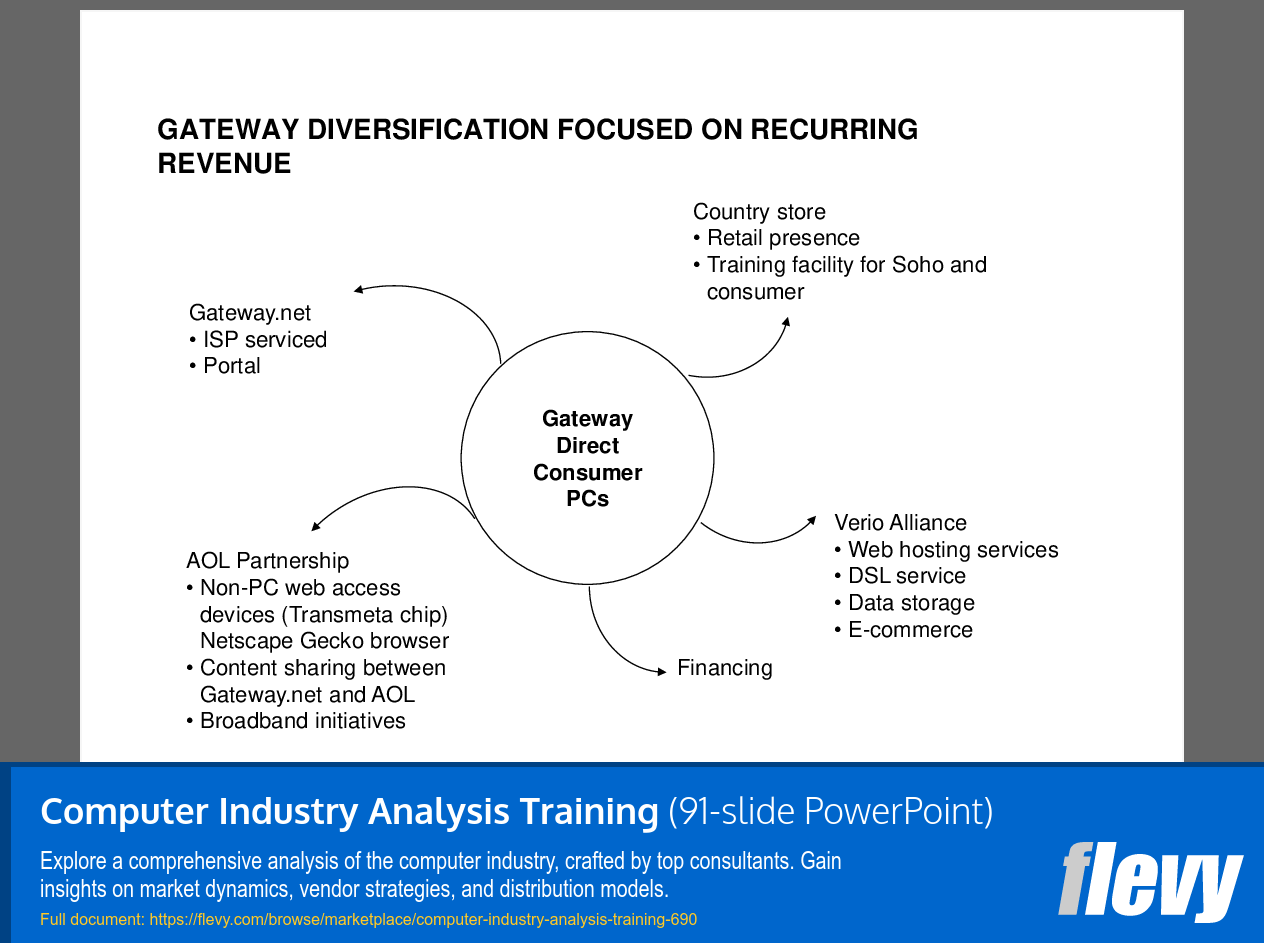
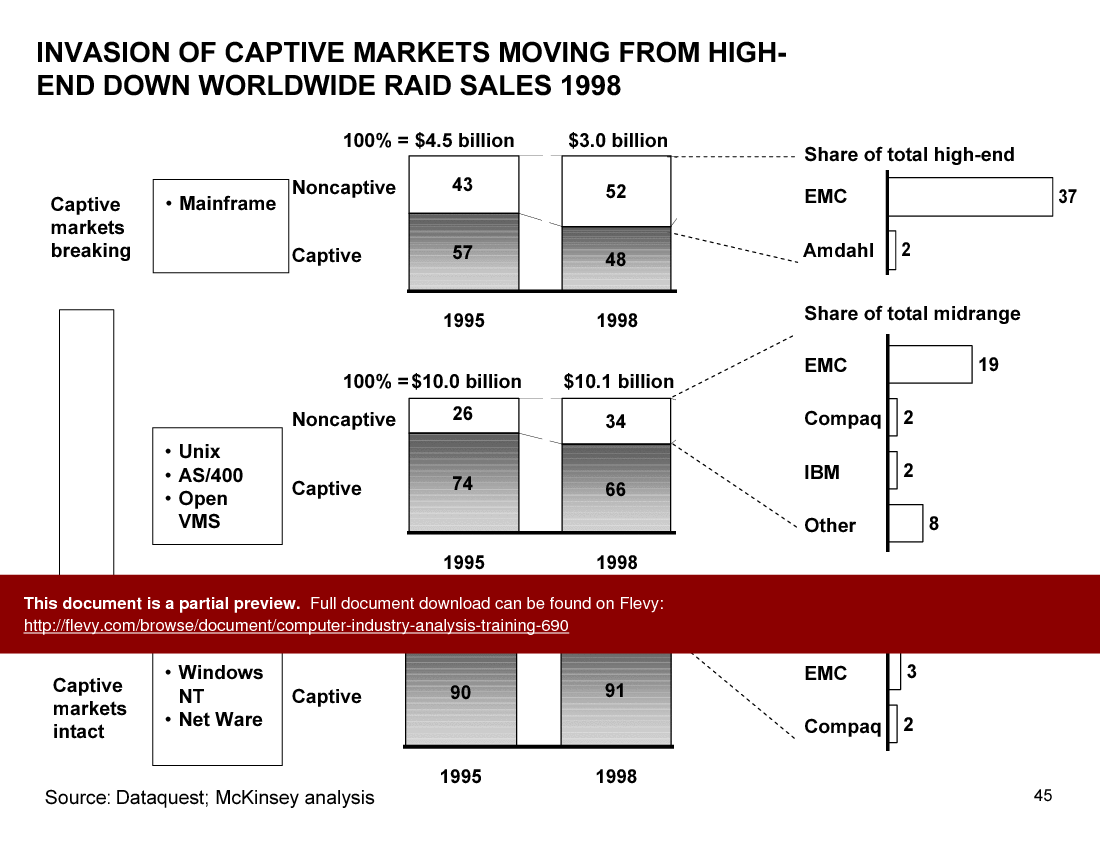
The analysis extends to market segmentation and vendor share, revealing the fragmentation in the PC segment and the dominance of large manufacturers in the server and mainframe markets. It also explores the strategic moves of key players like Gateway, which aims to generate significant profits from services beyond hardware sales. This insight is crucial for executives looking to navigate the competitive landscape.
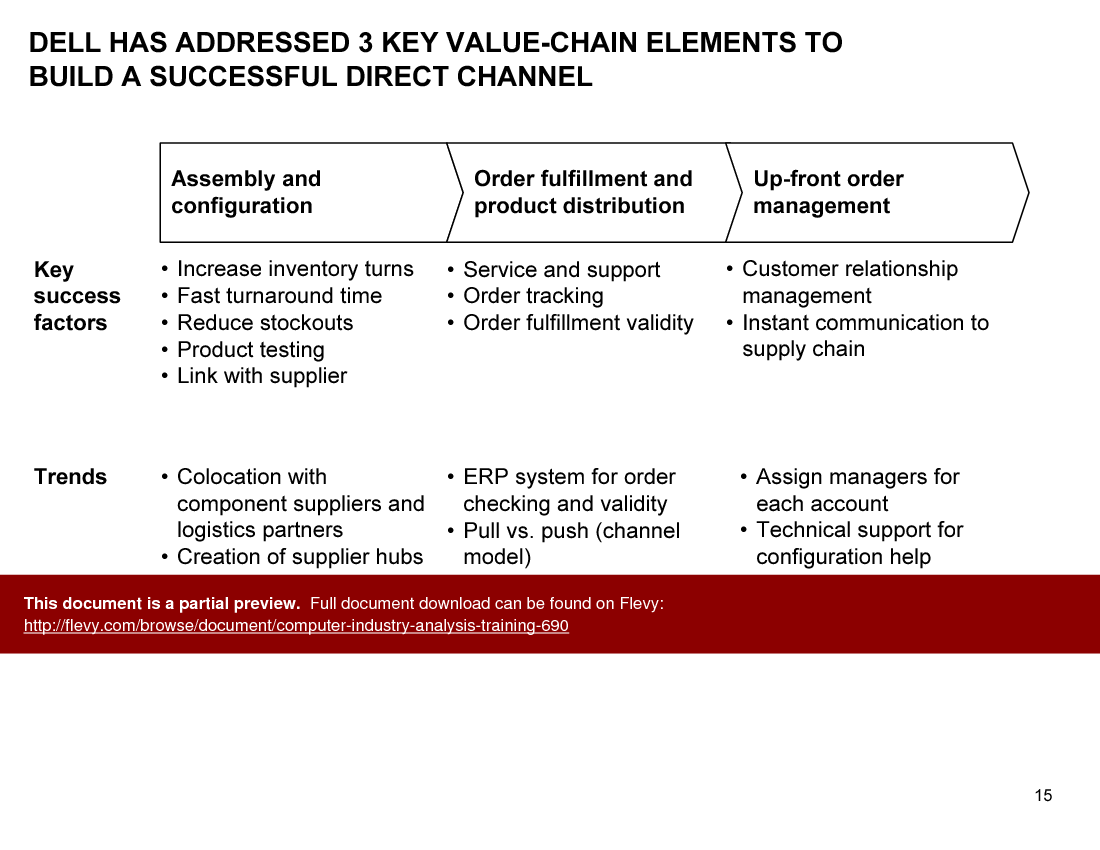
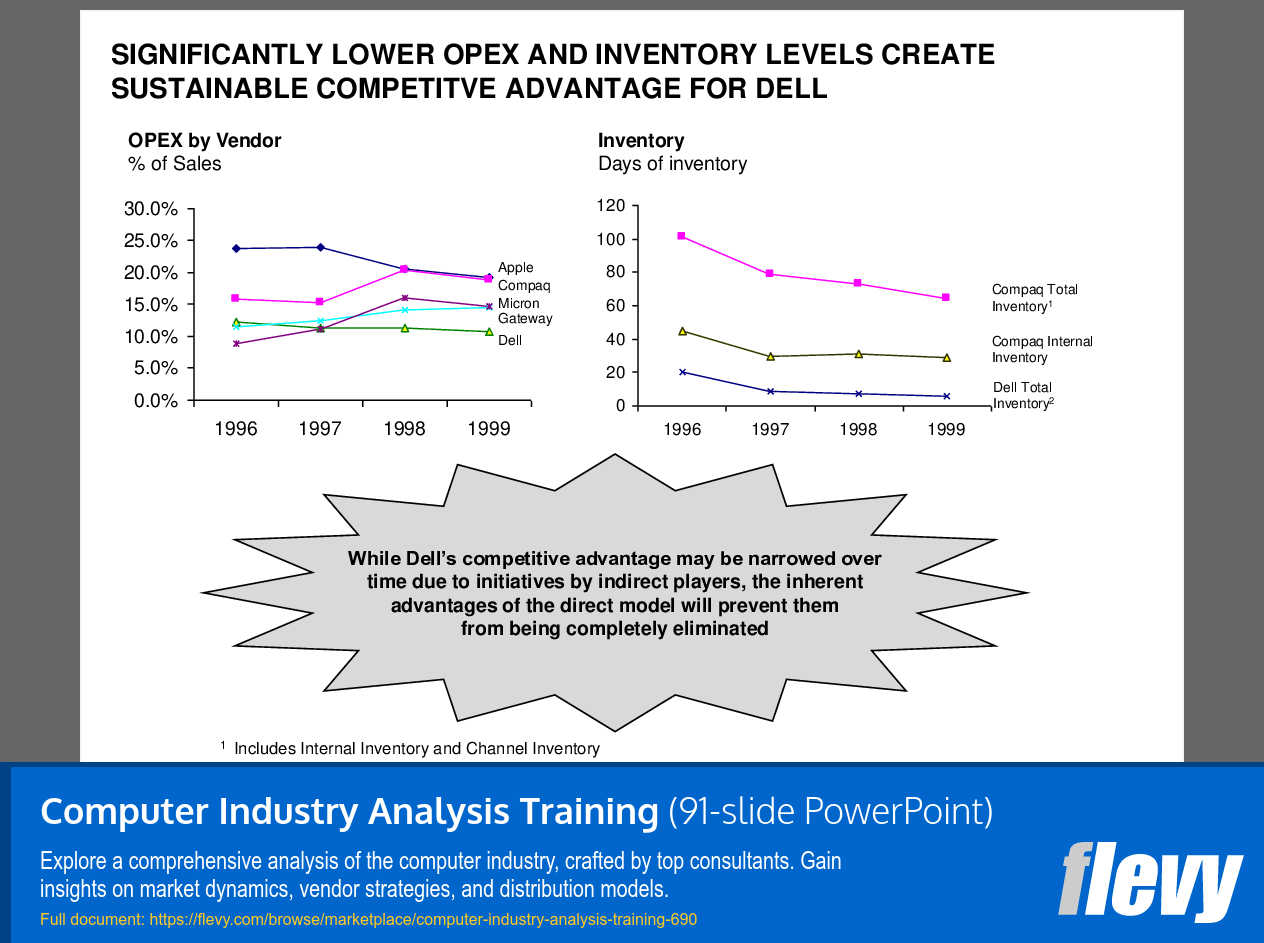
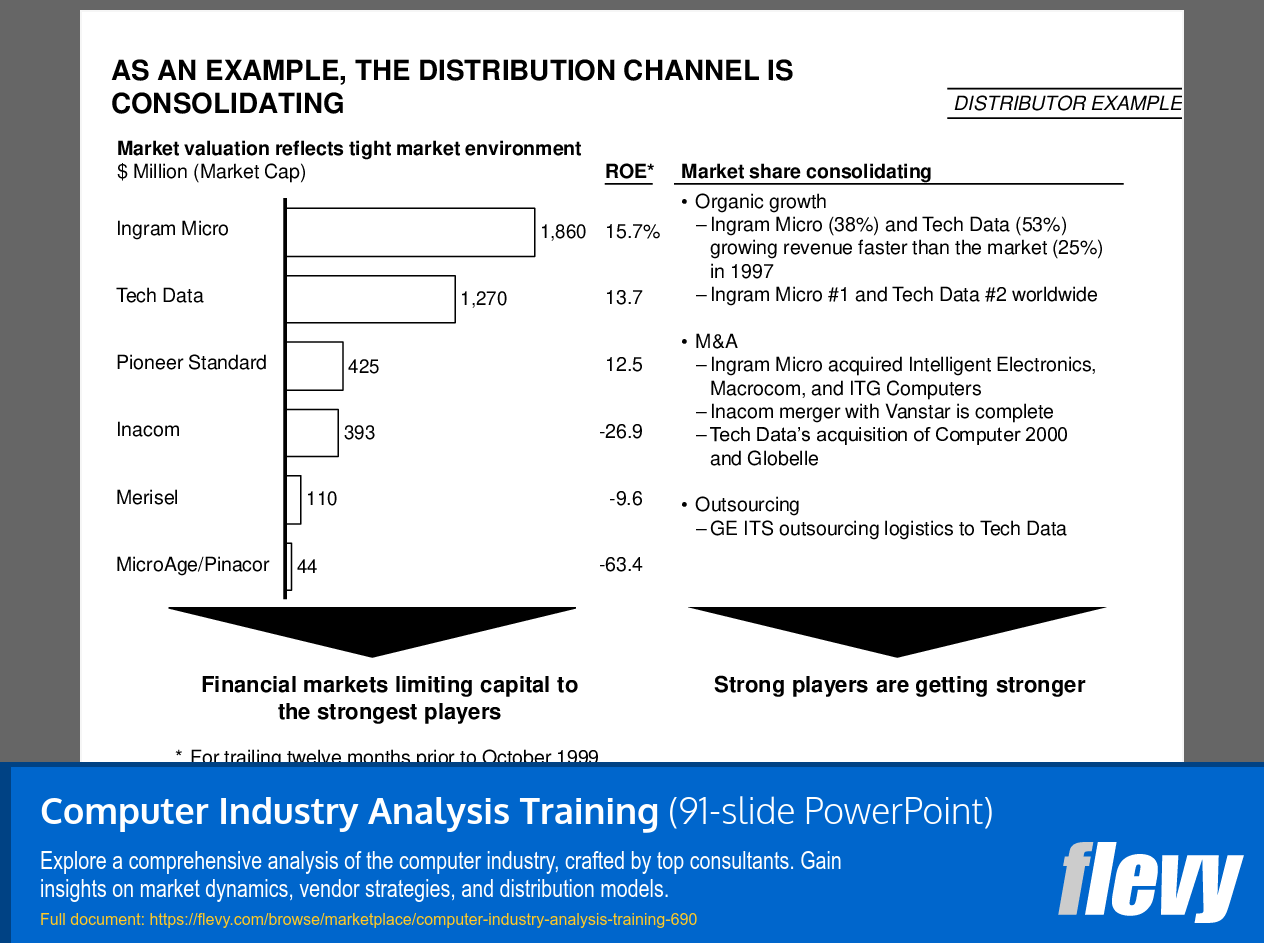
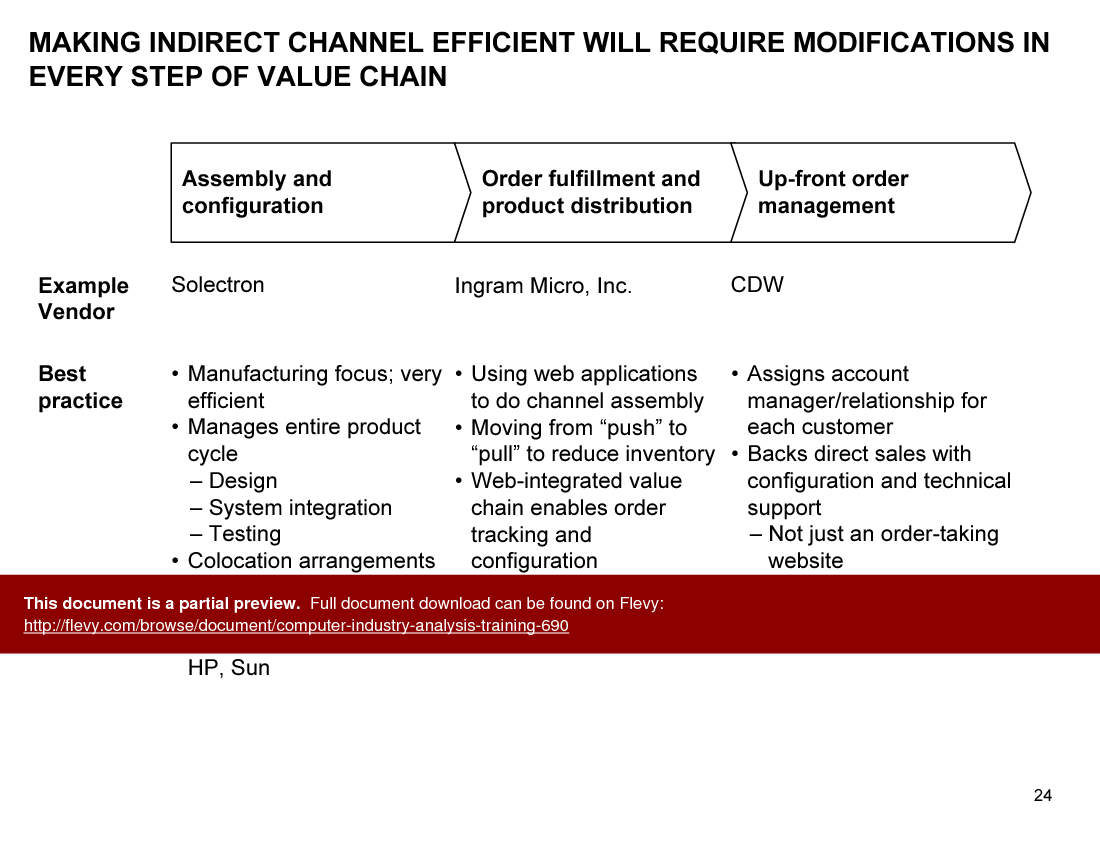
A detailed comparison of indirect versus direct channel economics provides a clear understanding of the cost structures and profit margins associated with different sales strategies. The document outlines Dell's successful approach to building a direct channel, focusing on key value-chain elements such as assembly, order fulfillment, and up-front order management. This case study serves as a benchmark for companies aiming to optimize their distribution channels.
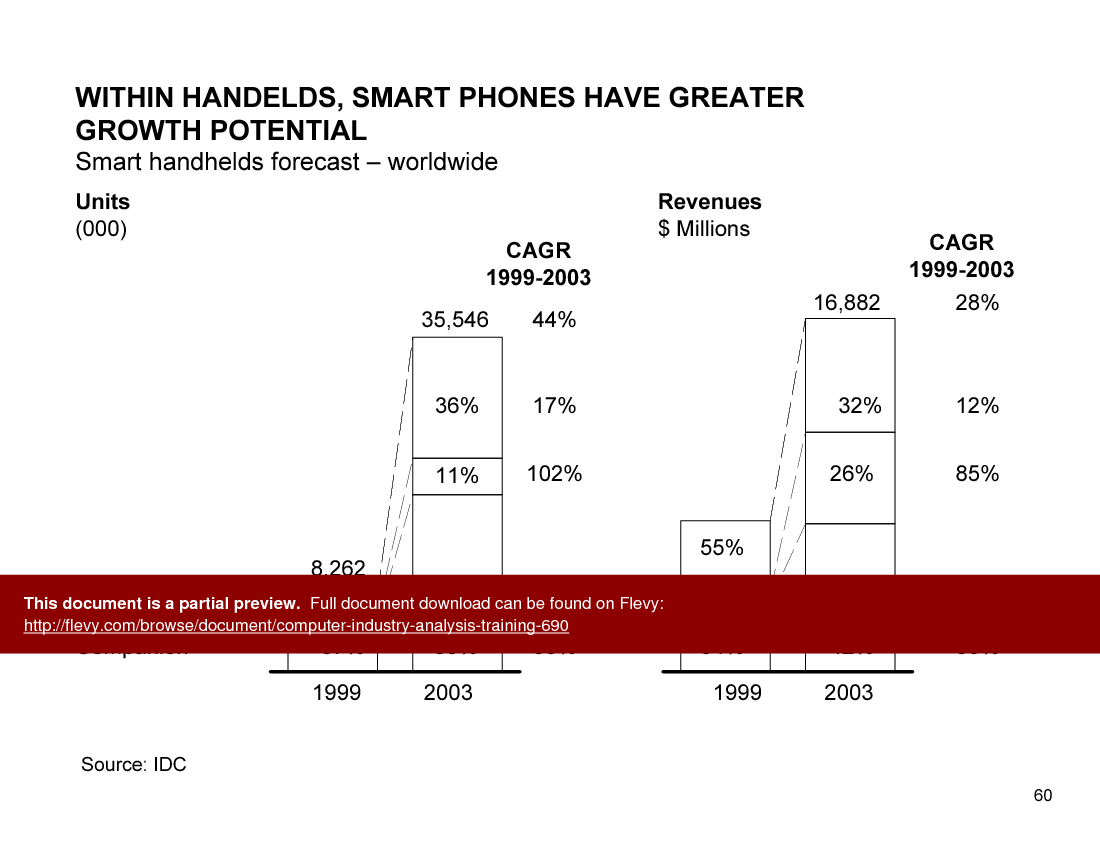
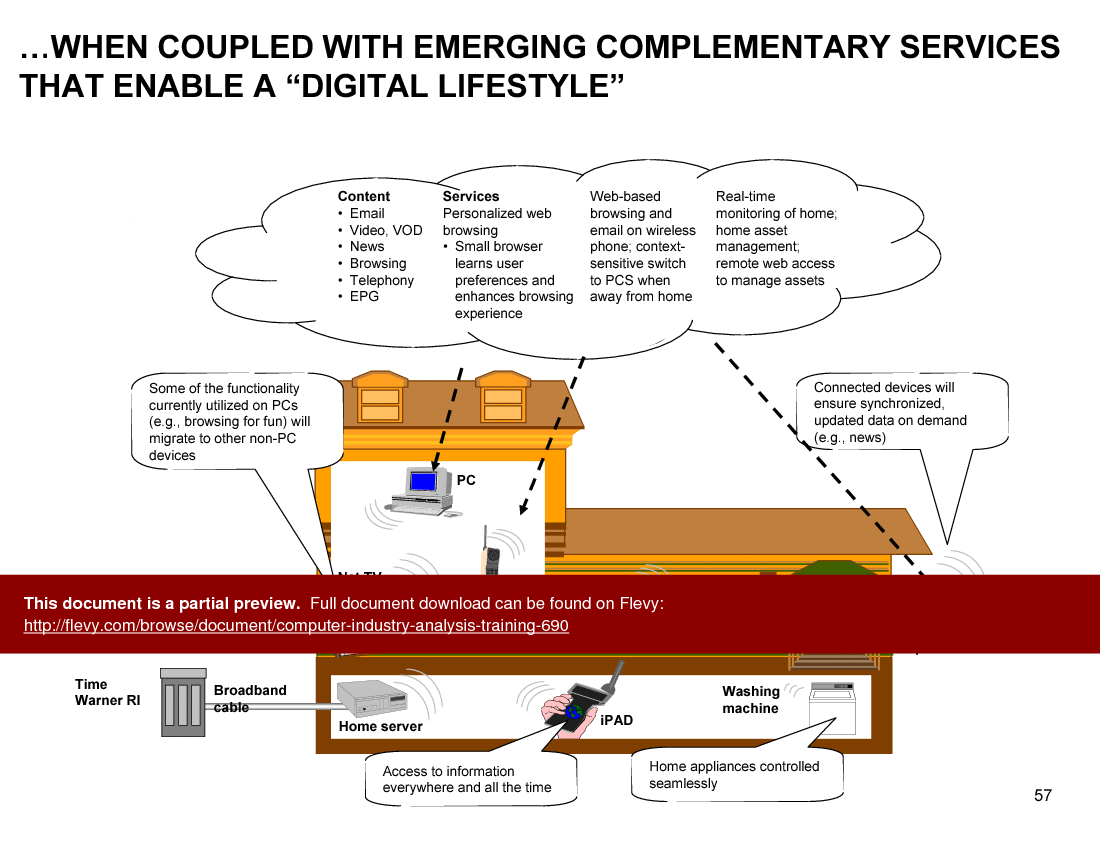
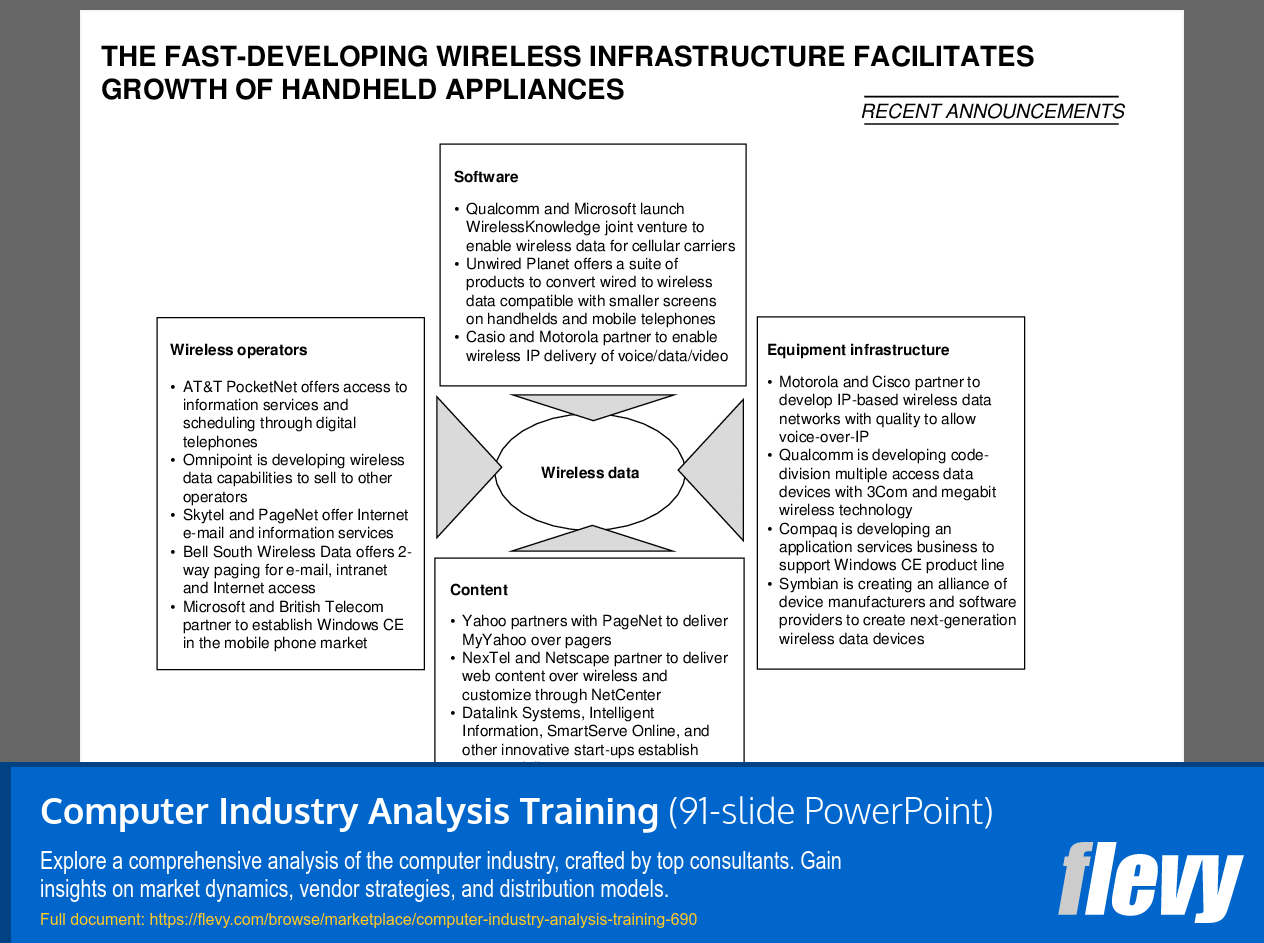
The presentation also addresses the disruptive changes enabling the growth of information appliances and services. It examines new technologies, business models, and consumer behaviors that are driving the deployment of smart devices and personalized services. This forward-looking analysis is essential for executives planning to capitalize on emerging opportunities in the digital lifestyle market.
Got a question about the product? Email us at support@flevy.com or ask the author directly by using the "Ask the Author a Question" form. If you cannot view the preview above this document description, go here to view the large preview instead.
MARCUS OVERVIEW
This synopsis was written by Marcus [?] based on the analysis of the full 91-slide presentation.
Executive Summary
The "Computer Industry Analysis Training" presentation offers a robust examination of the evolving computer industry landscape, emphasizing insights comparable to McKinsey, Bain, or BCG-quality analysis (consulting-grade; not affiliated). This training equips corporate executives, integration leaders, and consultants with the knowledge to navigate market dynamics, vendor strategies, and distribution models. Participants will gain a comprehensive understanding of emerging segments, competitive pressures, and the implications of technological advancements in the computer industry.
Who This Is For and When to Use
• Corporate executives seeking to understand market shifts and competitive dynamics in the computer industry
• Integration leaders responsible for aligning business strategies with evolving technology trends
• Consultants aiming to provide informed recommendations to clients in the tech sector
• Business development teams exploring new revenue opportunities in emerging segments
Best-fit moments to use this deck:
• Strategic planning sessions focused on market entry or expansion in the tech sector
• Workshops aimed at understanding competitive positioning and vendor strategies
• Training programs for teams involved in product development and marketing
Learning Objectives
• Define key trends shaping the computer industry and their implications for business strategy
• Analyze the impact of emerging segments on traditional market players
• Build strategies to leverage new technologies and distribution models for competitive advantage
• Establish frameworks for assessing vendor strategies and market dynamics
• Identify opportunities for profit capture beyond traditional hardware sales
• Evaluate the role of smart handheld devices and information appliances in the evolving landscape
Table of Contents
• Overview of Computer Industry Dynamics (page 1)
• Growth Trends in PCs and Servers (page 3)
• Average Selling Price Trends (page 4)
• Revenue Growth Analysis (page 5)
• Market Segmentation and Vendor Share (page 6)
• Direct vs. Indirect Channel Economics (page 12)
• Dell's Competitive Advantage (page 14)
• Storage Systems and Architectures (page 36)
• Emerging Smart Handhelds and Information Appliances (page 54)
Primary Topics Covered
• Market Dynamics - The computer industry is experiencing robust growth driven by new segments and competitive dynamics, with a focus on capturing profits beyond traditional hardware sales.
• PC and Server Growth - The growth of PCs and servers is influenced by internet expansion and the emergence of application servers, leading to shifts in operating systems like Linux.
• Storage Systems - Storage systems have evolved into a profitable segment, with new architectures such as storage area networks (SAN) impacting related computer segments.
• Smart Handhelds - The rise of smart handheld devices presents new growth opportunities, potentially challenging the Wintel monopoly while shifting value from hardware to services.
• Direct vs. Indirect Sales Channels - The analysis of direct and indirect sales channels highlights the efficiency of direct models and the challenges faced by traditional distribution methods.
• Competitive Strategies - Examination of how companies like Dell have leveraged direct sales models and superior operational efficiencies to capture market share.
Deliverables, Templates, and Tools
• Market analysis framework for assessing competitive dynamics in the computer industry
• Revenue growth model template for evaluating emerging segments
• Comparative analysis tool for direct vs. indirect sales channels
• Strategic planning guide for leveraging new technologies in business development
• Case study examples of successful vendor strategies in the tech sector
• Workshop materials for training teams on market dynamics and competitive positioning
Slide Highlights
• Overview of robust growth trends in PCs and servers, highlighting key statistics and projections
• Analysis of average selling price trends and factors contributing to price declines
• Revenue growth analysis showcasing the disparity between traditional segments and emerging markets
• Insights into the competitive landscape, focusing on market share and vendor strategies
• Case studies illustrating Dell's operational efficiencies and competitive advantages
Potential Workshop Agenda
Market Dynamics Overview (60 minutes)
• Discuss key trends shaping the computer industry
• Analyze the impact of emerging segments on traditional players
• Explore case studies of successful vendor strategies
Competitive Strategies Session (90 minutes)
• Examine direct vs. indirect sales channel economics
• Identify opportunities for profit capture beyond hardware sales
• Develop frameworks for assessing vendor strategies
Emerging Technologies Discussion (60 minutes)
• Evaluate the role of smart handheld devices and information appliances
• Discuss implications of new technologies on business strategy
• Brainstorm potential applications for emerging tech in business development
Customization Guidance
• Tailor market analysis frameworks to specific industry segments or geographic regions
• Adjust revenue growth models based on historical data and future projections relevant to your organization
• Incorporate case studies that reflect your company's competitive landscape and strategic goals
• Modify workshop materials to align with your team's specific training needs and objectives
Secondary Topics Covered
• The role of application servers in driving server growth
• The impact of Linux as a competitive threat to traditional operating systems
• The evolution of storage architectures and their implications for enterprise IT
• Strategies for navigating the commoditization of hardware in the tech sector
• The significance of digital services and content in the information appliance market
FAQ What are the key growth drivers in the computer industry?
The computer industry is driven by emerging segments such as smart handheld devices, storage systems, and application servers, alongside the continued growth of PCs and servers.
How is the competitive landscape changing?
Direct players are increasingly capturing market share from indirect players, leading to a shift in profit centers beyond traditional hardware sales.
What role do storage systems play in the industry?
Storage systems have become a significant and profitable segment, with new architectures like SAN creating opportunities for innovation and competitive differentiation.
How do direct and indirect sales channels compare?
Direct sales channels offer greater efficiency and margin capture, while indirect channels face challenges related to cost structure and market responsiveness.
What are the implications of smart handheld devices?
Smart handheld devices represent a new growth engine, potentially disrupting the Wintel monopoly and shifting value from hardware to services.
How can companies leverage emerging technologies?
Companies can develop strategies that integrate new technologies into their business models, focusing on customer needs and market demands.
What are the challenges faced by traditional vendors?
Traditional vendors must navigate commoditization pressures, declining margins, and the need for operational efficiencies to remain competitive.
What is the significance of digital services in the market?
Digital services are increasingly capturing value in the information appliance market, often surpassing hardware sales in revenue potential.
Glossary
• SAN - Storage Area Network, a dedicated network that provides access to consolidated block-level storage.
• Wintel - A term referring to the dominance of Windows operating systems on Intel hardware.
• CAGR - Compound Annual Growth Rate, a useful measure of growth over multiple time periods.
• OEM - Original Equipment Manufacturer, a company that produces parts or equipment that may be marketed by another manufacturer.
• VAR - Value-Added Reseller, a company that adds features or services to an existing product and resells it.
• ASP - Average Selling Price, the average price at which a product is sold over a specific period.
• Direct Channel - A sales model where products are sold directly to consumers without intermediaries.
• Indirect Channel - A sales model that involves intermediaries, such as distributors and retailers, to reach consumers.
• Information Appliances - Devices designed for specific tasks, such as web browsing or email, that often integrate multiple functionalities.
• Application Servers - Servers designed to host applications and provide services to client devices over a network.
• Commoditization - The process by which goods that are not differentiated become indistinguishable from one another, leading to price competition.
• Smart Handhelds - Portable devices that combine computing capabilities with communication features, such as smartphones and PDAs.
• Market Segmentation - The process of dividing a broad consumer or business market into sub-groups based on shared characteristics.
• Vendor Strategies - The approaches and tactics employed by companies to compete effectively in the market.
• Competitive Dynamics - The ongoing interactions and strategies among firms in a market that influence their performance and market position.
• Direct Sales Model - A business model where products are sold directly to consumers, eliminating intermediaries.
• Indirect Sales Model - A business model where products are sold through intermediaries, such as distributors or retailers.
• Digital Services - Online services that provide value to consumers, often surpassing traditional hardware sales in revenue potential.
• Emerging Segments - New and developing areas within an industry that present opportunities for growth and innovation.
The slide outlines 3 emerging categories of appliances: entertainment, information, and communication. Entertainment appliances enhance user experience through broadband access to audio and video streams, offering services like video on demand and personalized TV options, exemplified by products such as Replay/TiVo and Internet Gaming Stations. Information appliances facilitate downloading news and relevant information, emphasizing local caching and filtering, with services including news, weather, and e-commerce, illustrated by WebPad and E-book. Communication appliances streamline voice, video, and email communication via home gateways, with services like internet telephony and video conferencing, exemplified by Palm 7 and various email appliances. This framework categorizes appliances based on core functionalities, guiding strategic decisions for product development and investment.
This slide presents a comparative analysis of revenue growth in the computer systems sector from 1999 to 2003, revealing a divergence between traditional segments and emerging categories. Overall revenue for computer systems grew from $312 billion in 1999 to $401 billion in 2003, with traditional segments like PCs and servers showing a stagnant compound annual growth rate (CAGR) of 7.0%. In contrast, new segments, including smart handhelds and appliance servers, achieved a higher CAGR of 9.7%, with "Other Appliance servers" demonstrating an extraordinary CAGR of 83.4%. This indicates that innovation in product offerings is a key driver for revenue enhancement, highlighting the necessity for companies to diversify portfolios and invest in emerging technologies to capitalize on growth opportunities.
This slide presents a comparative analysis of 3 storage architectures: Traditional (server-attached storage), Storage Area Network (SAN), and Network Attached Storage (NAS). Traditional storage connects directly to servers, limiting scalability and flexibility, typically using a switch and WAN/Ethernet hubs. SAN employs a Fibre Channel switch, allowing multiple servers to access a shared storage pool, enhancing performance and scalability for high data demands, and managing data across WAN and LAN. NAS connects storage devices directly to a network for easy access and file sharing among users, integrating with routers and switches to facilitate data flow. Each architecture's strengths and weaknesses provide insights for organizations selecting storage solutions based on specific needs and growth projections.
The vertical PDA solutions market shows significant growth in device shipments, rising from 250 thousand units in 1998 to 1,850 thousand units in 2003, reflecting a compound annual growth rate (CAGR) of 65%. Key growth drivers include ERP systems, materials management, sales automation, finance, healthcare, and manufacturing, indicating that these sectors leverage PDA solutions for operational efficiency. The increasing demand for productive mobile solutions is driving PDA adoption in the corporate market. Installed base penetration is projected to rise from 6% in 2003 to 12% in 2005, highlighting anticipated market expansion. This data underscores the investment potential in PDA solutions and the importance of mobility in business operations.
This slide presents a comparative analysis of operational expenditures (OPEX) and inventory levels among key computer industry vendors from 1996 to 1999. The left graph shows OPEX as a percentage of sales for Apple, Compaq, Micron, Gateway, and Dell, with Dell consistently maintaining the lowest OPEX percentage, indicating superior operational efficiency. The right graph illustrates inventory levels in days of inventory, where Dell again demonstrates a favorable position with significantly lower inventory days, suggesting effective inventory management and a responsive supply chain. These operational strategies are crucial for sustaining market presence and profitability in a competitive environment.
The slide outlines emerging applications and technologies driving increased demand for data storage and information management. Key areas include Internet content, e-commerce, and increased bandwidth, indicating a shift towards data-intensive online activities. Wireless services and handheld computing highlight trends in mobile access to information. The rise of electronic books and digital music (MP3) reflects changing content consumption patterns favoring digital formats. Network computing, intranet systems, and electronic appliances demonstrate broader technology integration in business operations. Y2K testing underscores the need for robust data management practices amid technological change. Internet telephony and digital photography further illustrate diverse applications requiring substantial storage capabilities. The interconnectedness of these applications emphasizes the necessity for scalable and efficient storage systems to support future growth.
The evolution of enterprise storage from 1965 to the present is segmented into 4 phases. From 1965 to 1991, storage sales were linked to high-end system sales, creating captive markets dominated by mainframe computing and limiting innovation. The second phase, 1991 to 1996, saw EMC disrupt the market, gaining share and indicating a shift towards open market dynamics while mainframe and Unix systems remained dominant. From 1997 to 2001, distributed computing fueled server-attached storage growth, reflecting a move towards decentralized solutions with Unix and NT systems. The final phase, starting in 2001, focuses on efficient storage solutions in distributed environments, leading to the rise of Storage Area Networks (SAN) that optimize storage efficiency and cater to modern enterprise demands.
This slide presents a comparative analysis of 2 manufacturing models: the current linear model and a proposed one-touch outsourced manufacturing model. The current model involves demand generation, CRM, order taking, product definition, product engineering, board manufacturing, PC assembly, distribution, and configuration, primarily linked to Original Equipment Manufacturers (OEM) and Contract Manufacturers (CM). The one-touch model aims to streamline processes by integrating demand generation and CRM, outsourcing product engineering and board manufacturing to specialized contract manufacturers. This approach enhances efficiency by reducing redundancies and improving coordination among stakeholders. The diagram illustrates a shift towards a more integrated supply chain with co-located contract manufacturers and distributors, potentially leading to faster response times and better market alignment. Key takeaways include improved operational efficiency and leveraging external expertise in manufacturing processes.
This slide presents a strategic framework correlating competitive positioning with strategies in the computer industry, structured as a two-dimensional matrix. The vertical axis represents "Enterprise market power," including market share and reputation, while the horizontal axis outlines various strategic approaches. The "Storage giant" category, featuring EMC, indicates a high competitive position with a "Power play" strategy focused on leveraging enterprise storage market power to dominate the Storage Area Network (SAN) space. "Server companies" like Compaq and IBM occupy a lower competitive position, suggesting a need for adaptation. "Software and connectivity players" should adopt a "No-man's land" strategy, acting as web influencers or fast followers. The "Technology play" section encourages innovation at critical architectural points, emphasizing the importance of maintaining a competitive edge, particularly for those aspiring to be the "Intel" of SAN technology.
This slide outlines a hierarchical framework for industry standards in the computer sector, featuring key organizations like the Internet Engineering Task Force (IETF) and the Storage Networking Industry Association (SNIA). Below SNIA, the Fibre Alliance and StoreX represent significant coalitions focused on specific technologies. Vendor-led initiatives from companies like EMC and Sun indicate that individual vendors influence standards to align with emerging norms. An upward arrow suggests that insights flow from lower tiers to higher levels, highlighting the dynamic interplay among organizations in the standards-setting process. Collaboration among stakeholders is essential for effective standard development and adoption across the industry.
Gateway's strategic approach focuses on diversifying revenue streams through recurring revenue models, with "Gateway Direct Consumer PCs" as the core offering. Gateway operates as both an ISP and portal, aiming to generate subscription-based revenue from users accessing its platform. The partnership with AOL highlights collaboration on non-PC web access devices and broadband initiatives, exploring new revenue opportunities. The mention of the Transmeta chip and Netscape Gecko browser reflects a commitment to emerging technologies. The Verio Alliance expands Gateway's service portfolio with web hosting, DSL services, data storage, and e-commerce, fostering recurring revenue through service subscriptions. A physical retail presence, the "Country store," serves as a sales channel and training facility for small office/home office (Soho) consumers, while financing options enhance product accessibility and sales volume.
This slide analyzes the shift in PC sales channels from 1996 to 1999, highlighting the rise of direct sales from 25% to 36%. This trend indicates a transition in consumer purchasing behavior towards direct transactions over indirect channels, which declined from 75% to 64%. The direct sales channel breakdown shows that direct response sales account for 56% of total direct transactions, while Internet transactions contribute 16%. Indirect sales channels, including dealers and resellers, do not match the growth of direct sales. Businesses must adapt strategies to enhance online presence and optimize direct sales processes, prioritizing direct sales channels to align with evolving consumer preferences.
This slide analyzes the handheld device market, showcasing its growth potential and challenges from commoditization. A bar graph illustrates revenue growth from $6.3 billion in 1999 to $16.9 billion in 2003, with a compound annual growth rate (CAGR) of 28%. This growth is driven by the strategic importance of handheld devices in enterprise settings, particularly for mobile professionals needing server functionality. Conversely, another bar graph reveals a decline in average selling price (ASP) from $761 in 1999 to $475 in 2003, with a CAGR of -11%. This trend indicates increasing competition and low margins, suggesting that while sales volume may rise, profitability is under pressure. The market's intense competition and declining margins pose significant risks for new entrants.
This slide provides an overview of the evolving wireless infrastructure and its impact on handheld appliances, categorized into Wireless Operators, Software, Content, and Equipment Infrastructure. In Wireless Operators, companies like AT&T PocketNet and Omnipoint enhance information access via digital platforms, indicating a trend towards increased connectivity. The partnership between Microsoft and British Telecom to integrate Windows CE into mobile phones reflects the merging of software and hardware. The Software section highlights Qualcomm and Microsoft's collaboration to improve wireless data capabilities for cellular carriers, while Unwired Planet focuses on adapting wired data for smaller screens. Content delivery partnerships, such as Yahoo and PageNet, emphasize the importance of accessible wireless web content. Lastly, the Equipment Infrastructure segment details collaborations like Motorola and Cisco developing advanced wireless networks, with Qualcomm creating multiple access data devices, showcasing the push for efficient wireless technologies.
The slide presents indexed total returns to shareholders for technology companies EMC, Dell, Microsoft, and Intel from December 1989 to the present, with the index set at 1.0 for December 1989. EMC leads in high-end systems, demonstrating significant growth in shareholder returns, particularly in the latter timeline, with a steep upward trajectory that sharply diverges from competitors. Dell shows notable, but lesser growth compared to EMC. Microsoft and Intel exhibit modest increases in shareholder returns, remaining relatively flat, indicating lower value delivery in the high-end systems market. This stark contrast highlights the performance differences among these companies and their strategic positioning.
The slide analyzes declining barriers to mobile data services and the resulting market growth potential, focusing on 3 factors: Devices, Applications, and Networks.
In the "Device" section, it notes the expected proliferation of digital handsets and PDAs by 2002, driven by Moore's Law, enhancing performance and accessibility.
The "Applications" segment highlights the shift to open, Internet-based standards like WAP and WML, facilitating broader application development and operational efficiency for businesses leveraging mobile technology.
In the "Network" category, the evolution of networks to packet-data capability is essential for mobile data services, with technologies like IS95B and GPRS enabling higher bandwidth. The decline in costs democratizes access to mobile data, fueling market growth.
Revenue estimates from 1999 to 2003 indicate a significant increase in end-user services revenue, reflecting rapid evolution in the mobile data market driven by technological advancements and changing user behaviors.
The slide illustrates the consolidation trend in the computer distribution channel, highlighting market valuations and return on equity (ROE) among key players. Ingram Micro leads with a market cap of $1,860 million and a ROE of 15.7%, followed by Tech Data at $1,270 million and a ROE of 13.7%. Other companies like Pioneer Standard and Inacom show lower valuations and negative ROEs, indicating financial struggles. Organic growth drives market share consolidation, with Ingram Micro and Tech Data outperforming overall market growth. Mergers and acquisitions (M&A) enhance their positions, while financial markets favor stronger players, limiting capital access for weaker firms. Outsourcing strategies, such as GE ITS's logistics partnership with Tech Data, further bolster operational efficiency and market presence.
Dell’s core competencies enhance business performance through interconnected elements. "Customer acquisition & retention" is central, supported by operational strengths like "Efficient direct manufacturing & fulfillment," "High reliability," and "Low cost," which foster customer loyalty. Insights such as "Customer insights" and "Accurate demand forecast" are vital for aligning product offerings with market needs. The "Direct customer interface" emphasizes communication for feedback and service enhancement. "Profitable growth" results from this synergy, driving customer satisfaction and financial success. Dell boasts an 83% customer retention rate compared to Compaq's 62%, highlighting the effectiveness of its strategies in building long-term relationships.
The slide presents a market segmentation analysis of the PC landscape based on 1998 data, detailing revenue distribution among vendors across server categories: mainframes, midrange servers, entry-level servers, consumer PCs, and commercial PCs. IBM leads the mainframe category with a revenue share of $47 billion, followed by HP, Unisys, and Fujitsu. In midrange servers, IBM and HP dominate, with contributions from Sun and Compaq. Compaq holds the largest share in entry-level servers at $30 billion, followed by Dell and HP. The consumer PC segment features Compaq and Packard Bell, alongside significant white box system presence, indicating a trend toward commoditization. The commercial PC segment mirrors this landscape. The analysis highlights the dominance of large manufacturers while illustrating the increasing significance of unbranded systems in the PC market.
Source: Best Practices in Strategic Plan Example, Industry Analysis, Environmental Analysis PowerPoint Slides: Computer Industry Analysis Training PowerPoint (PPT) Presentation Slide Deck, Documents & Files
The average daily rate of a McKinsey consultant is $6,625 (not including expenses). The average price of a Flevy document is $65.
Trusted by over 10,000+ Client Organizations
Since 2012, we have provided best practices to over 10,000 businesses and organizations of all sizes, from startups and small businesses to the Fortune 100, in over 130 countries.
"If you are looking for great resources to save time with your business presentations, Flevy is truly a value-added resource. Flevy has done all the work for you and we will continue to utilize Flevy as a source to extract up-to-date information and data for our virtual and onsite presentations!"
– Debbi Saffo, President at The NiKhar Group
"As a consultant requiring up to date and professional material that will be of value and use to my clients, I find Flevy a very reliable resource.
The variety and quality of material available through Flevy offers a very useful and commanding source for information. Using Flevy saves me time, enhances my expertise and ends up being a good decision."
– Dennis Gershowitz, Principal at DG Associates
"Flevy is our 'go to' resource for management material, at an affordable cost. The Flevy library is comprehensive and the content deep, and typically provides a great foundation for us to further develop and tailor our own service offer."
– Chris McCann, Founder at Resilient.World
"As a niche strategic consulting firm, Flevy and FlevyPro frameworks and documents are an on-going reference to help us structure our findings and recommendations to our clients as well as improve their clarity, strength, and visual power. For us, it is an invaluable resource to increase our impact and value."
– David Coloma, Consulting Area Manager at Cynertia Consulting
"The wide selection of frameworks is very useful to me as an independent consultant. In fact, it rivals what I had at my disposal at Big 4 Consulting firms in terms of efficacy and organization."
– Julia T., Consulting Firm Owner (Former Manager at Deloitte and Capgemini)
"FlevyPro provides business frameworks from many of the global giants in management consulting that allow you to provide best in class solutions for your clients."
– David Harris, Managing Director at Futures Strategy
"As an Independent Management Consultant, I find Flevy to add great value as a source of best practices, templates and information on new trends. Flevy has matured and the quality and quantity of the library is excellent. Lastly the price charged is reasonable, creating a win-win value for
the customer, Flevy and the various authors. This is truly a service that benefits the consulting industry and associated clients. Thanks for providing this service.
"
– Jim Schoen, Principal at FRC Group
"[Flevy] produces some great work that has been/continues to be of immense help not only to myself, but as I seek to provide professional services to my clients, it gives me a large "tool box" of resources that are critical to provide them with the quality of service and outcomes they are expecting."
– Royston Knowles, Executive with 50+ Years of Board Level Experience
Download our free compilation of 50+ Strategy & Transformation slides and templates. Frameworks include McKinsey 7-S, Balanced Scorecard, Disruptive Innovation, BCG Curve, and many more.