
Balanced Scorecard Dashboard – Excel XLSX
Excel (XLSX)
BENEFITS OF THIS DOWNLOADABLE EXCEL DOCUMENT
- Balanced Scorecard
- Full Business Overview
- Performance Management
BALANCED SCORECARD EXCEL DESCRIPTION
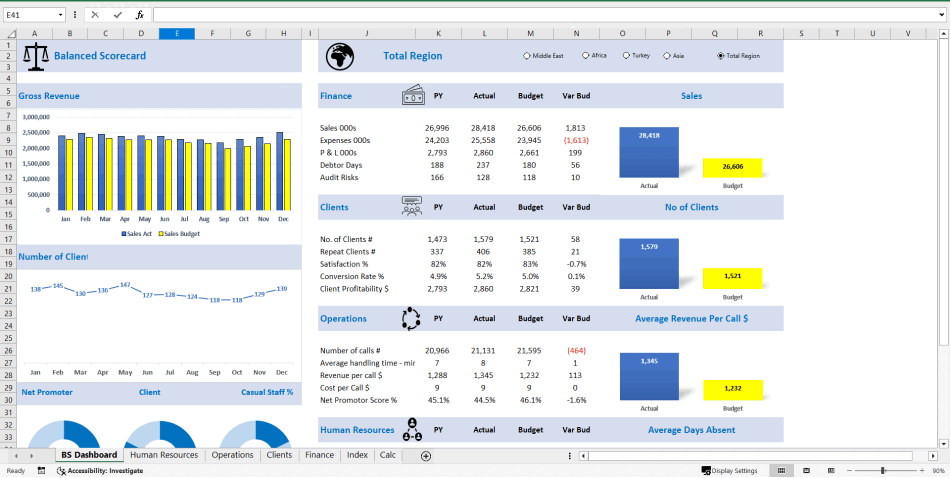
Balance Scorecard Dashboard – Get full control over your business covering all the typical core areas of your business: Finance, Operations, Human Resources & most importantly your Clients.
This dashboard includes the capability of regions as well – Up to four regions and be able to see a total as well for all regions combined. Not only are your able to view key statistics and performances per Region to have full control over that Region but a combined view of all Regions also allows to see how the total regions are doing as a collective.
View key items per section as below:
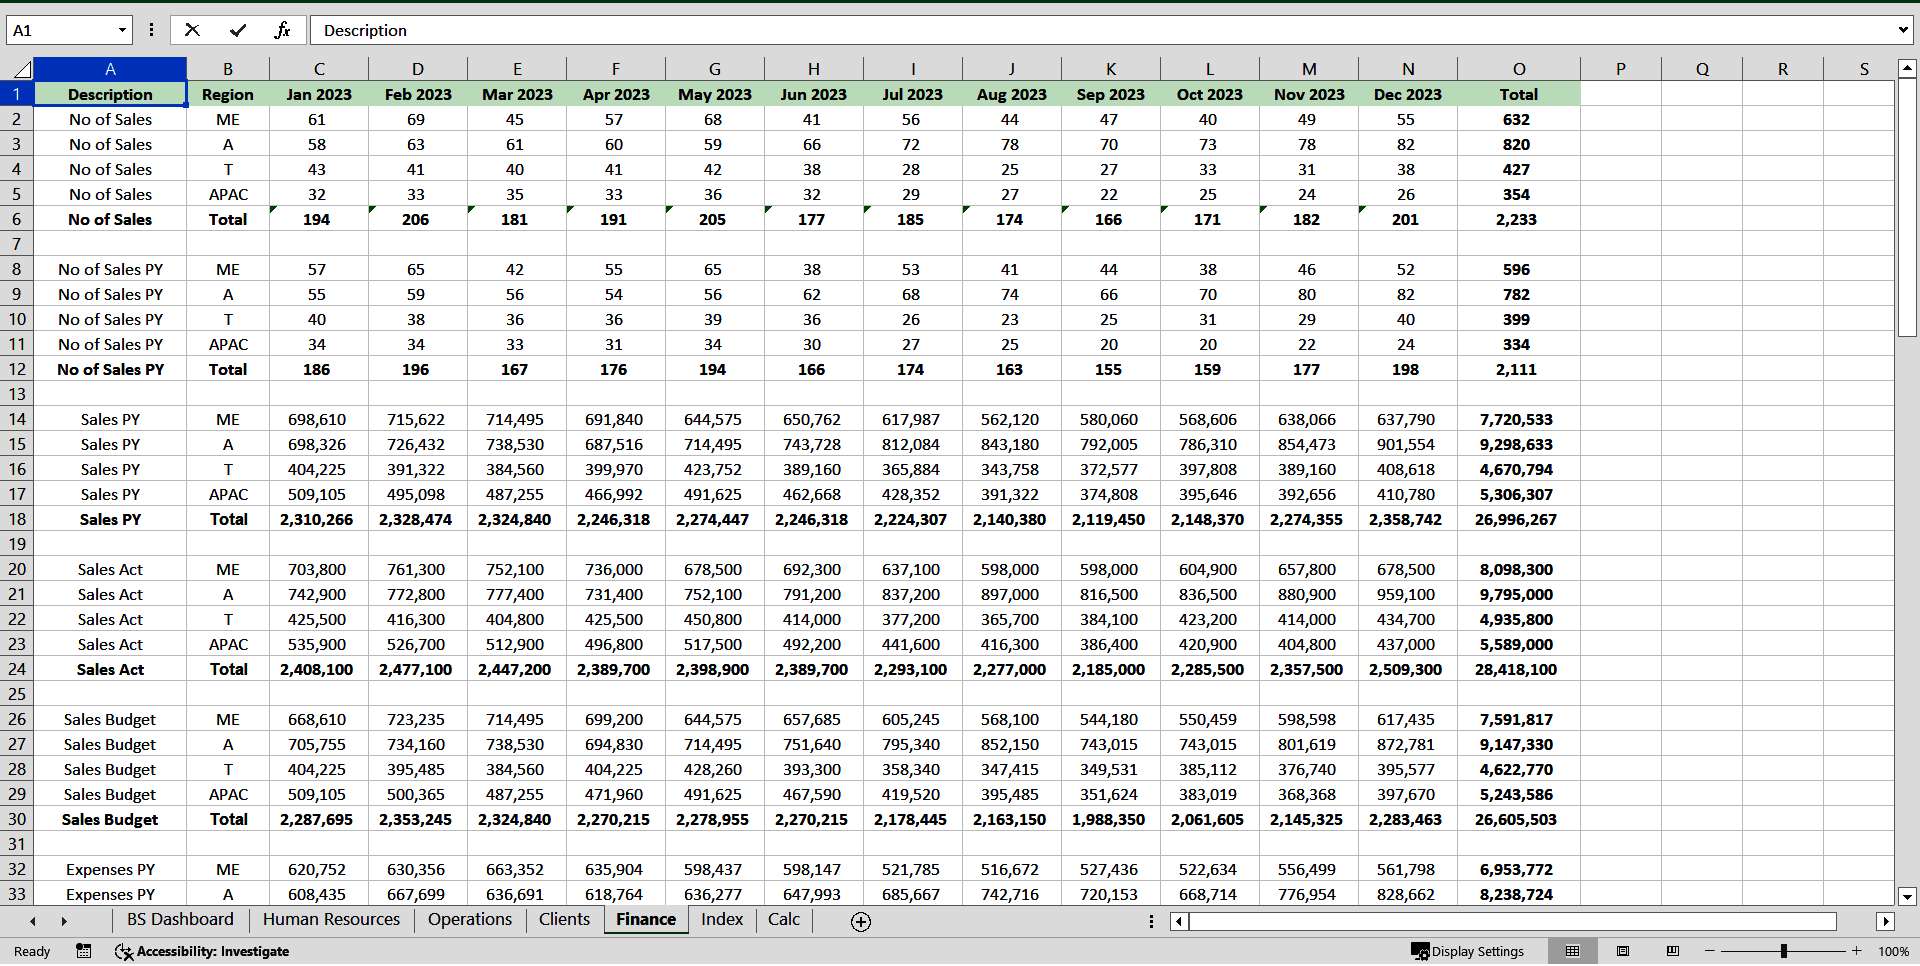
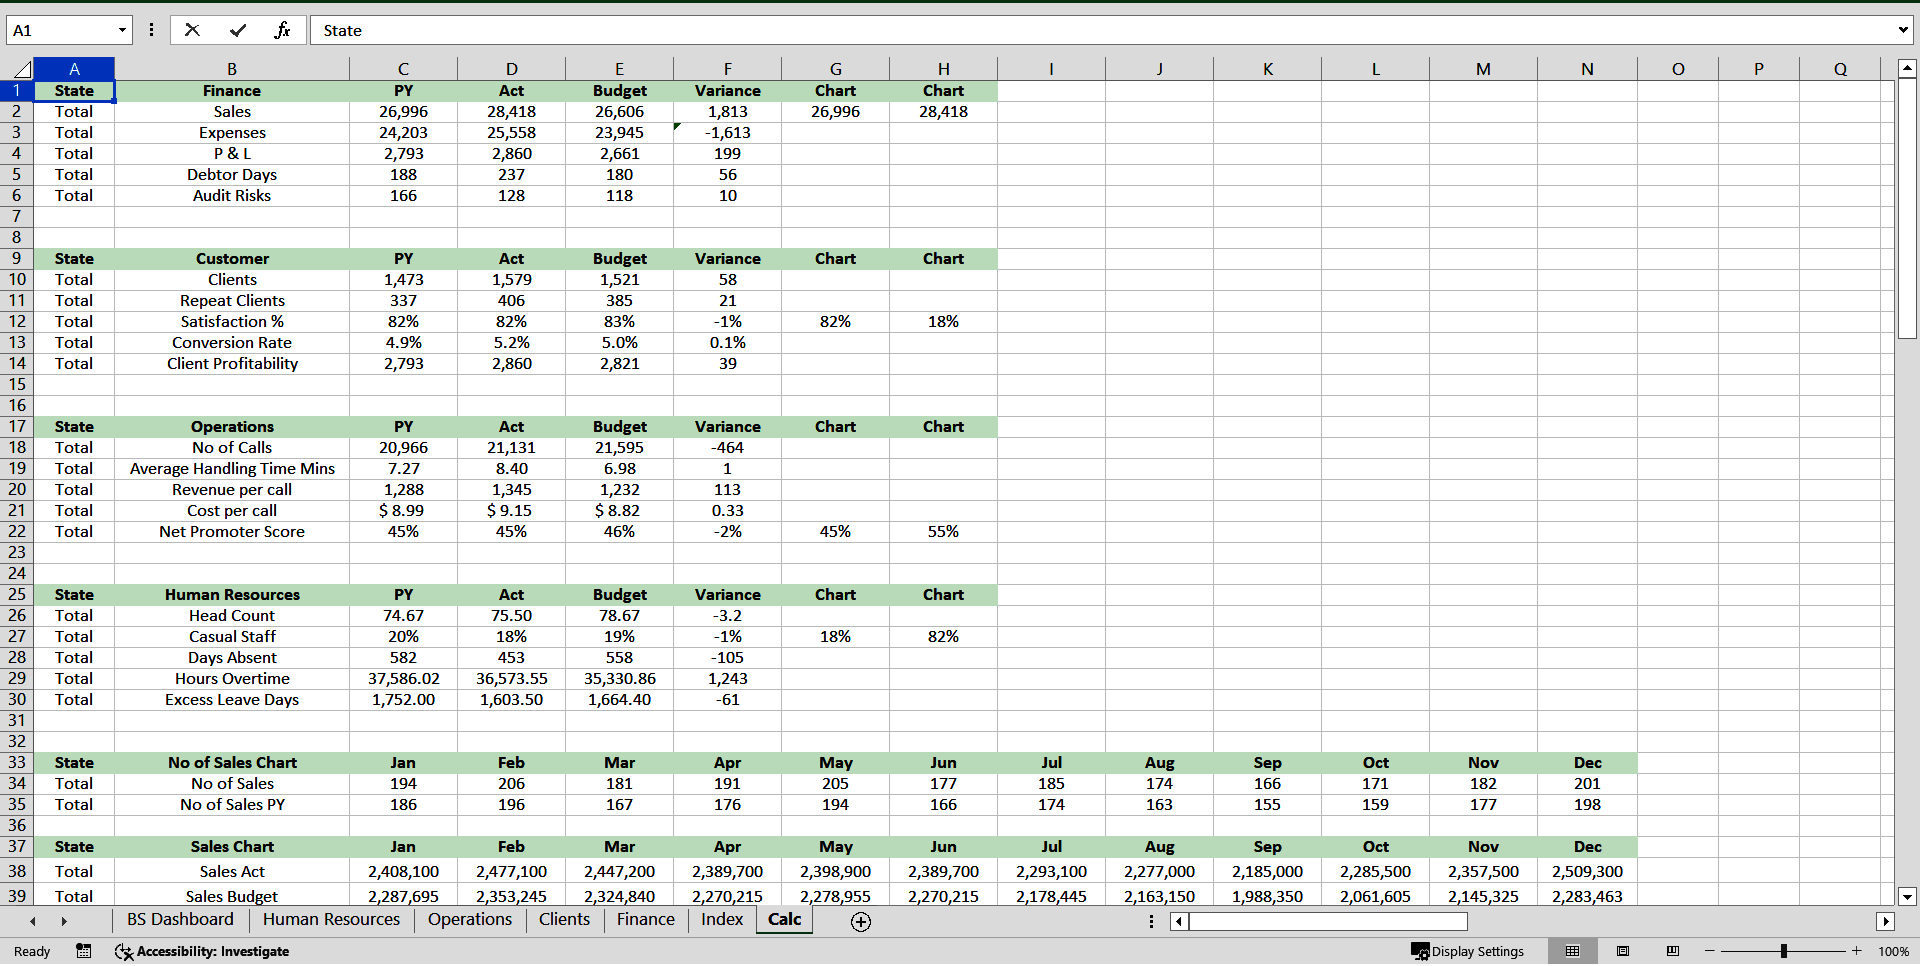
Finance:
Sales
Expenses
Profit and loss
Debtor days
Audit risks
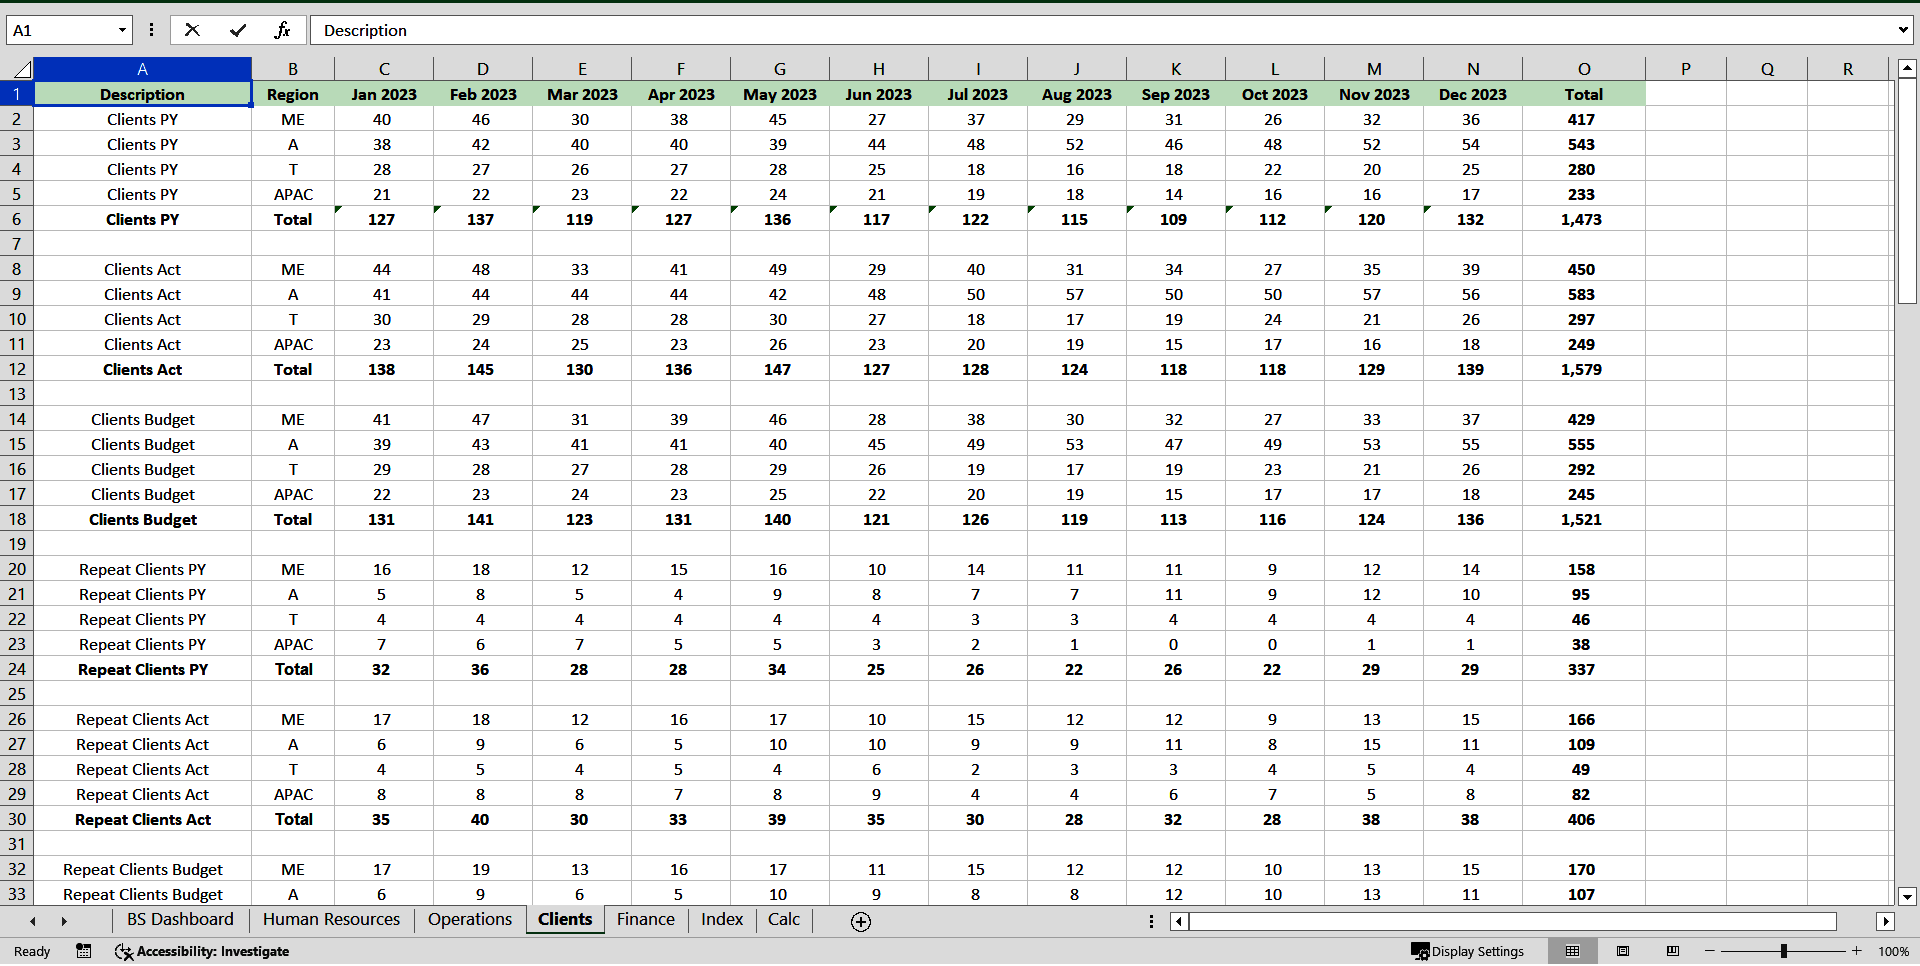
Clients:
Number of clients
Repeat clients
Satisfaction percentage
Conversion rate percentage
Client profitability
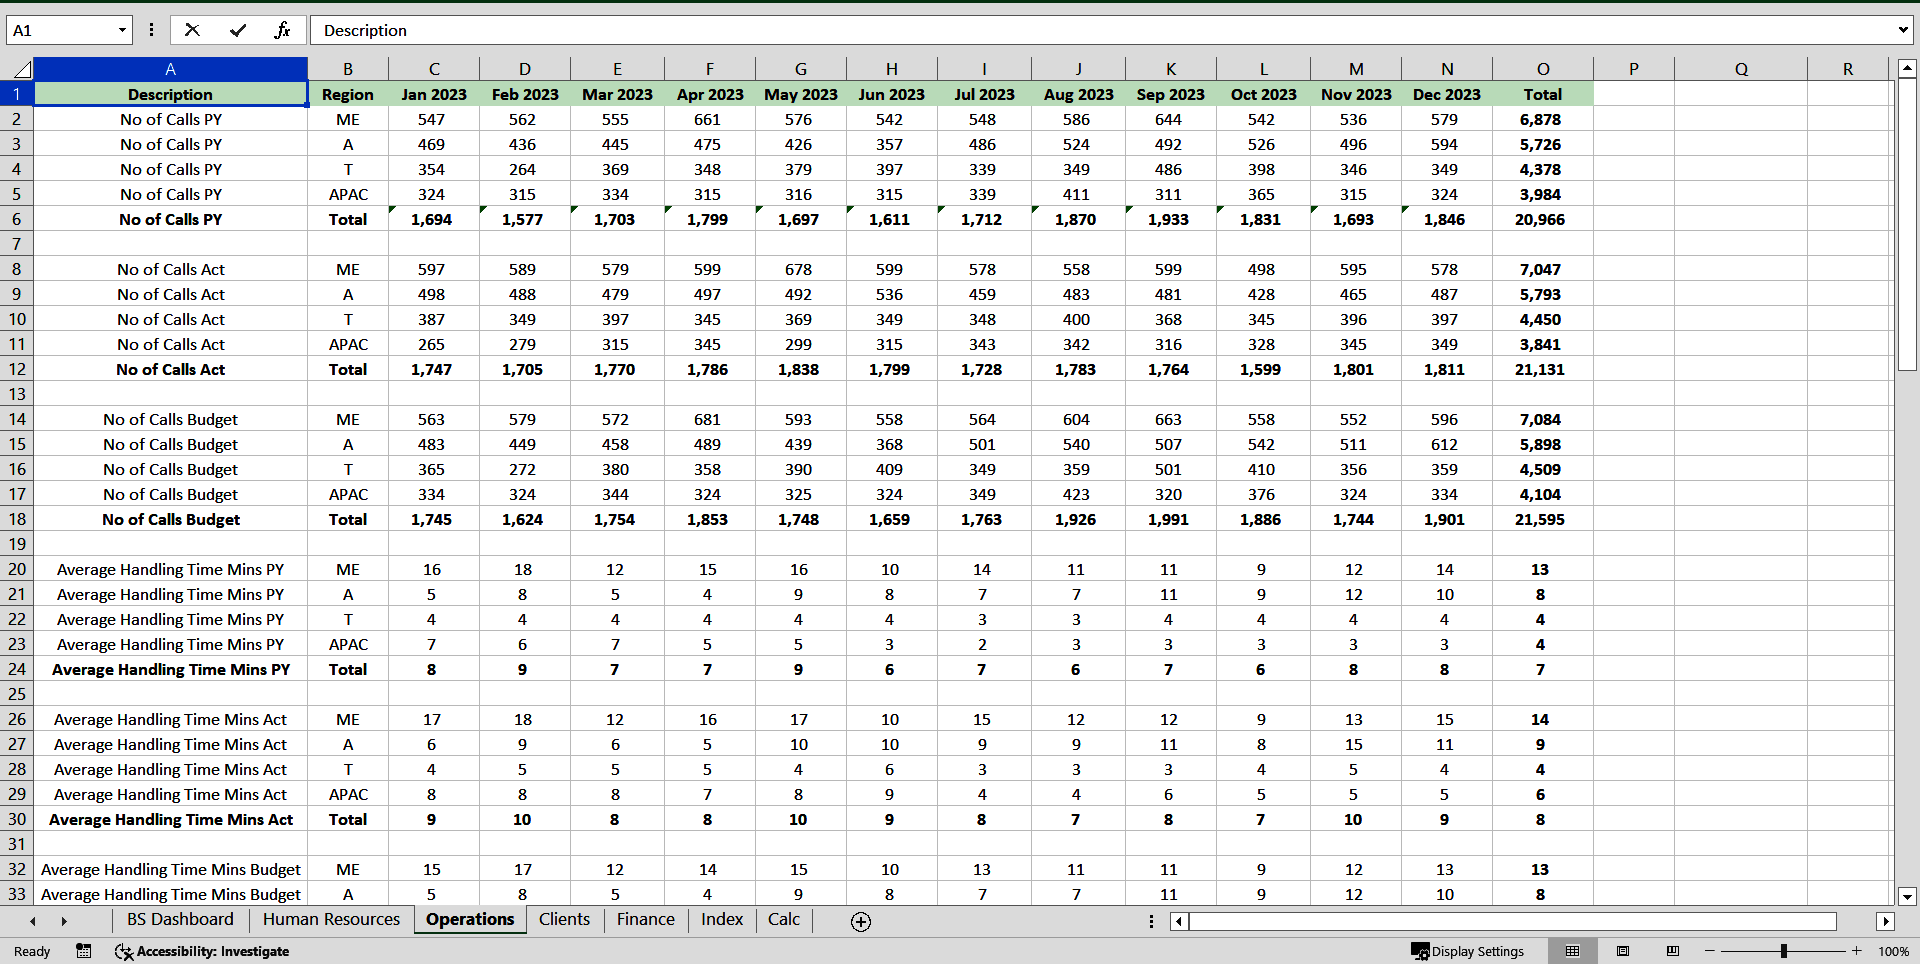
Operations:
Number of calls
Average handling time
Revenue per call
Cost per call
Net promoter score percentage
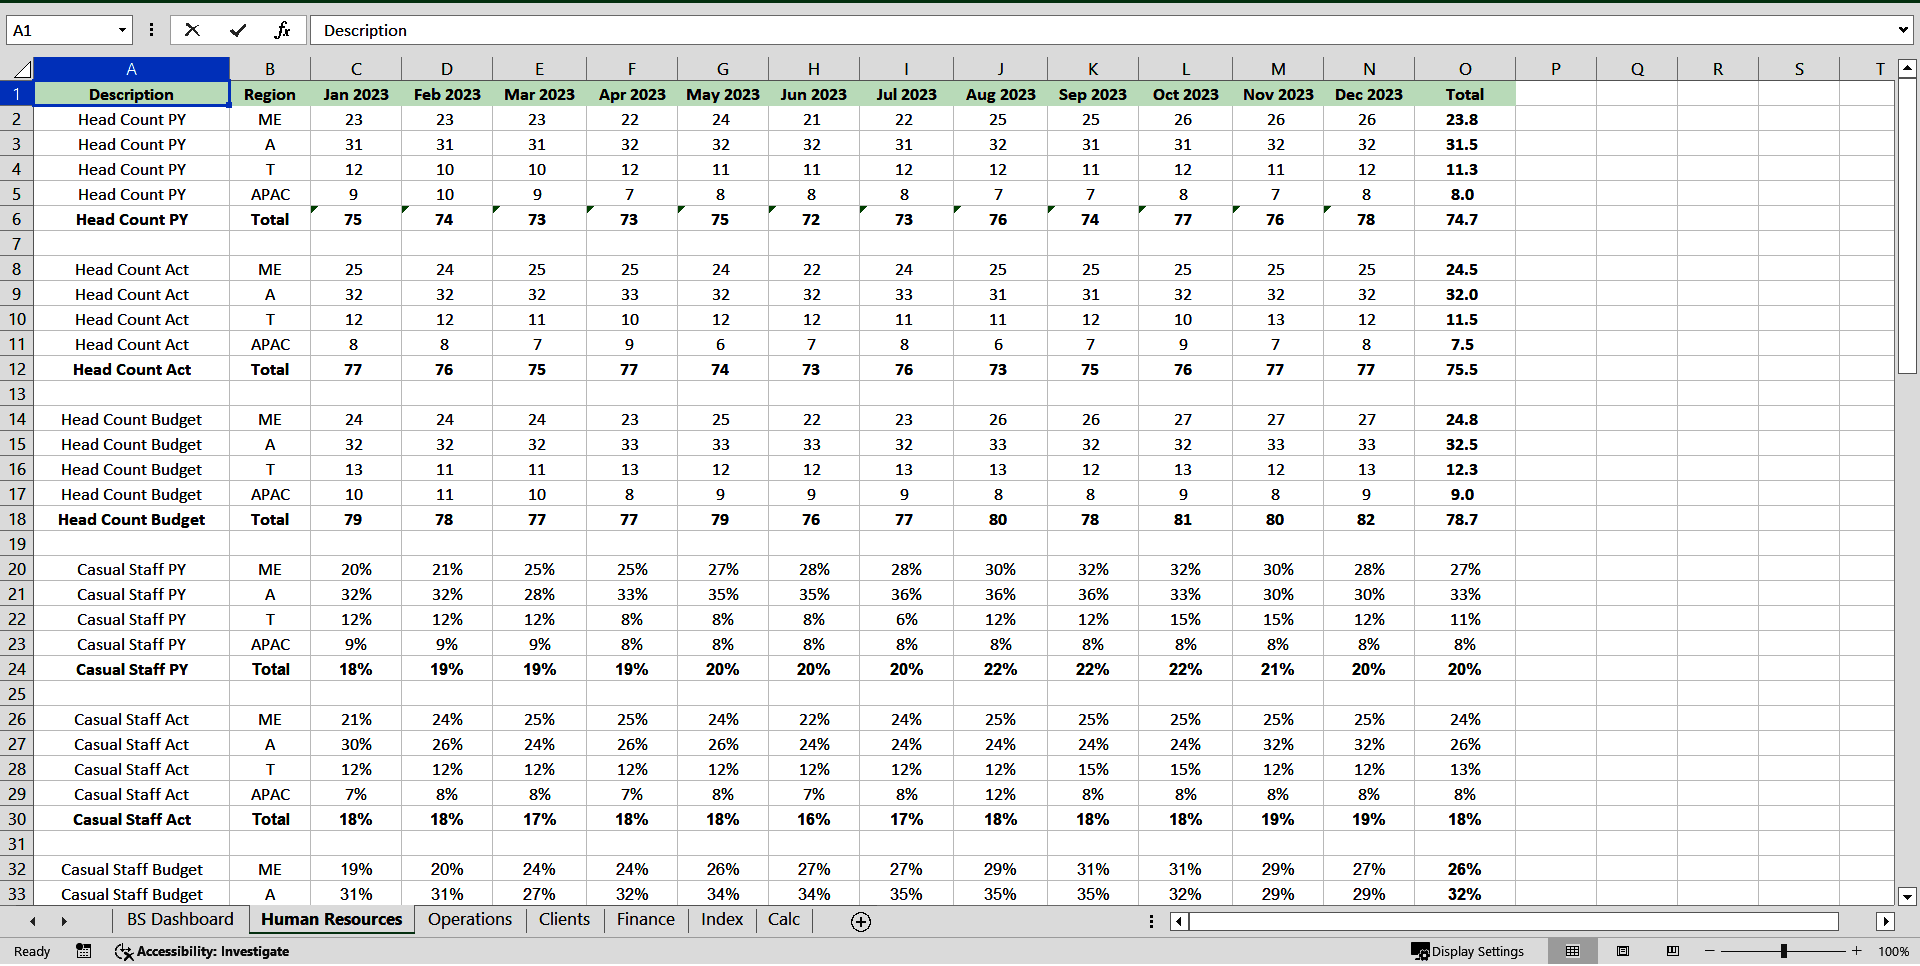
Human resources:
Headcount
Casual Staff percentage
Days absent
Hours overtime
Excess leave days
View interactive graphs covering the below per region or a combined total:
Gross revenue
Number of clients
Net promoter score
Client satisfaction
Casual staff percentage
Sit back and get total control over your global business. Track performances monthly to aid in key decision making. View and make decisions to improve performances per Region which in turn will help boost performance of your Global company.
The dashboard is simple to use and easy to update. It also includes PY, Actuals and Budget comparisons.
Balance Scorecard Dashboard – Get full control over your business covering all the typical core areas of your business: Finance, Operations, Human Resources & most importantly your Clients
This dashboard includes the capability of regions as well – Up to four regions and be able to see a total as well for all regions combined. Not only are your able to view key statistics and performances per Region to have full control over that Region but a combined view of all Regions also allows to see how the total regions are doing as a collective.
View key items per section as below:
Finance:
Sales
Expenses
Profit and loss
Debtor days
Audit risks
Clients:
Number of clients
Repeat clients
Satisfaction percentage
Conversion rate percentage
Client profitability
Operations:
Number of calls
Average handling time
Revenue per call
Cost per call
Net promoter score percentage
Human resources:
Headcount
Casual Staff percentage
Days absent
Hours overtime
Excess leave days
View interactive graphs covering the below per region or a combined total:
Gross revenue
Number of clients
Net promoter score
Client satisfaction
Casual staff percentage
Sit back and get total control over your global business. Track performances monthly to aid in key decision making. View and make decisions to improve performances per Region which in turn will help boost performance of your Global company.
The dashboard is simple to use and easy to update. It also includes PY, Actuals and Budget comparisons.
Got a question about the product? Email us at support@flevy.com or ask the author directly by using the "Ask the Author a Question" form. If you cannot view the preview above this document description, go here to view the large preview instead.
Source: Best Practices in Balanced Scorecard Excel: Balanced Scorecard Dashboard Excel (XLSX) Spreadsheet, Excel Templates & Dashboards
ABOUT THE AUTHOR
Finance Leader
Over 15 years Experience
Qualified Finance Professional
Ask the Author a Question
You must be logged in to contact the author.
