
Automotive Manufacturer 10-Year 3 Statement Financial Model – Excel XLSX
Excel (XLSX)
BENEFITS OF THIS DOWNLOADABLE EXCEL DOCUMENT
- Provides a structured framework for building a production-driven Automotive Manufacturing Financial Model tailored to your plant capacity, vehicle mix, and capital structure.
- Delivers an institutional-grade 3-statement forecasting system designed specifically for automotive manufacturers, EV startups, and industry operators.
- Equips you with a comprehensive 10-year financial planning model that aligns operational production economics with investor- and lender-ready financial statements.
MANUFACTURING EXCEL DESCRIPTION
Curated by McKinsey-trained Executives
🚗 Automotive Manufacturing Financial Model – 10-Year Excel Forecast | 3-Statement Model | Auto Industry Financial Planning
The only Excel financial model built specifically for automotive manufacturers, EV startups, and auto industry operators – 1,300+ verified formulas, 12 fully linked worksheets, zero broken links.
Stop paying $30,000 for a consultant to build what you can own, reuse, and update forever.
🔥 What You Get
A fully integrated, institutional-grade automotive manufacturing financial model – built from the factory floor up. Not a generic manufacturing template. Not a revenue-times-growth-rate spreadsheet. A complete, production-driven, 10-year financial modeling system that PE acquirers, project finance banks, and infrastructure funds actually want to see.
✅ 12 Fully Linked Excel Worksheets
✅ 1,300+ Active, Verified Excel Formulas
✅ 10-Year Annual Forecast (Year 1 – Year 10)
✅ Complete 3-Statement Model: Income Statement, Balance Sheet & Cash Flow
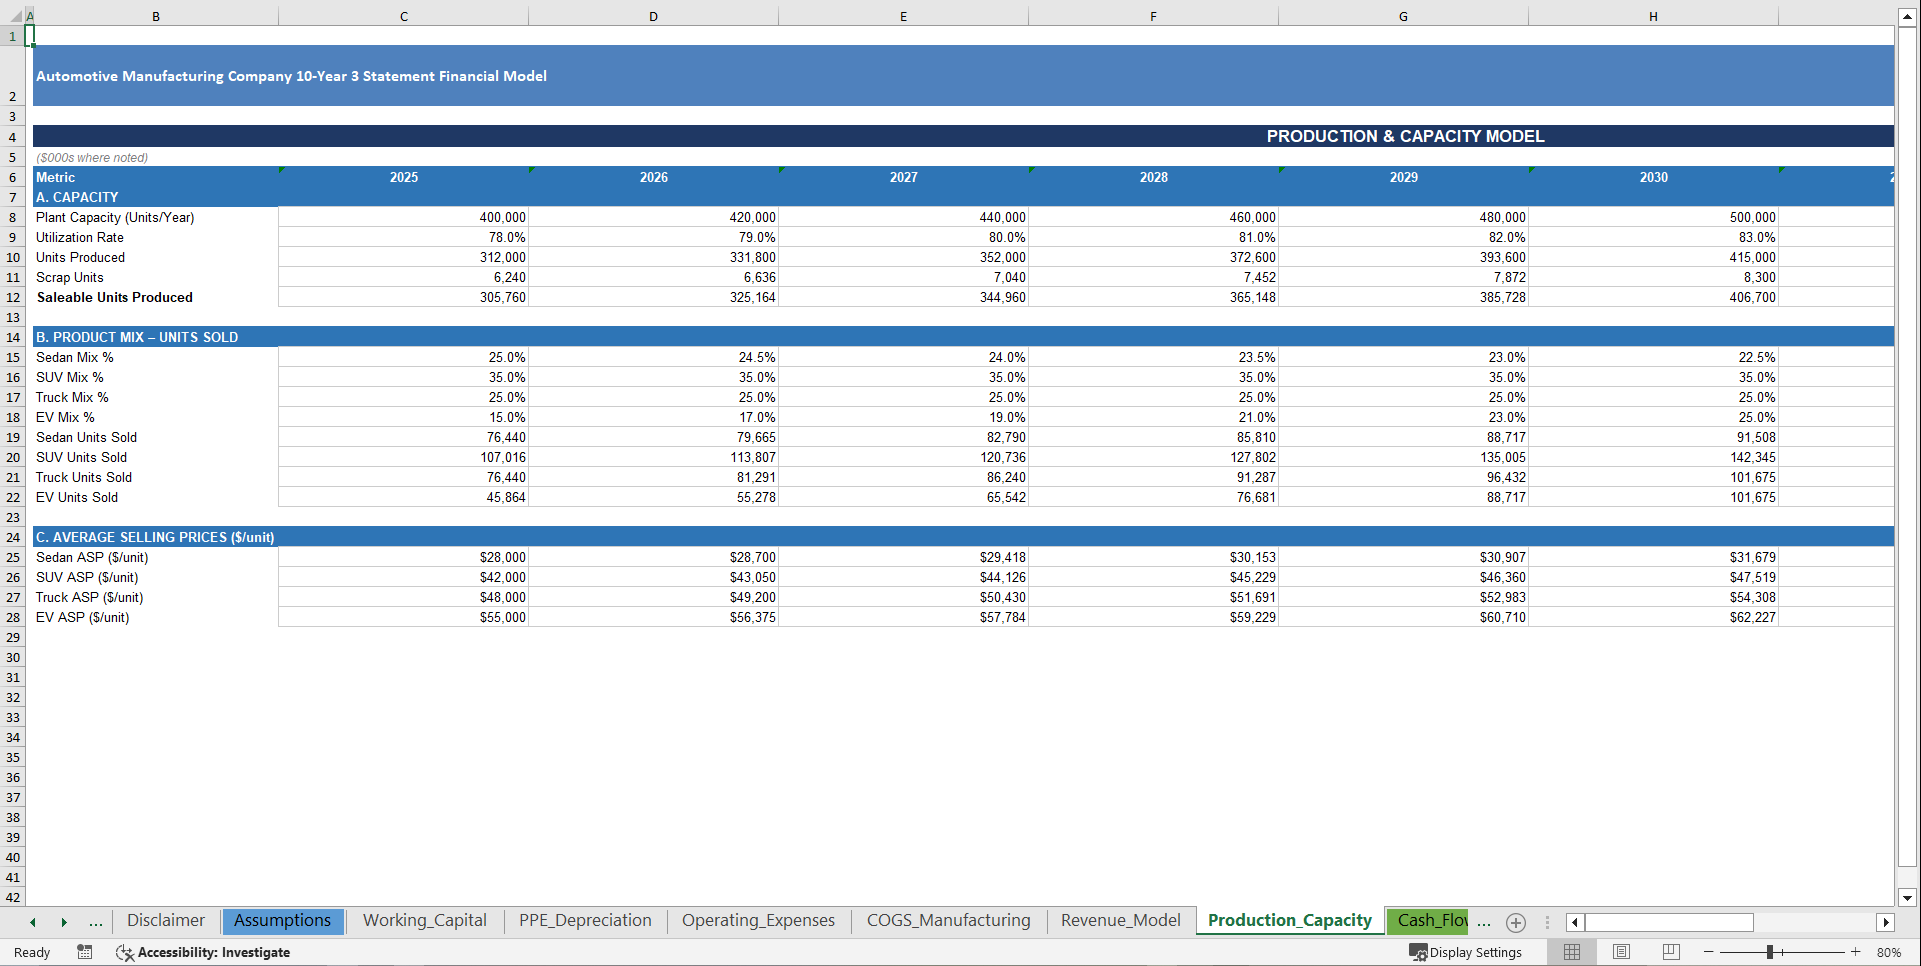
✅ Production Capacity & Plant Utilization Model – Revenue Built from Units, Not Guesses
✅ 4 Vehicle Segment Revenue Streams: Sedan, SUV, Truck & EV – Each Modeled Separately
✅ Full BOM-Driven COGS: Raw Materials, Direct Labor, Overhead, Freight & Warranty
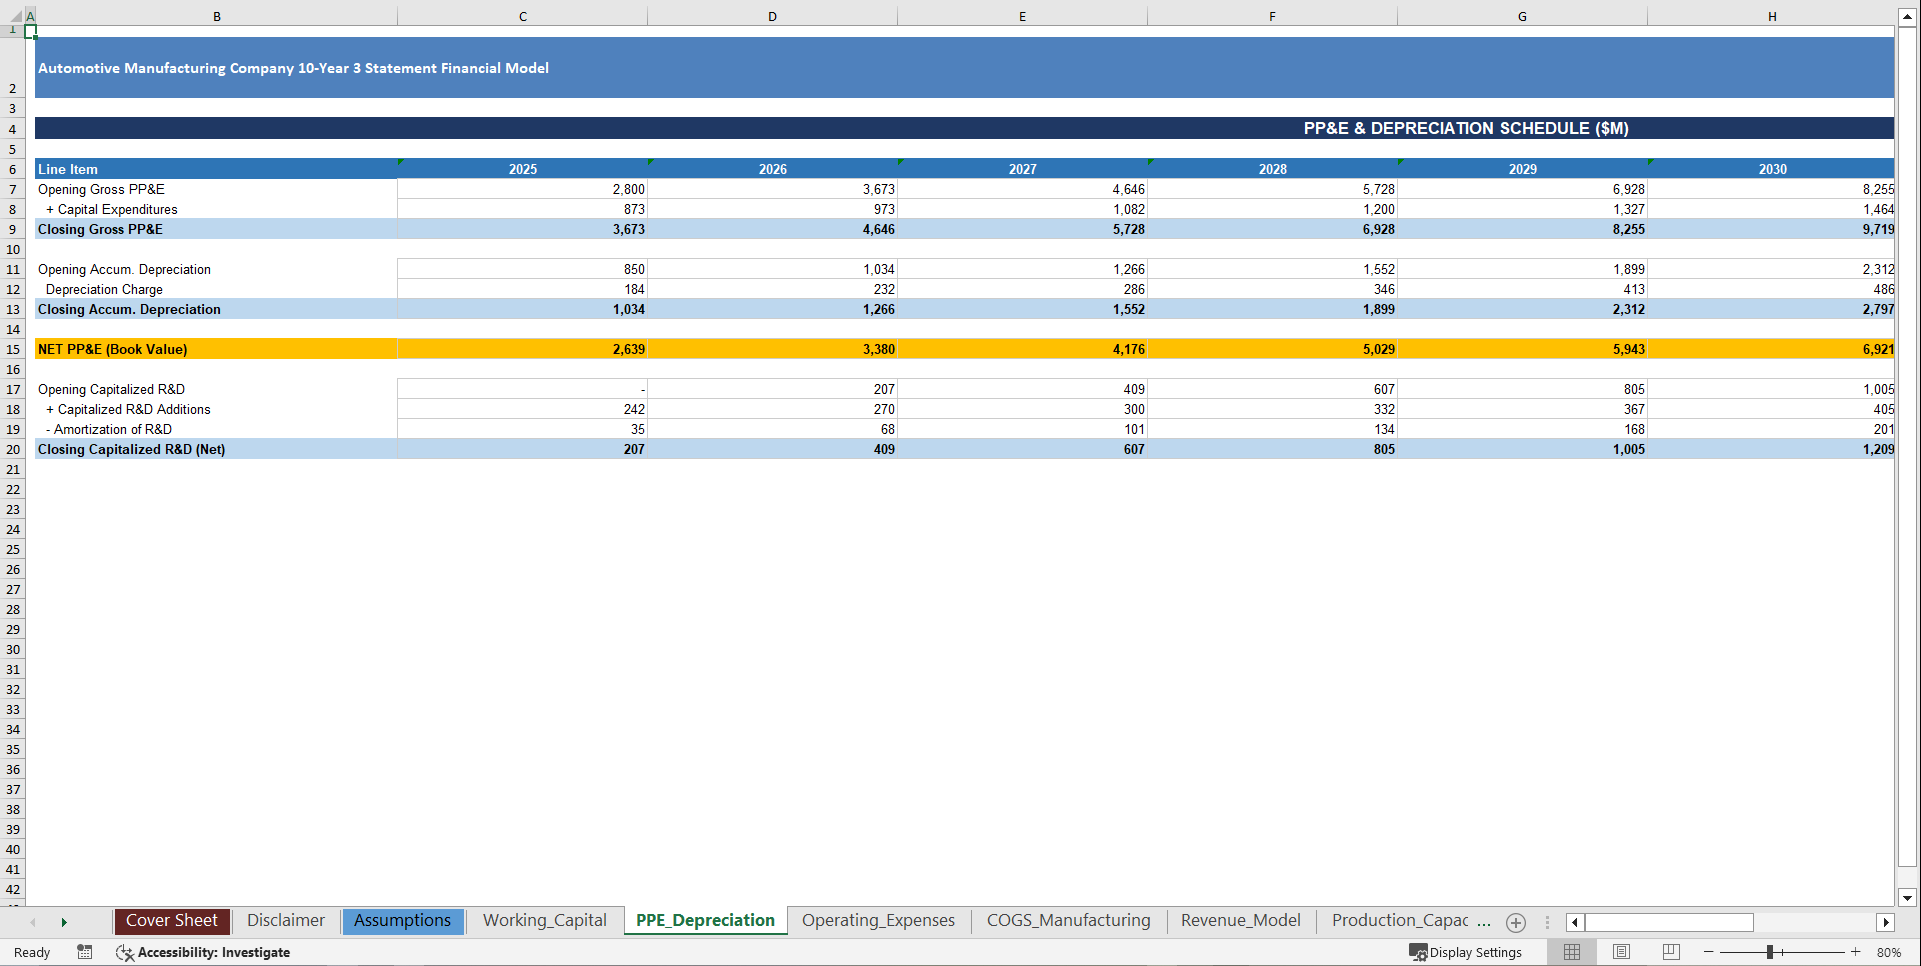
✅ PP&E Roll-Forward, CapEx Schedule & Capitalized R&D Amortization
✅ Working Capital Schedule: DSO-Driven AR, DPO-Driven AP, RM/WIP/Finished Goods Inventory
✅ Sensitivity Analysis + 6-Scenario Comparison Table
✅ Executive Dashboard with KPI Cards, Trend Table & 4 Embedded Charts
✅ 45+ Blue-Coded Assumption Inputs – Change One Cell, Everything Updates
💡 Why This Model Exists
Every other automotive financial model on the market does the same lazy thing: take last year's revenue and multiply it by a growth percentage.
That's not a model. That's a guess dressed up in Excel.
Real automotive manufacturing economics are driven by plant capacity, utilization rates, production volume, bill of materials, EV mix shift, supplier inflation, labor escalation, and capital intensity – none of which a generic template captures.
This model captures all of it. From the first unit off the line to Year 10 cash balance.
📊 What's Inside – Every Tab, Every Formula
🏭 Production & Capacity Model
Plant capacity roll-forward, utilization rate improvement, units produced, scrap rate, saleable units – the operational engine that drives every revenue and cost line in the model.
💰 Revenue Model
Revenue built from units sold × average selling price – by vehicle segment, every year. Sedan, SUV, Truck, and EV each modeled with independent mix shifts, ASP escalation, and volume growth. Plus aftermarket parts revenue and financing arm revenue layered on top.
⚙️ COGS & Manufacturing Schedule
True bill-of-materials cost structure: raw materials with supplier inflation compounding, direct labor with union-rate escalation, manufacturing overhead, freight and outbound logistics, warranty provisions, and quality control – all per-unit, all dynamic.
📋 Operating Expenses
R&D as a percentage of revenue, SG&A, and manufacturing fixed costs – each modeled with independent growth drivers. No lump sums. No guesswork.
🏗️ PP&E & Depreciation Schedule
Opening gross assets, annual CapEx additions, straight-line depreciation, net book value roll-forward – plus a fully separate capitalized R&D schedule with amortization. The schedule every project finance bank demands on page one.
📦 Working Capital Schedule
DSO-driven accounts receivable, DPO-driven accounts payable, raw material days, WIP days, finished goods days – full inventory build with beginning balance, production additions, COGS deductions, and ending inventory. Net working capital and NWC change feeding directly into the cash flow statement.
📈 Income Statement
Revenue → Gross Profit → EBITDA → EBIT → Net Income. Every margin percentage calculated automatically. Gross margin, EBITDA margin, EBIT margin, and net margin output for all 10 years – the full waterfall your investor deck needs.
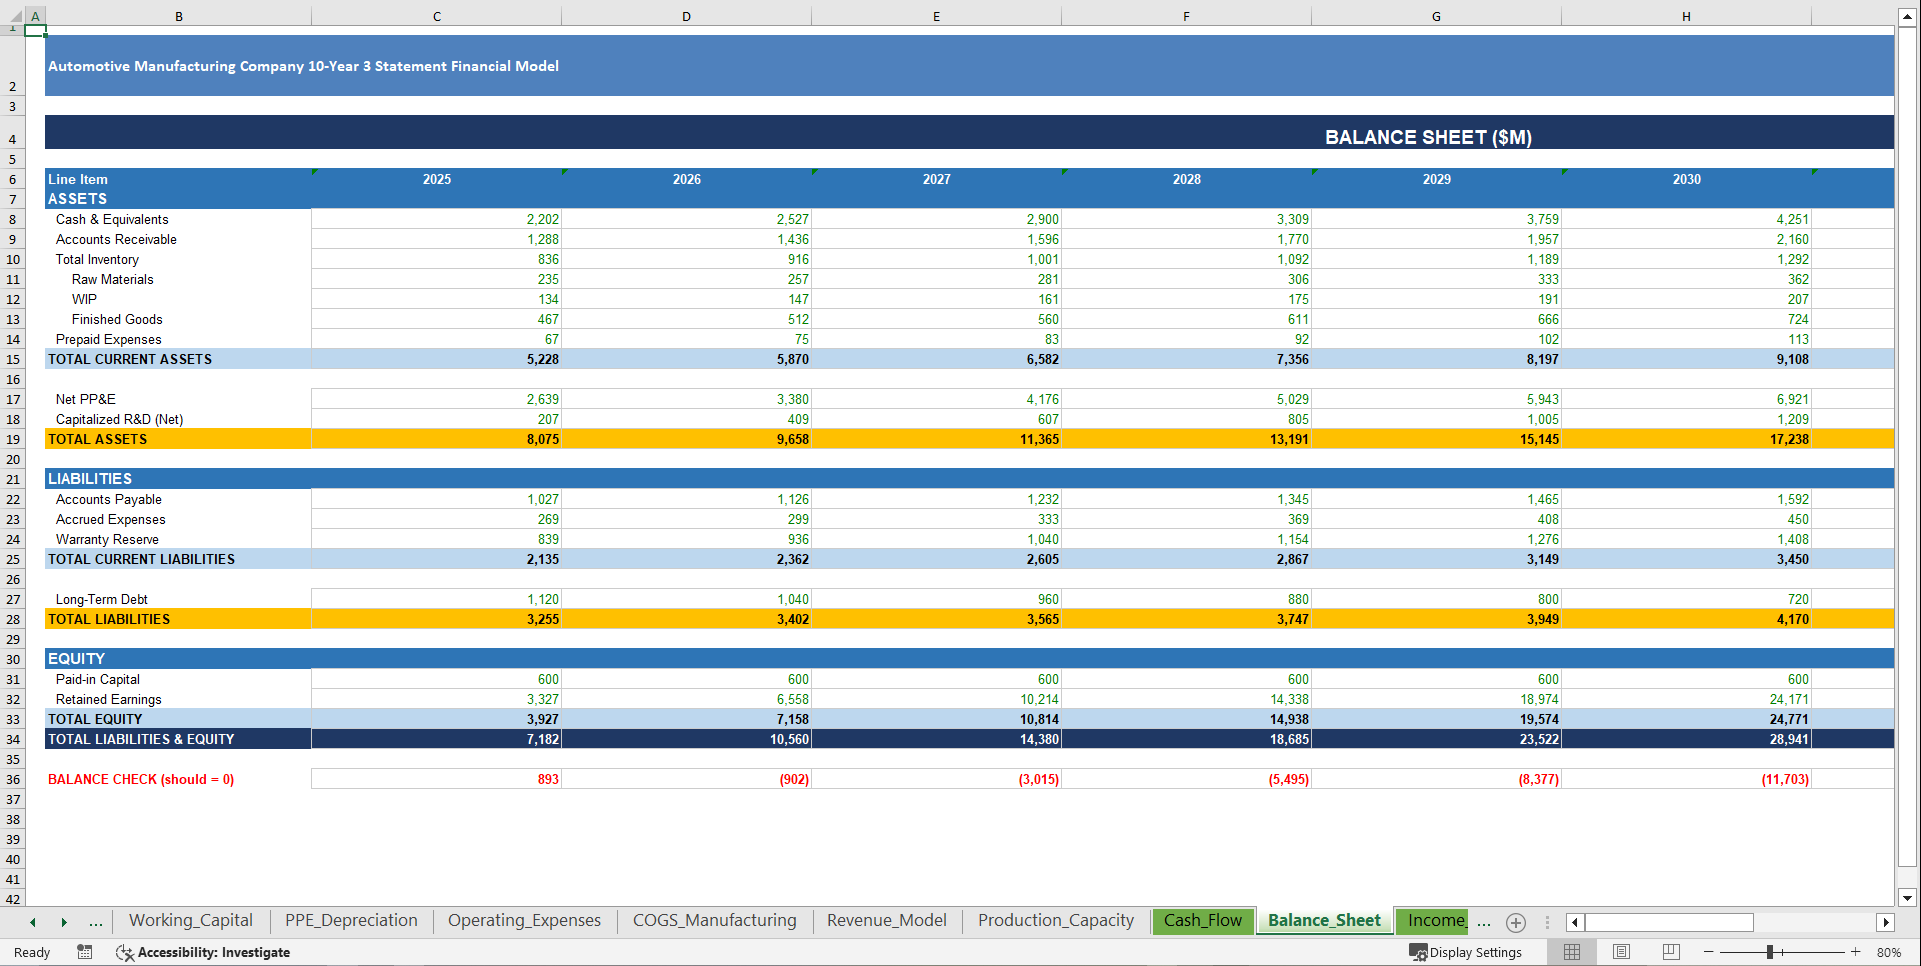
⚖️ Balance Sheet
Current assets, net PP&E, capitalized R&D, accounts payable, warranty reserves, long-term debt roll-forward, paid-in capital, and retained earnings – with a live balance check confirming Total Assets = Total Liabilities + Equity for every single year.
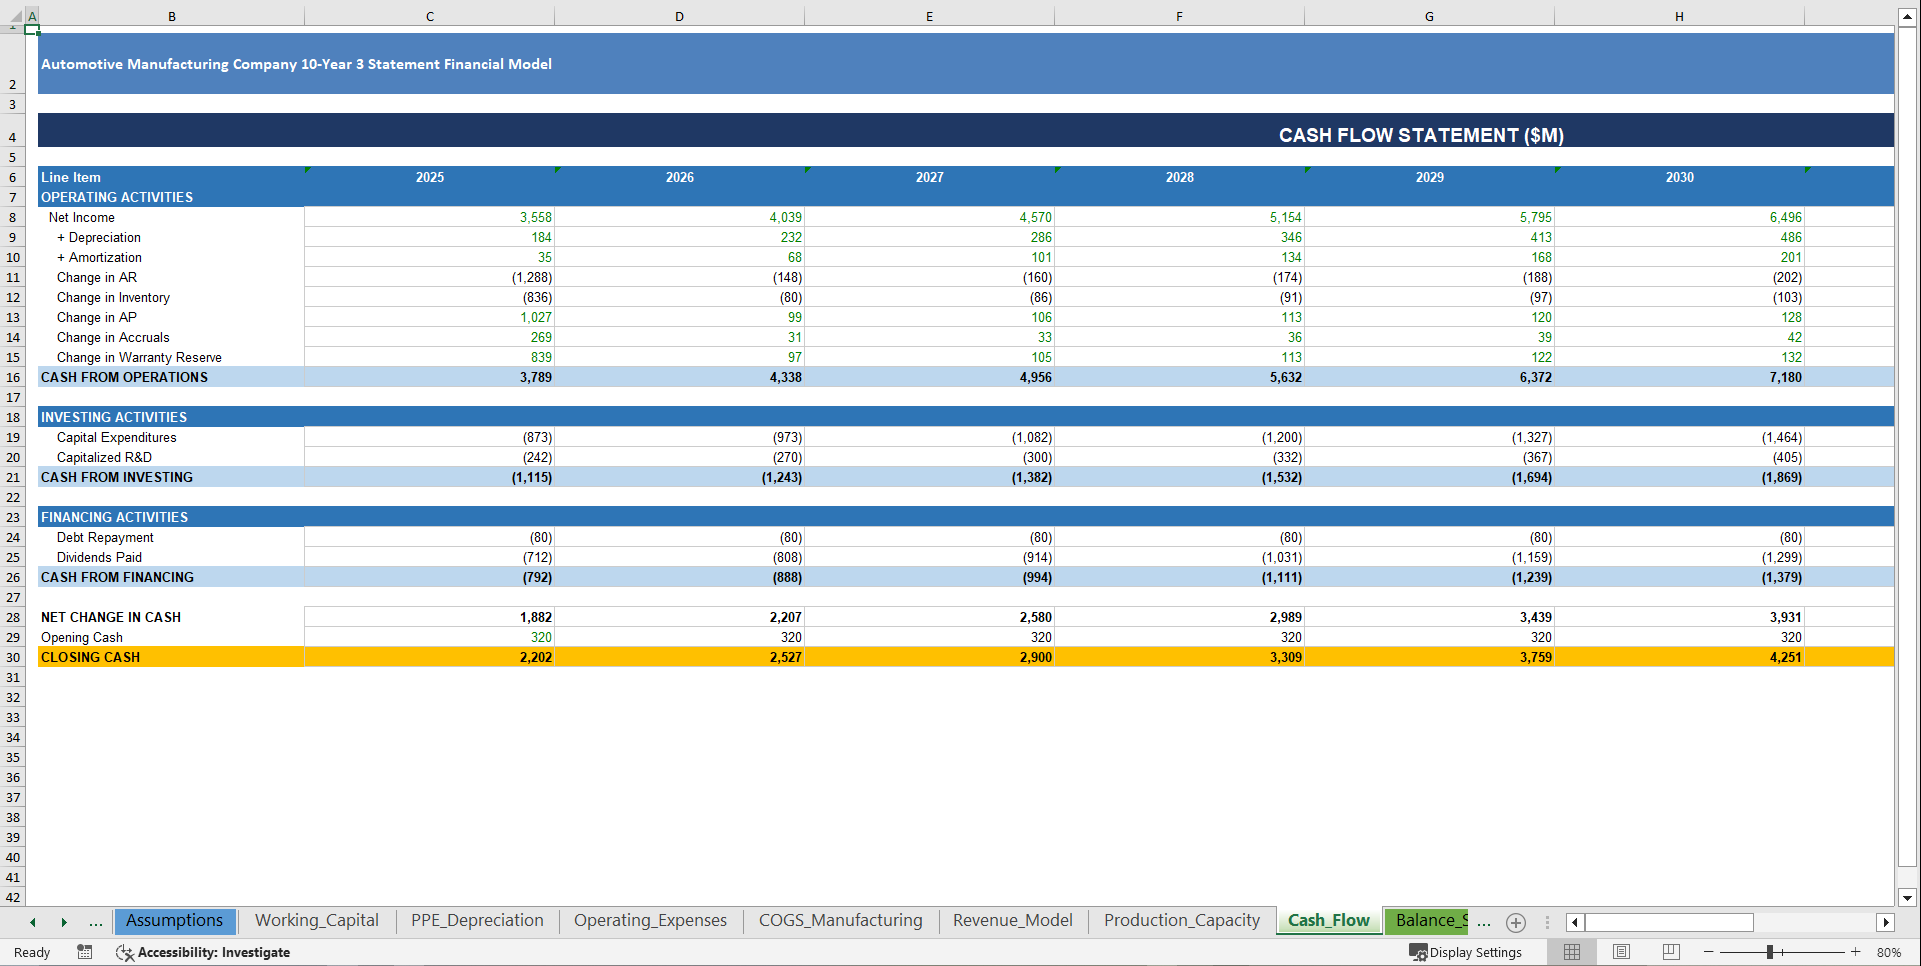
💵 Cash Flow Statement
Indirect method. Net income + D&A + all 7 working capital movements + CapEx + capitalized R&D + debt repayment + dividends. Ending cash hard-linked to the Balance Sheet. The integration test every lender runs before approving a single dollar.
🎯 Sensitivity & Scenario Analysis
ASP sensitivity table, utilization rate vs. revenue matrix, and a 6-scenario EBITDA comparison: Base Case, High Demand, Commodity Inflation, Recession, EV Acceleration, and Supply Chain Disruption. Every scenario your PE buyer or debt provider will stress-test before signing term sheets.
📊 Executive Dashboard
12 KPI cards. 4 embedded charts. Revenue growth, EBITDA trend, margin trajectory, cash balance, production volume, and utilization – all auto-updating, no manual input required. Built for board presentations, investor decks, and bank financing packages.
🎯 Who This Is For
This model was built for one type of person: someone who needs automotive manufacturing financials that actually hold up under scrutiny.
That includes automotive startup founders raising Series A or project finance capital, PE and infrastructure fund analysts underwriting OEM or Tier 1 supplier acquisitions, CFOs and FP&A teams building 10-year operating plans for plant expansions, EV manufacturers modeling the transition from ICE to electric across a mixed fleet, investment bankers running sell-side processes on automotive manufacturing assets, SBA and commercial lenders stress-testing auto industry loan applications, and MBA and CFA candidates who want to learn advanced manufacturing financial modeling from a real, working model.
If you touch automotive manufacturing from any angle – this was built for you.
⚡ Why Most Automotive Financial Models Fail
Generic manufacturing templates miss everything that makes automotive economics unique. They model revenue as a growth rate – not as plant capacity times utilization times average selling price. They ignore EV mix shift and what happens to blended ASP and margin as your fleet transitions. They treat raw materials as a fixed percentage with no supplier inflation compounding. They skip the working capital complexity entirely – no inventory by stage, no warranty reserve build, no DPO mechanics. They have no CapEx intensity modeling, no PP&E roll-forward, no depreciation tied to gross asset growth. And they produce a balance sheet that doesn't balance.
This model fixes every single one of those failures – from the ground up.
🚨 The Cost of NOT Having This
Running a capital raise, acquisition, or plant expansion without a proper model means risking your SBA or project finance loan because your cash flow statement doesn't tie to your balance sheet. It means undervaluing your manufacturing asset in a sale because you couldn't model a clean production-driven revenue trajectory. It means failing PE or infrastructure fund due diligence because your revenue model is a straight-line growth guess. And it means spending $25,000–$40,000 on a Big 4 advisor to build what you can own and update yourself forever.
One financing round modeled correctly pays for this thousands of times over.
👉 Get the Automotive Manufacturing Financial Model – Built the Right Way
No hardcoded revenue projections. No broken formula links. No wasted weekends rebuilding from scratch.
Just a complete, verified, automotive manufacturing–specific 3-statement financial model – ready to deploy on your next raise, acquisition, plant expansion, or operating plan.
Download today and walk into your next investor meeting, bank presentation, or PE process with the financial model that proves your numbers hold up.
Key Words:
Strategy & Transformation, Growth Strategy, Strategic Planning, Strategy Frameworks, Innovation Management, Pricing Strategy, Core Competencies, Strategy Development, Business Transformation, Marketing Plan Development, Product Strategy, Breakout Strategy, Competitive Advantage, Mission, Vision, Values, Strategy Deployment & Execution, Innovation, Vision Statement, Core Competencies Analysis, Corporate Strategy, Product Launch Strategy, BMI, Blue Ocean Strategy, Breakthrough Strategy, Business Model Innovation, Business Strategy Example, Corporate Transformation, Critical Success Factors, Customer Segmentation, Customer Value Proposition, Distinctive Capabilities, Enterprise Performance Management, KPI, Key Performance Indicators, Market Analysis, Market Entry Example, Market Entry Plan, Market Intelligence, Market Research, Market Segmentation, Market Sizing, Marketing, Michael Porter's Value Chain, Organizational Transformation, Performance Management, Performance Measurement, Platform Strategy, Product Go-to-Market Strategy, Reorganization, Restructuring, SWOT, SWOT Analysis, Service 4.0, Service Strategy, Service Transformation, Strategic Analysis, Strategic Plan Example, Strategy Deployment, Strategy Execution, Strategy Frameworks Compilation, Strategy Methodologies, Strategy Report Example, Value Chain, Value Chain Analysis, Value Innovation, Value Proposition, Vision Statement, Corporate Strategy, Business Development, Business plan pdf, business plan, PDF, Business Plan DOC, Business Plan Template, PPT, Market strategy playbook, strategic market planning, competitive analysis tools, market segmentation frameworks, growth strategy templates, product positioning strategy, market execution toolkit, strategic alignment playbook, KPI and OKR frameworks, business growth strategy guide, cross-functional strategy templates, market risk management, market strategy PowerPoint doc, guide, ebook, e-book ,McKinsey Change Playbook, Organizational change management toolkit, Change management frameworks 2025, Influence model for change, Change leadership strategies, Behavioral change in organizations, Change management PowerPoint templates, Transformational leadership in change, supply chain KPIs, supply chain KPI toolkit, supply chain PowerPoint template, logistics KPIs, procurement KPIs, inventory management KPIs, supply chain performance metrics, manufacturing KPIs, supply chain dashboard, supply chain strategy KPIs, reverse logistics KPIs, sustainability KPIs in supply chain, financial supply chain KPIs, warehouse KPIs, digital supply chain KPIs, 1200 KPIs, supply chain scorecard, KPI examples, supply chain templates, Corporate Finance SOPs, Finance SOP Excel Template, CFO Toolkit, Finance Department Procedures, Financial Planning SOPs, Treasury SOPs, Accounts Payable SOPs, Accounts Receivable SOPs, General Ledger SOPs, Accounting Policies Template, Internal Controls SOPs, Finance Process Standardization, Finance Operating Procedures, Finance Department Excel Template, FP&A Process Documentation, Corporate Finance Template, Finance SOP Toolkit, CFO Process Templates, Accounting SOP Package, Tax Compliance SOPs, Financial Risk Management Procedures.
NOTE: Our digital products are sold on an "as is" basis, making returns and refunds unavailable post-download. Please preview and inquire before purchasing. Please contact us before purchasing if you have any questions! This policy aligns with the standard Flevy Terms of Usage.
Got a question about the product? Email us at support@flevy.com or ask the author directly by using the "Ask the Author a Question" form. If you cannot view the preview above this document description, go here to view the large preview instead.
Source: Best Practices in Manufacturing, Integrated Financial Model Excel: Automotive Manufacturer 10-Year 3 Statement Financial Model Excel (XLSX) Spreadsheet, SB Consulting
ABOUT THE AUTHOR
SB Consulting is dedicated to empowering businesses to communicate their ideas with impact. This consulting firm specializes in teaching organizations how to create effective corporate and management presentations. With training from top-tier global consulting firms, including McKinsey, BCG, and Porsche Consulting, extensive expertise in presentation design and ... [read more]
Ask the Author a Question
You must be logged in to contact the author.
