
Manufacturing Financial Model Template – Excel XLSX
Excel (XLSX)
MANUFACTURING EXCEL DESCRIPTION
The manufacturing industry is one of the largest and fastest-growing sectors in the world. The manufacturing sector serves as the basis for a wide variety of other industries such as computers, healthcare, food and beverage, transportation, agriculture, etc. The manufacturing industry forms the backbone of our country's economy, it is also used as an indicator of how well the country is doing on the global index.
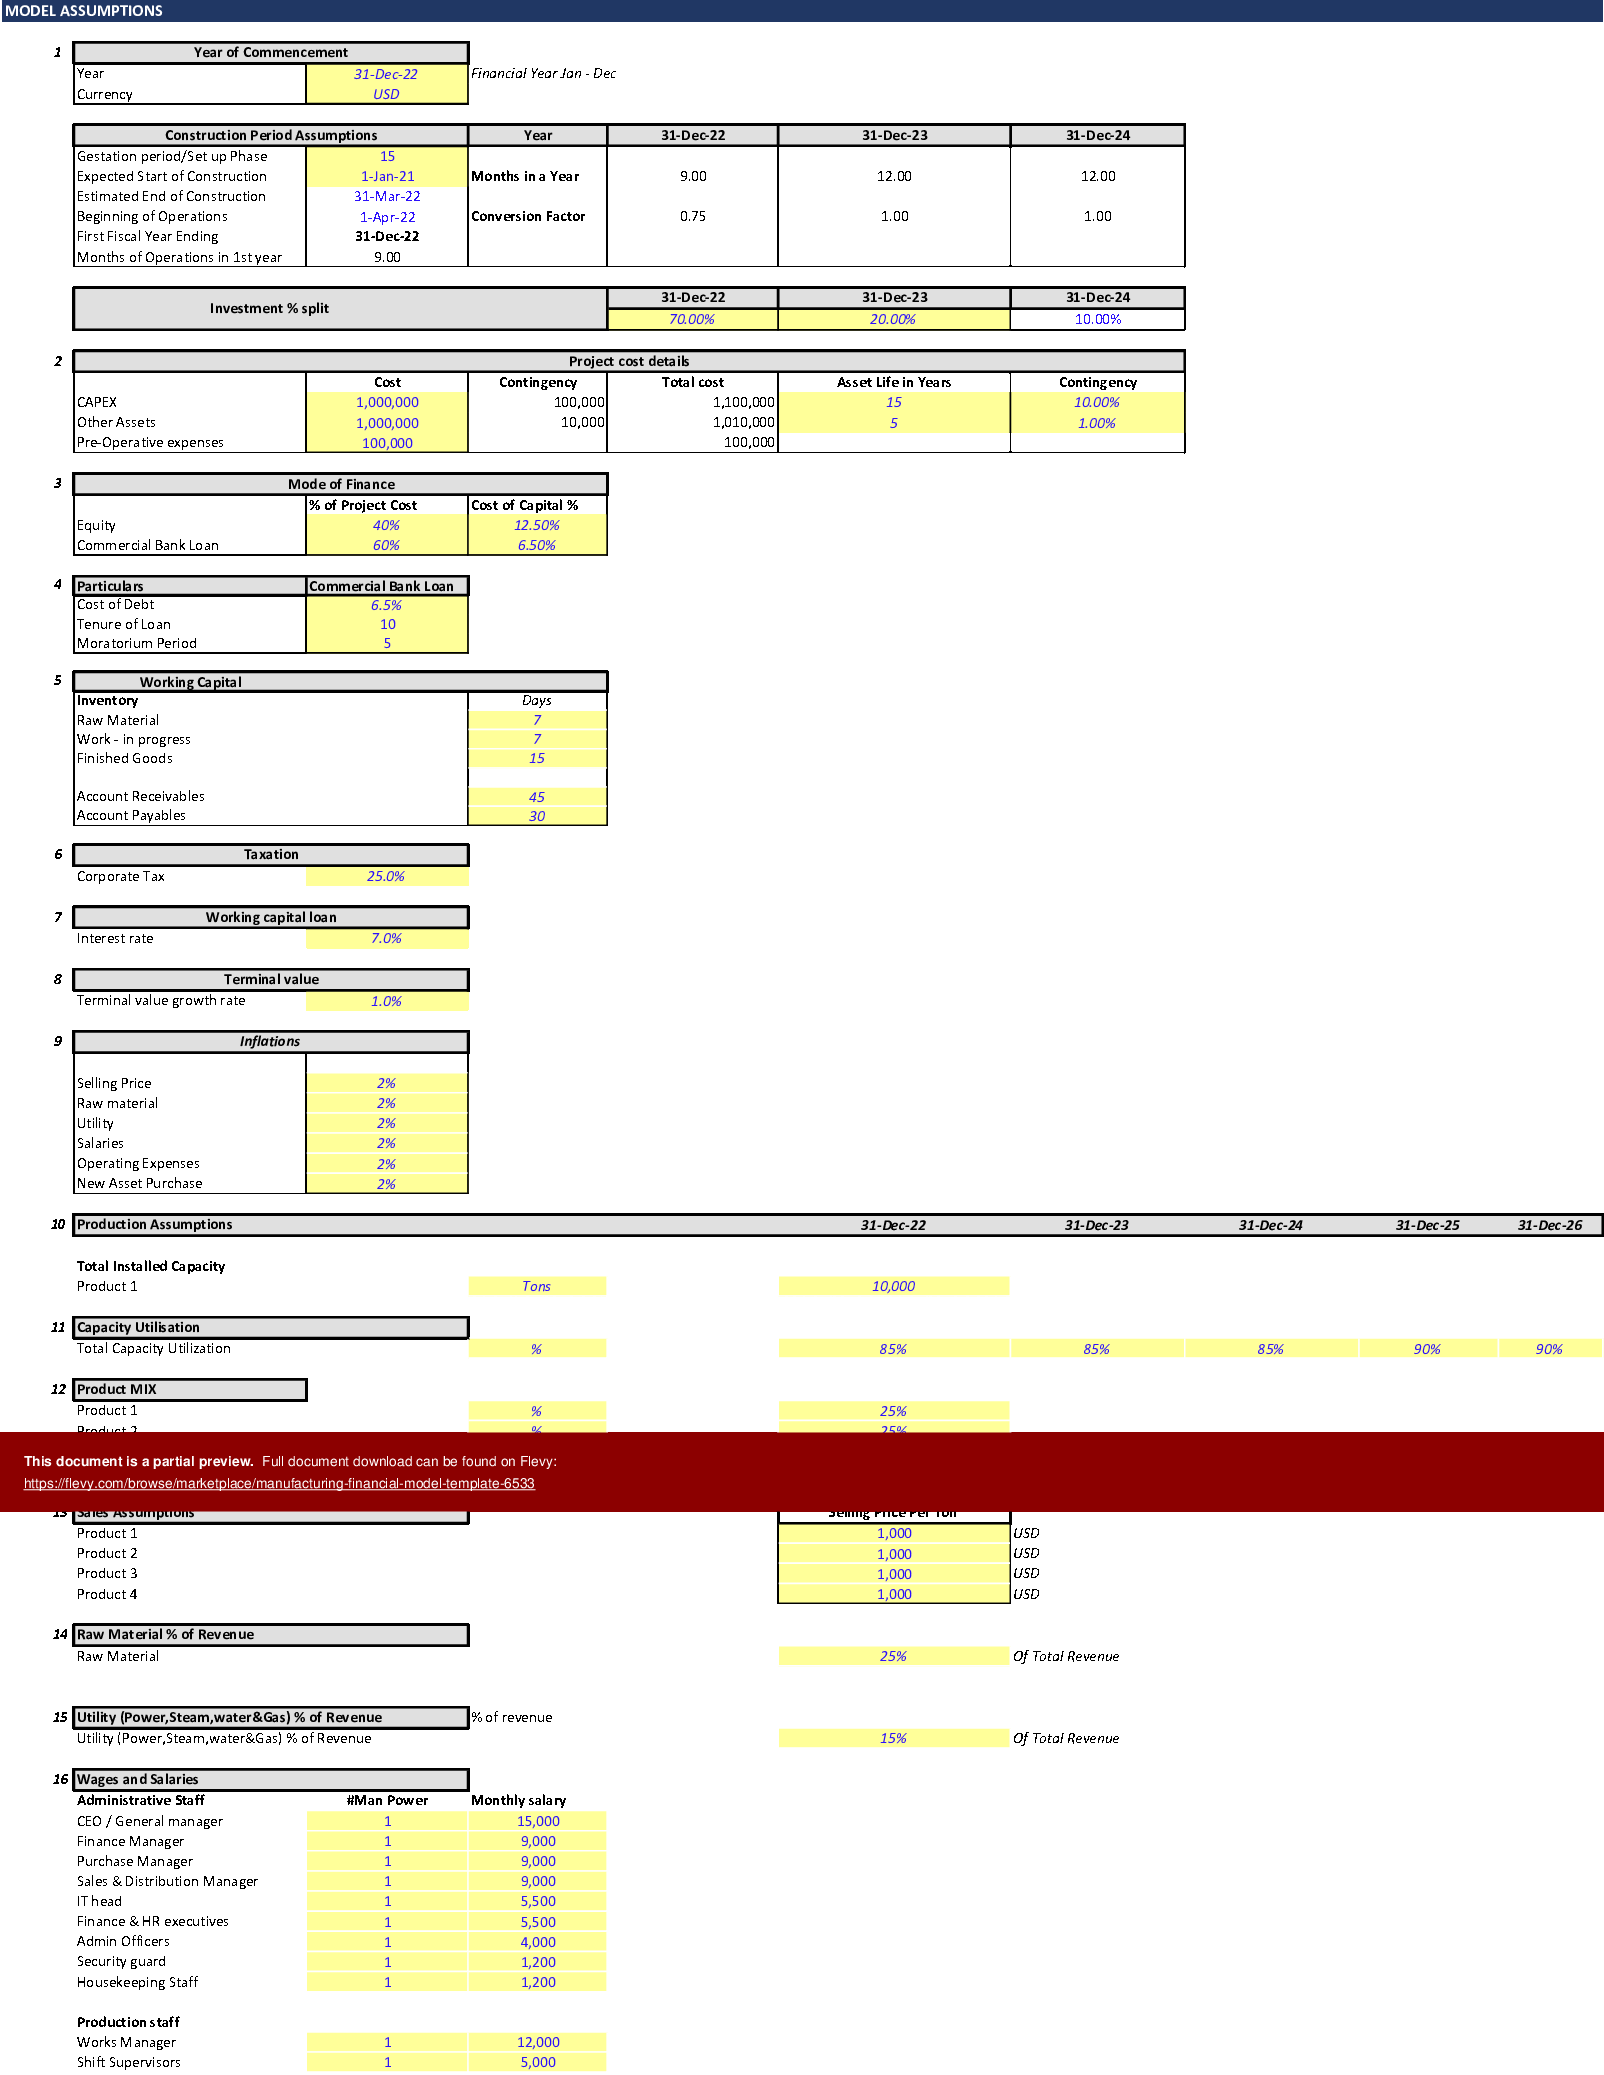
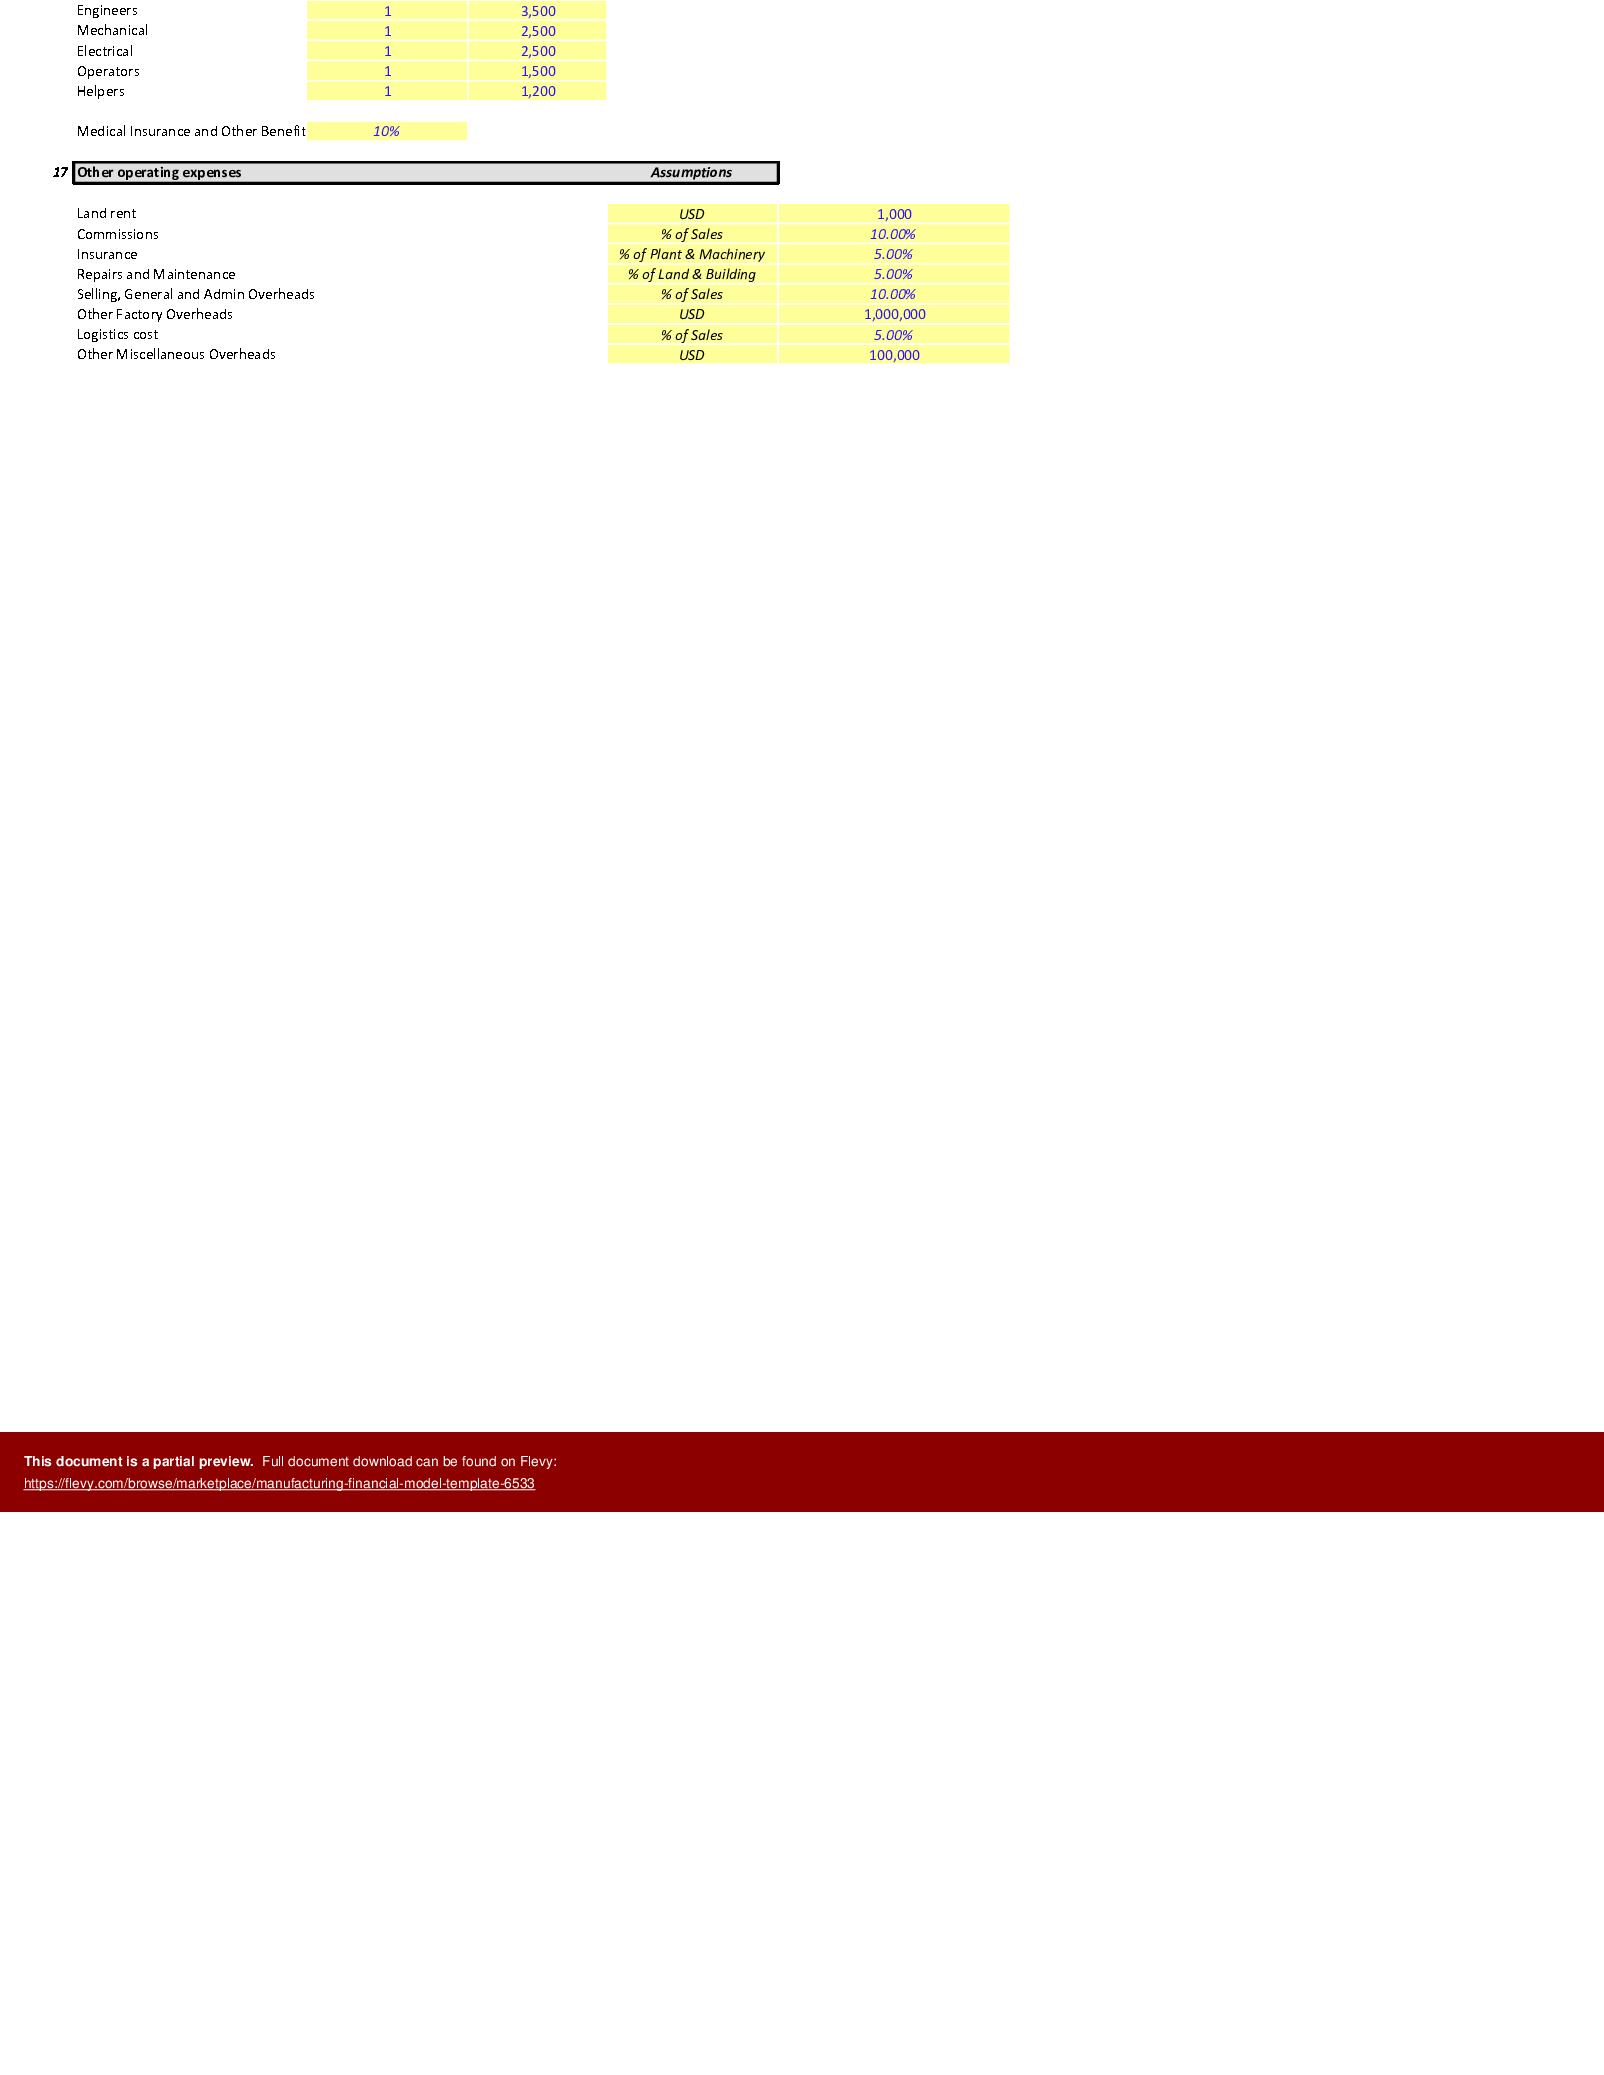
Our financial model template takes into consideration various factors in the manufacturing industry such as production assumptions, capacity utilization, product mix, sales assumptions, raw material share in revenue, utilities share in revenue, wages and salaries, and other operating expenses for working and forecasts.
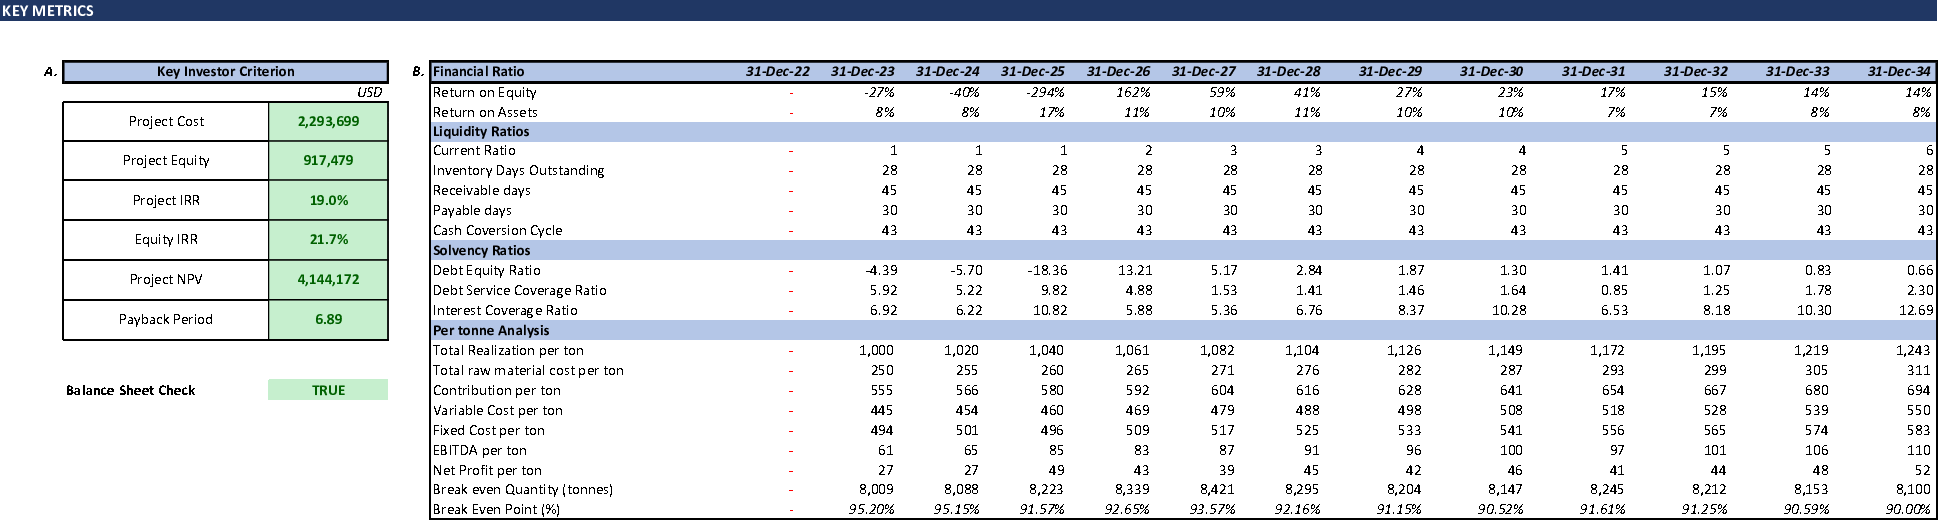
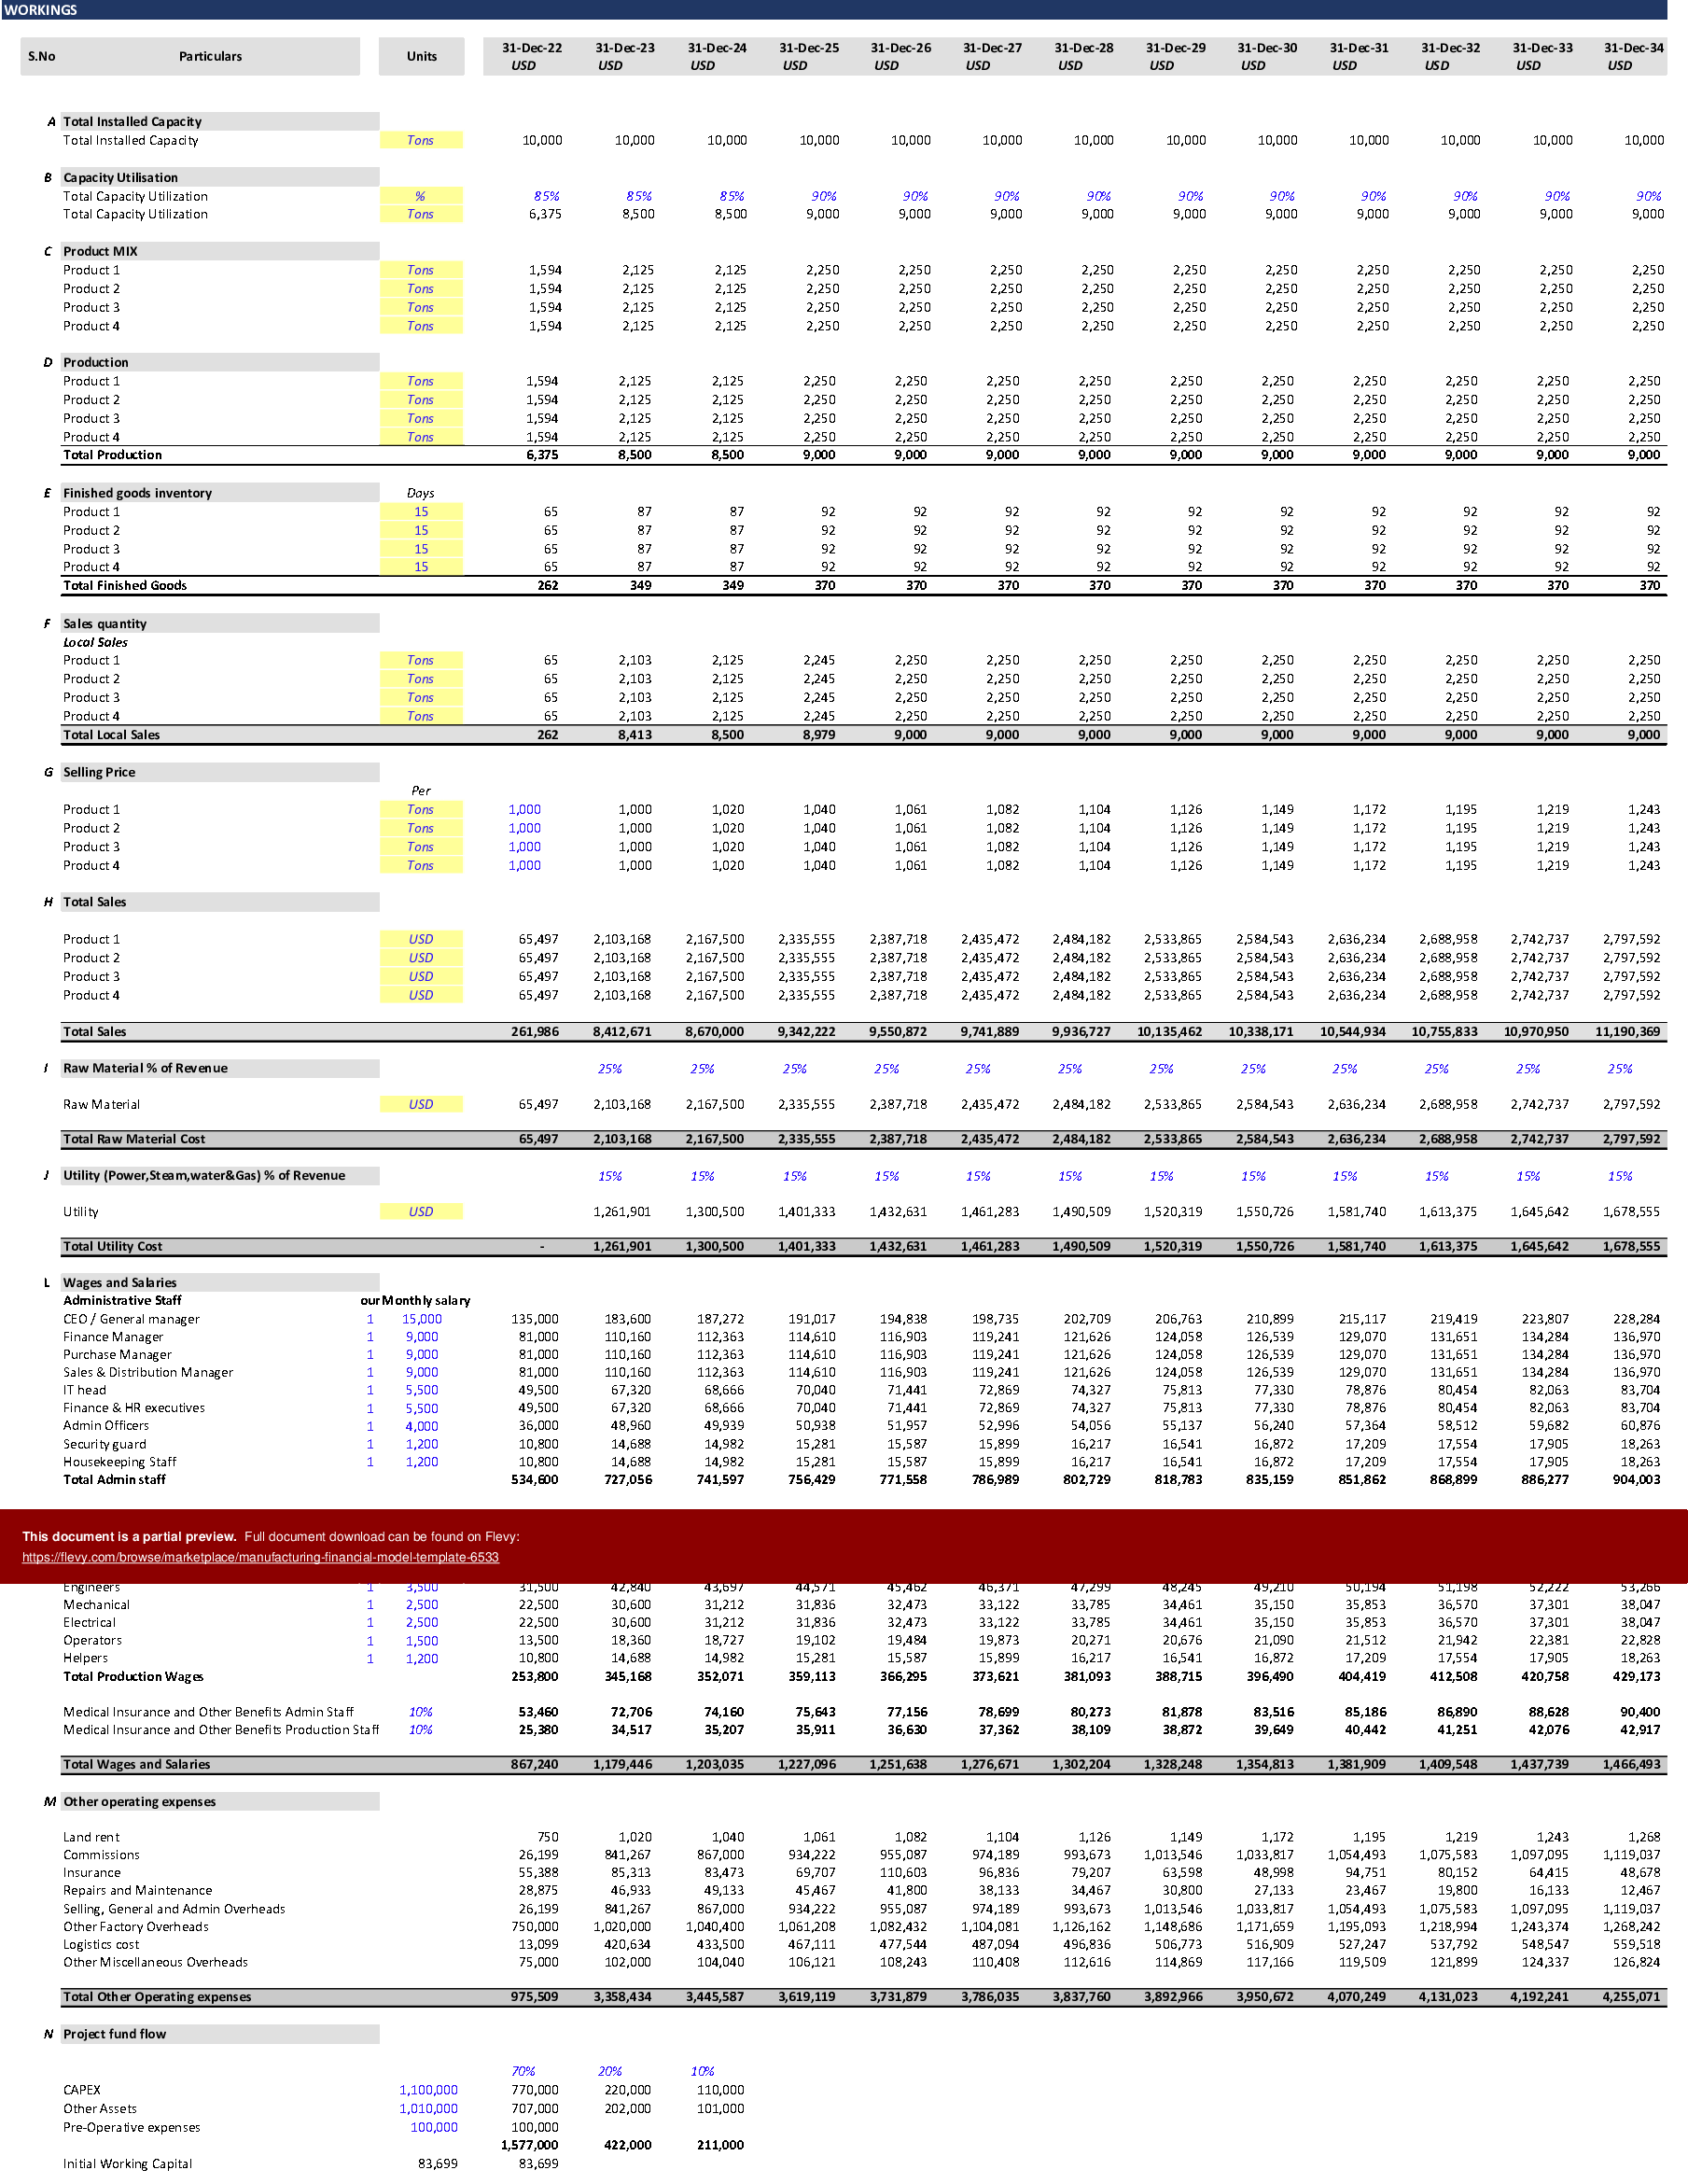
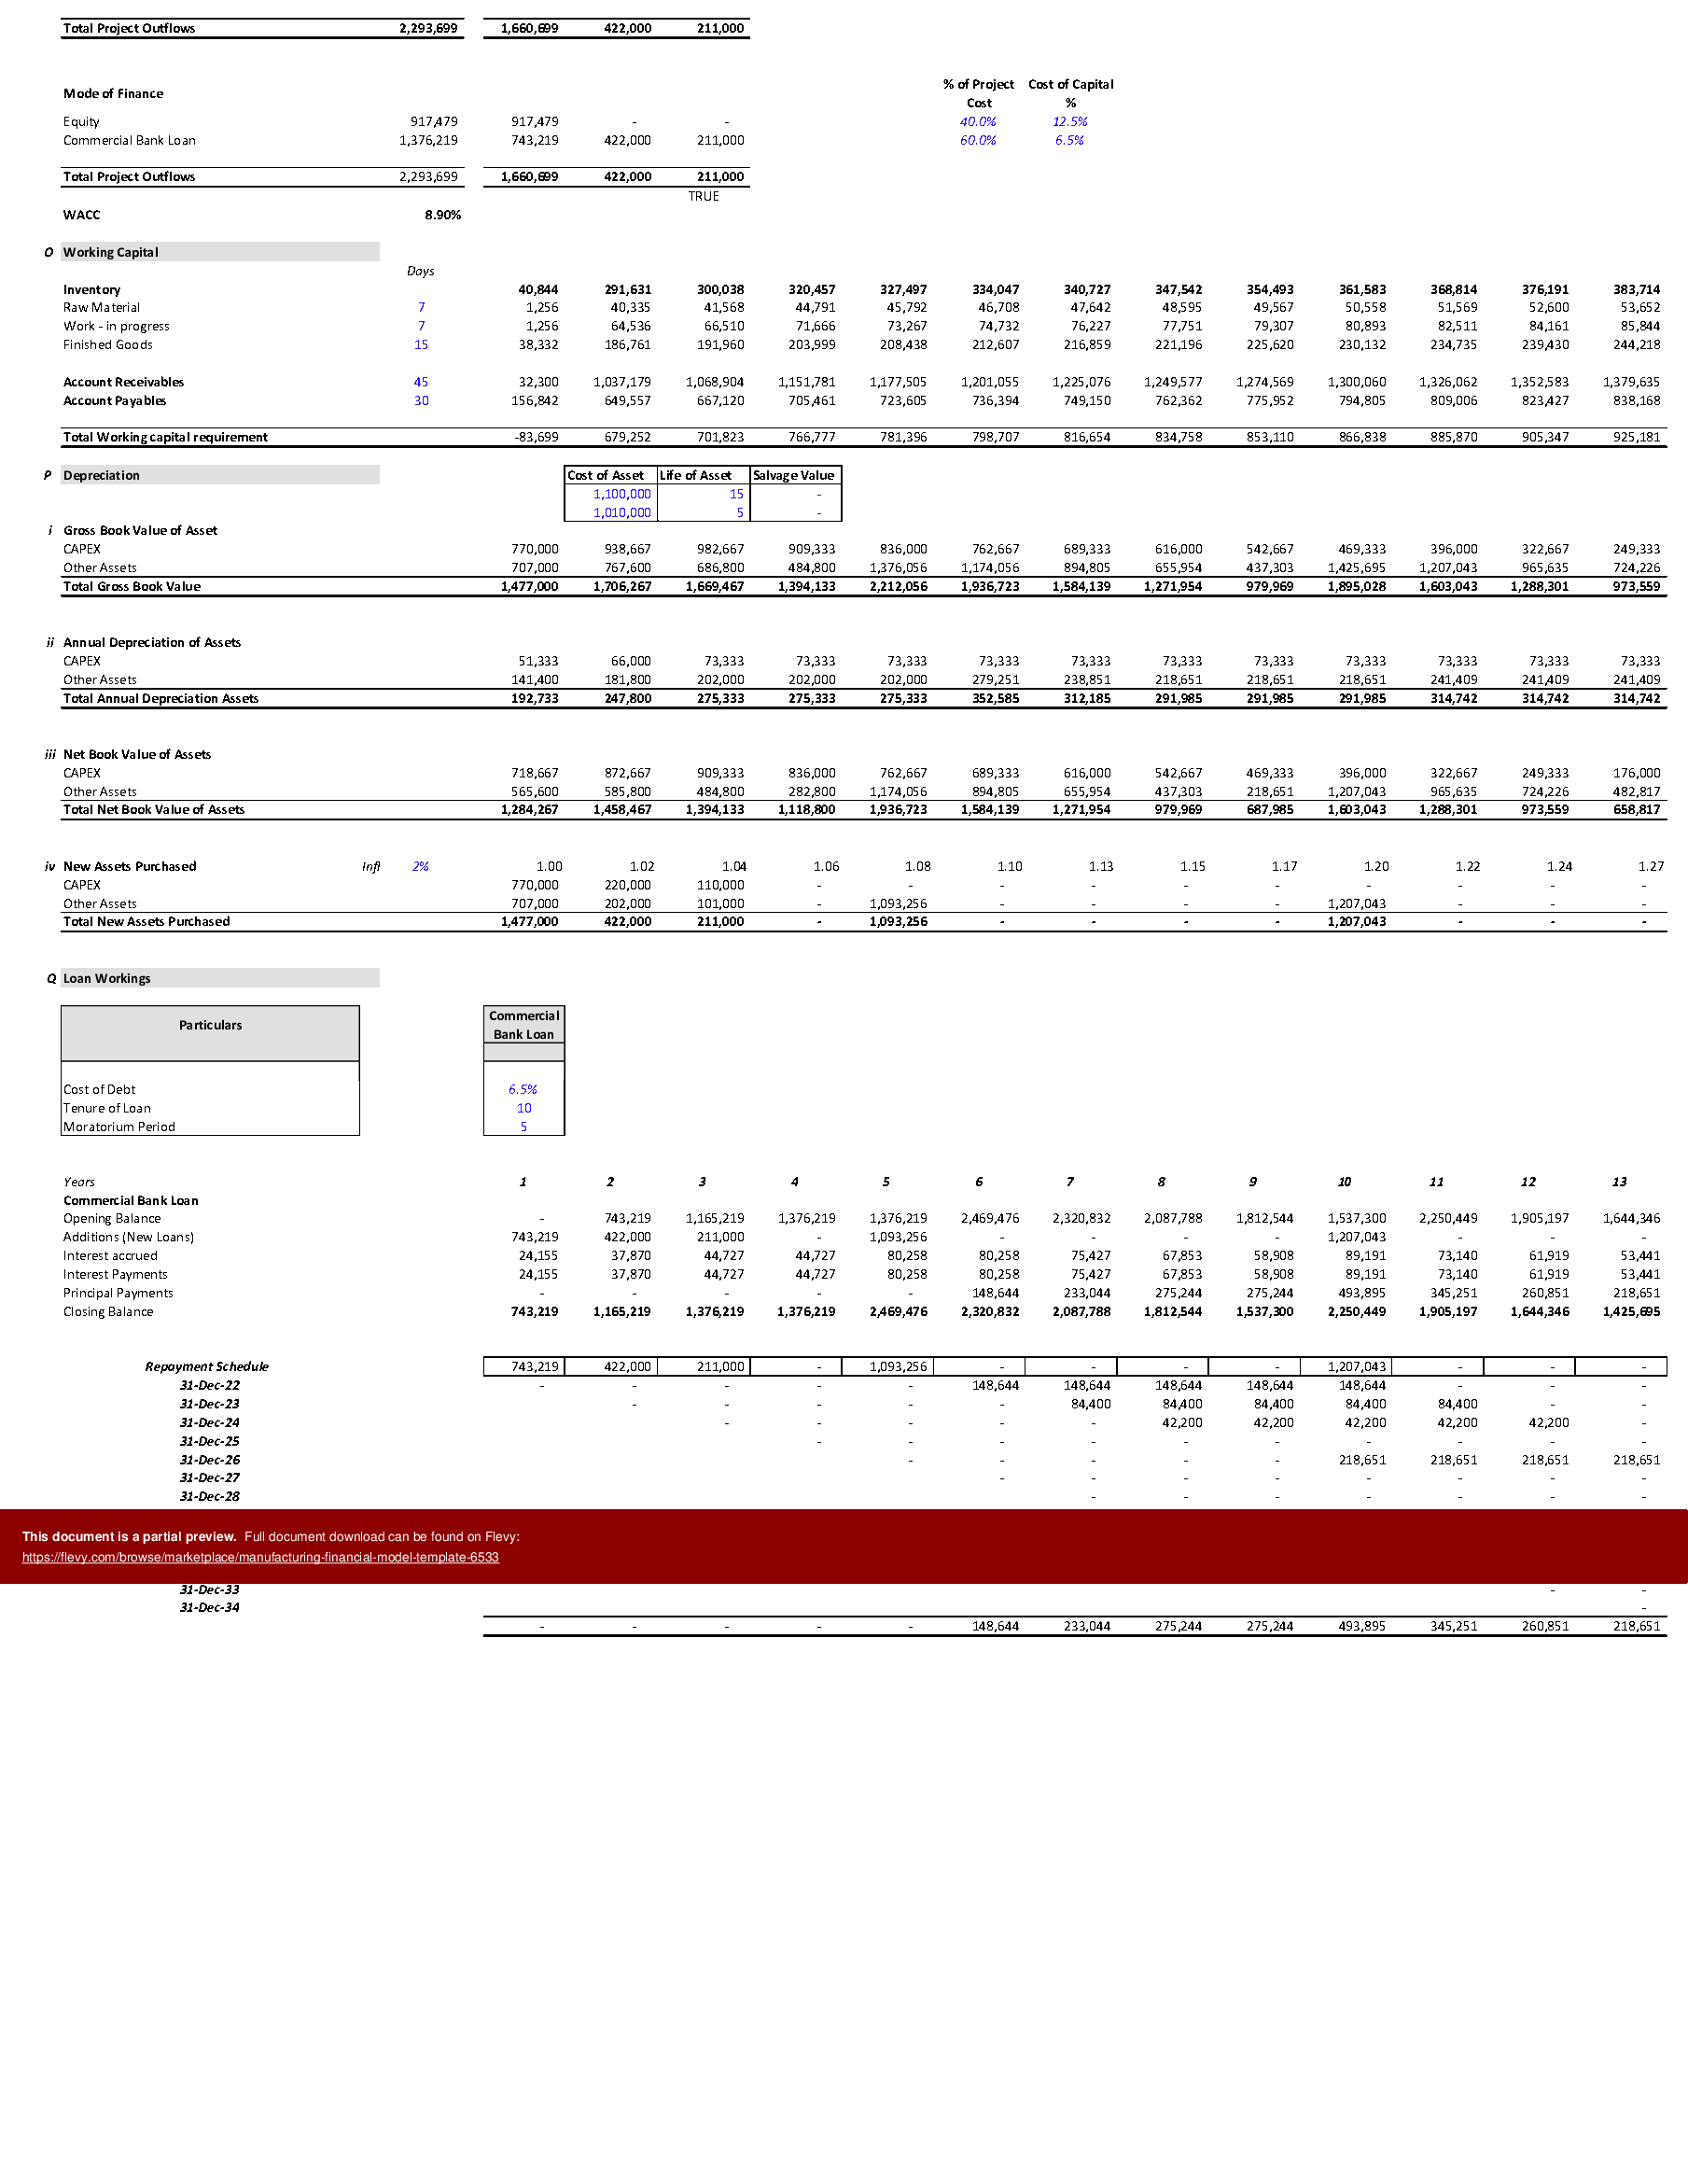
Our model elaborates all of them in a 13-year forecast of production activities, including Total Installed Capacity, Capacity Utilization, Production per product, and Finished goods inventory. It also projects sales quantity and selling price for each product separately.
Further, it forecasts costs of raw material, utility, wages and salaries of various administrative and production staff, and other operating expenses. The model goes on to project fund flow, working capital, depreciation, and finally loan workings.
Our model is designed and built to support you in predicting your production levels, revenue, cost, and expenses for 13 years and thus help you to decide on procurement, sales, salaries and wages and marketing expenses, and terms of loan repayment
This comprehensive template also includes detailed charts and graphs to visualize financial projections, revenue breakdowns, expense distributions, and headcount requirements. It offers a clear depiction of sources and uses of funds, free cash flow, and break-even analysis, providing a holistic view of your manufacturing financials. The model's robust structure ensures you can make informed decisions on capital allocation, operational efficiency, and strategic planning. This tool is essential for any manufacturing executive looking to optimize financial performance and drive business growth.
Got a question about the product? Email us at support@flevy.com or ask the author directly by using the "Ask the Author a Question" form. If you cannot view the preview above this document description, go here to view the large preview instead.
TOPIC FAQ
What core inputs are needed to build a manufacturing financial model?
Core inputs include production assumptions, capacity utilization, product mix, sales assumptions, raw material share in revenue, utilities share, wages and other operating expenses. These driver-level inputs feed a multi-year projection that the template structures into a consolidated 13-year forecast.How should I forecast production volumes and inventory in a plant-level model?
Forecasts should model Total Installed Capacity, expected Capacity Utilization, production volume per product, and finished goods inventory movements. Translating capacity percentages into production per product and inventory builds enables sales/production alignment and inventory planning tied to Finished Goods inventory.Which cost categories are critical for margin and profitability analysis?
Critical cost categories are raw material costs, utilities, wages and salaries (administrative and production), and other operating expenses. Modeling these as shares of revenue and by line item supports margin analysis and identifies cost pressures like raw material share in revenue.What cash-flow and financing outputs should a manufacturing model produce?
A model should produce fund flow statements, working capital projections, depreciation schedules, loan amortization/loan workings, and free cash flow calculations. These outputs support liquidity planning, repayment scheduling, and sources-and-uses analysis tied to financing decisions and loan workings.What should I evaluate when choosing a manufacturing financial model template?
Evaluate whether the template covers production drivers, capacity and product-level sales, cost line granularity, cash-flow and loan workings, and visualization of revenue and expense breakdowns. A template that maps drivers to fund flow and headcount requirements provides clearer decision support, such as headcount requirements.How do visualizations help interpret manufacturing financial projections?
Charts and graphs clarify trends in revenue breakdowns, expense distributions, production volumes, headcount needs, and break-even points. Visuals make it easier to spot capacity constraints, margin pressure, and cash-flow timing issues; the template provides dedicated charts and graphs for these analyses.I need to plan loan repayment for new capacity — which model outputs matter most?
For loan planning, focus on projected fund flow and free cash flow, working capital needs, depreciation, and the loan workings schedule to assess repayment capacity and timing. A multi-year horizon helps align repayment terms with projected free cash flow.How can a financial model support product-level pricing and sales forecasting?
Use product-level sales quantity and selling price inputs, combined with product mix and capacity constraints, to project revenues by product and analyze profitability. Modeling selling price and quantity separately enables scenario analysis of pricing changes on revenue and margins.Source: Best Practices in Manufacturing, Integrated Financial Model Excel: Manufacturing Financial Model Template Excel (XLSX) Spreadsheet, Strategy Financial Model
