
 Click main image to view in full screen. Unlock all 10 preview images:
Application Monitoring, Observability & Performance Plan – Word DOCX
Word (DOCX) + PowerPoint (PPTX) 52 Pages


BENEFITS OF THIS DOWNLOADABLE WORD DOCUMENT
- Reduce monitoring blind spots, false confidence, and alert noise. Explicitly control stale data, no-data conditions, telemetry-pipeline health, actionable alerting, dependency behavior, tail-performance degradation, capacity pressure, and monitoring valid
- Build a reusable observability and SRE operating system. Use 15 implementation registers, matrices, and checklists to maintain monitoring coverage, SLOs, error budgets, metrics, alerts, dashboards, dependencies, capacity evidence, validation, exceptions,
- From Green Dashboards to Trusted Evidence: ISO/IEC 25010:2023-Mapped Observability & Performance Control
INFORMATION TECHNOLOGY WORD DESCRIPTION
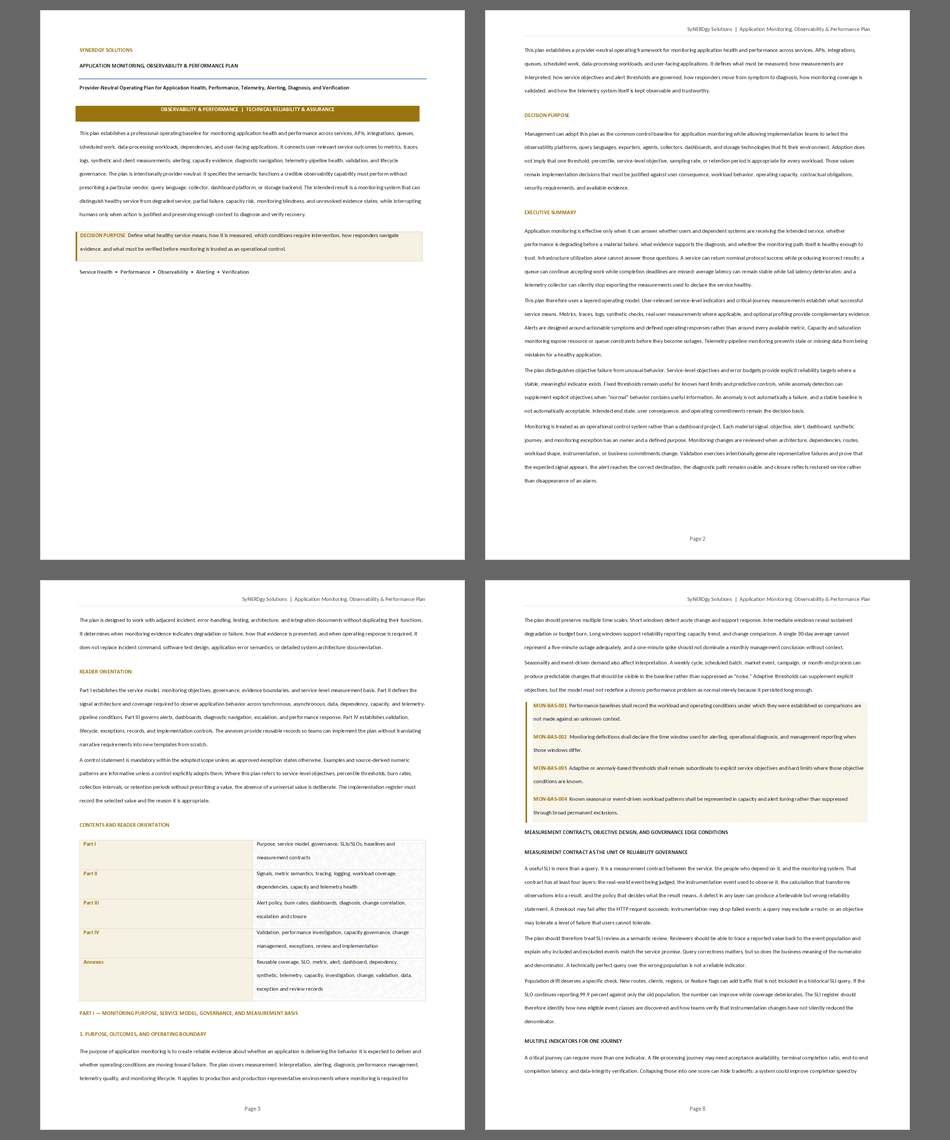
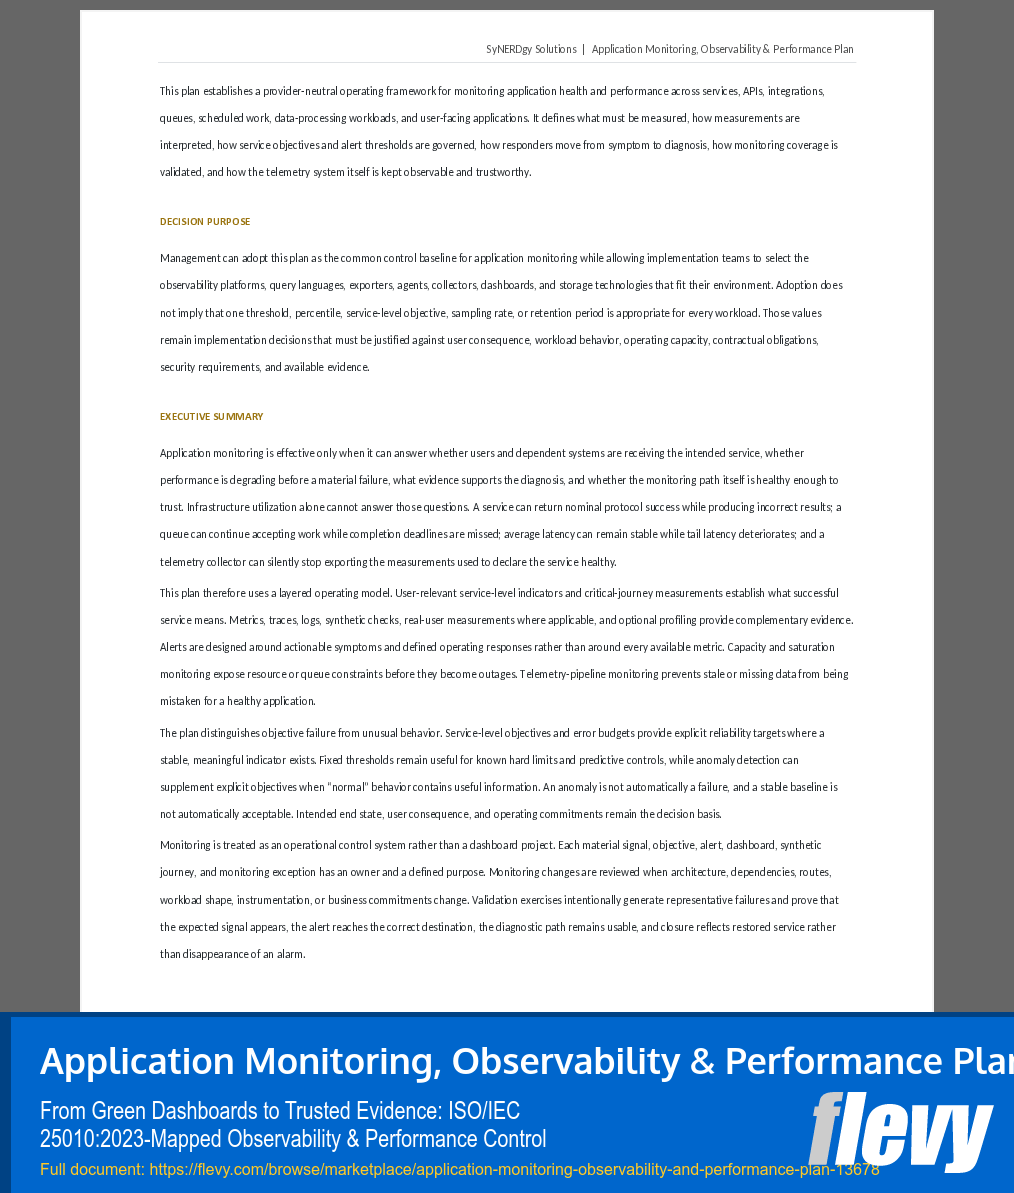
Application Monitoring, Observability & Performance Plan is a 54-page editable, provider-neutral operating plan for organizations that need more than dashboards, alerts, and scattered telemetry to understand whether an application is actually healthy.
Modern application monitoring can create a dangerous form of confidence. The dashboard is green, infrastructure is reachable, and the alerting platform is quiet, yet users may still be experiencing degraded service, asynchronous work may be missing completion deadlines, telemetry may be stale, dependency failures may be hidden by aggregation, or the organization may be unable to prove whether the monitoring system itself is functioning correctly.
This plan addresses that gap by turning application monitoring, observability, application performance monitoring, SRE practices, SLI/SLO management, alerting, telemetry health, capacity monitoring, and performance investigation into a controlled evidence system.
The framework starts with service outcomes and critical user or system journeys rather than with monitoring tools. It establishes a professional operating baseline for applications, APIs, integrations, queues, scheduled work, data-processing workloads, dependencies, and user-facing services. It then connects those outcomes to measurable operating conditions through service-level indicators (SLIs), service-level objectives (SLOs), error budgets, measurement contracts, metrics, traces, logs, synthetic monitoring, dependency monitoring, telemetry-pipeline health, capacity and saturation signals, performance investigation, alert routing, diagnostic dashboards, change correlation, and monitoring validation.
A central principle of the plan is that visible telemetry is not automatically trustworthy telemetry.
A graph can remain visible after collection stops. No-data can be mistaken for zero activity. A provider status page can report normal operation while the application's actual dependency path is failing. Average latency can remain stable while tail latency deteriorates. A queue can continue accepting work even while completion deadlines are being missed. A successful protocol response can occur even when the resulting business outcome is incorrect, incomplete, stale, or unusable.
The plan therefore treats observability as an evidence system, not a wall of charts. Monitoring should be able to distinguish healthy service from degradation, partial failure, capacity risk, stale evidence, missing telemetry, monitoring blindness, and unresolved or unknown states.
The operating model also separates detection from diagnosis. An alert is not simply a metric threshold. It should identify a condition that justifies action, reach an accountable owner, and connect that responder to evidence capable of supporting diagnosis. Dashboards, traces, logs, dependency information, change records, capacity evidence, and service-level measures then help determine scope, cause, consequence, and recovery.
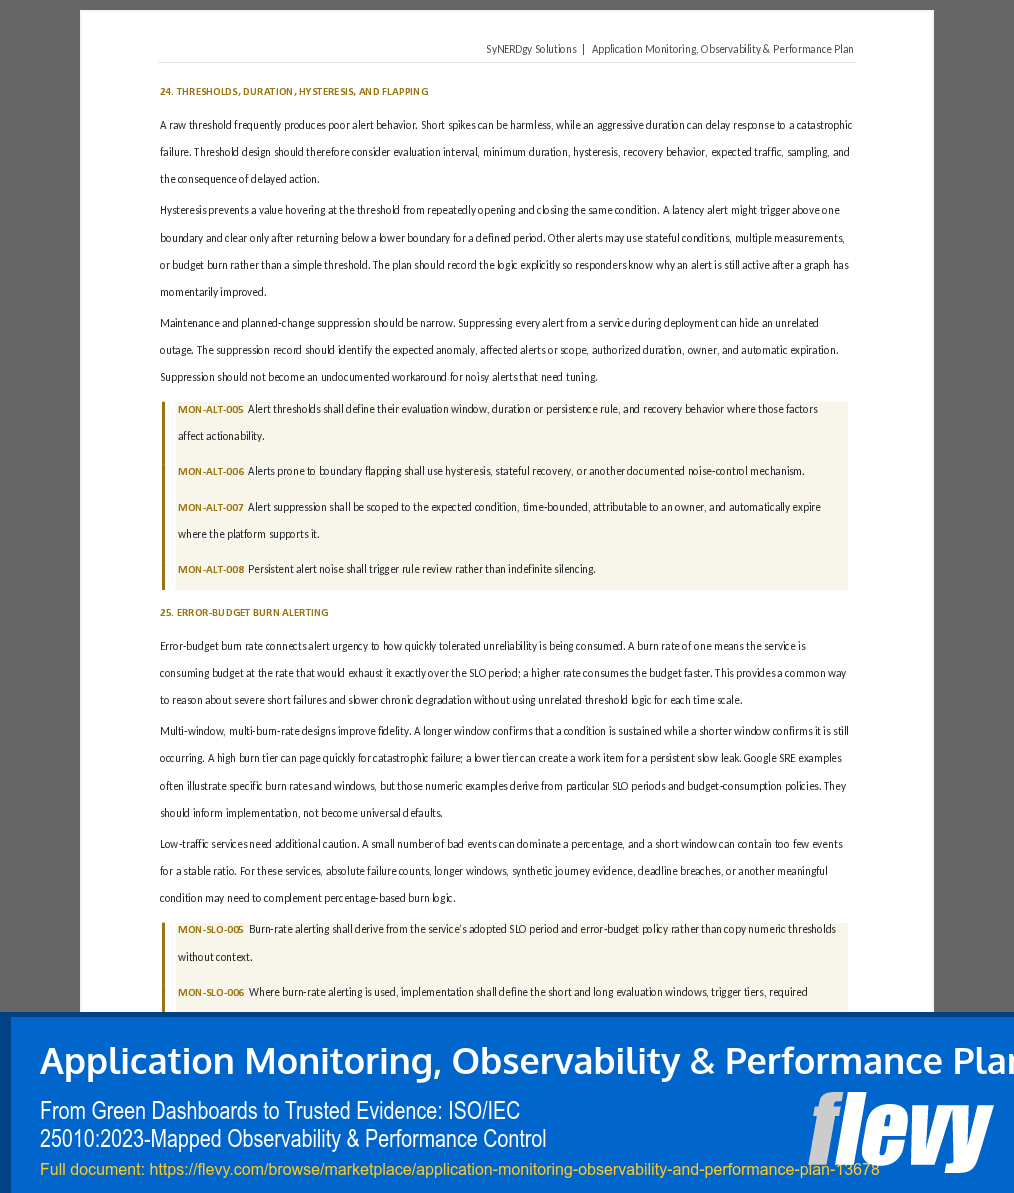
This structure helps organizations reduce alert fatigue while improving the quality of the alerts that remain. The plan supports actionable alerting, service-health monitoring, SRE monitoring practices, observability governance, application performance management, and more defensible operational response.
Service-level measurement is treated with similar rigor. Every material SLI should have a defined event population, success condition, observation point, source, aggregation method, measurement window, exclusions, and owner. SLOs should be tied to service consequence and user or dependent-system need rather than chosen as prestige targets. Error budgets become useful only when the organization defines what management or engineering decision follows meaningful budget consumption or repeated breach.
The plan also recognizes that not every workload behaves like a synchronous web request. Monitoring controls address APIs, queues, asynchronous workers, scheduled jobs, data-processing systems, storage-backed applications, and critical dependencies using measurements appropriate to their actual failure semantics.
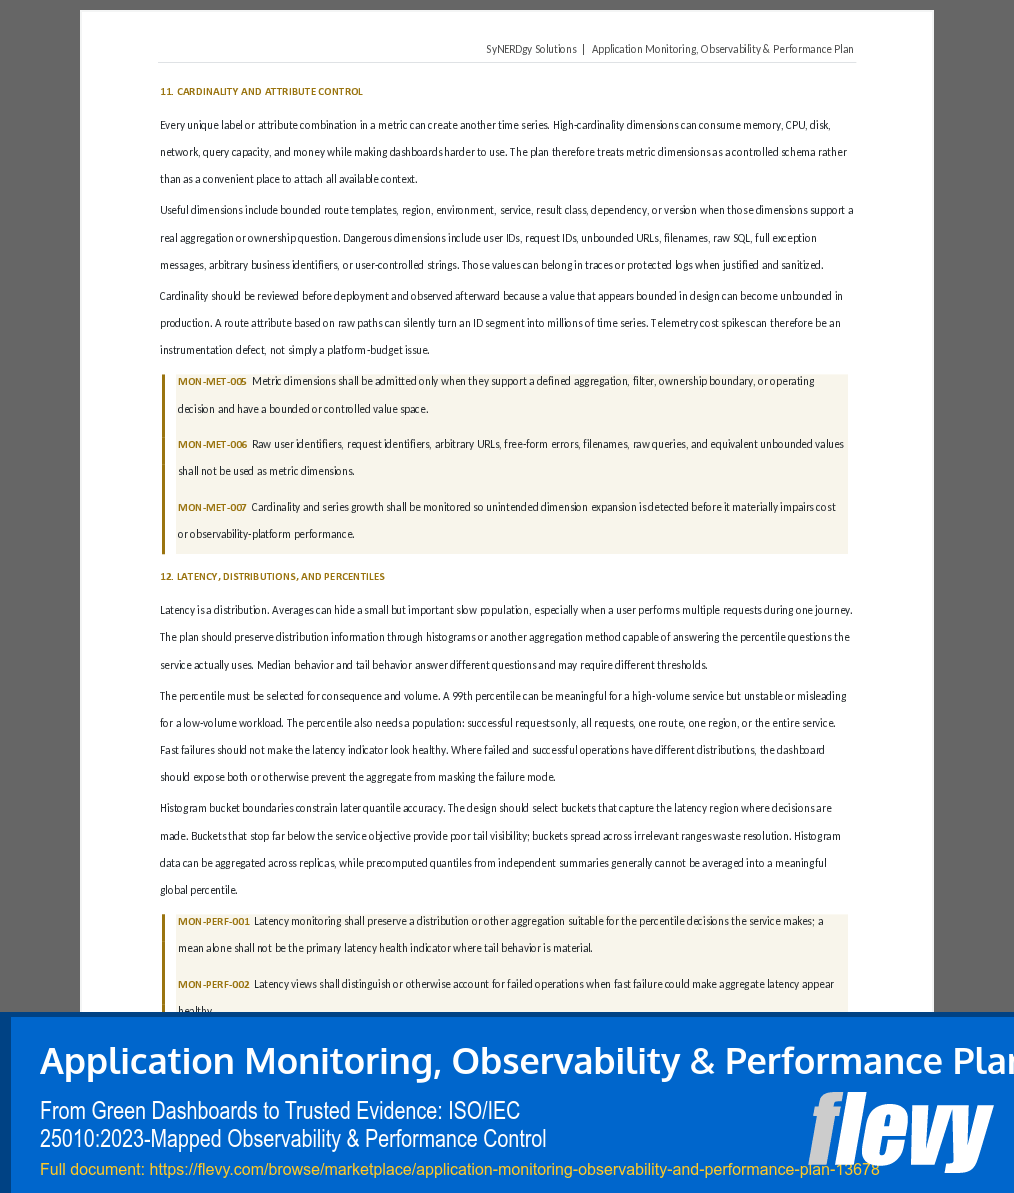
For example, queue depth alone may not establish whether asynchronous work is healthy. Scheduled work may require terminal completion and deadline evidence rather than simple job-start monitoring. A dependency can be healthy according to a provider while failing for a specific application, account, region, route, or workload. Capacity pressure can emerge in queues, connection pools, quotas, memory, storage, downstream concurrency, or other constrained resources even while CPU utilization looks ordinary.
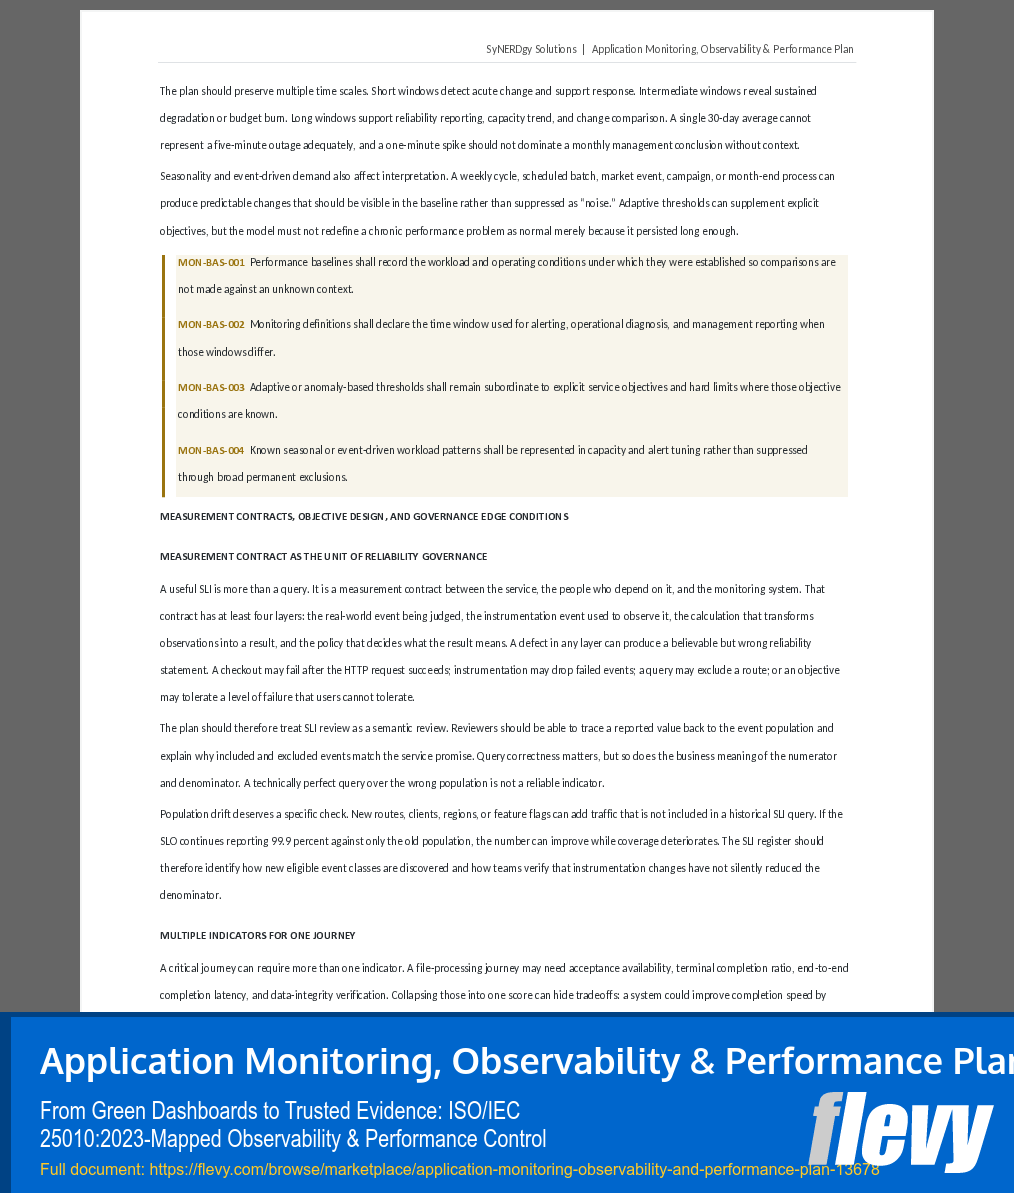
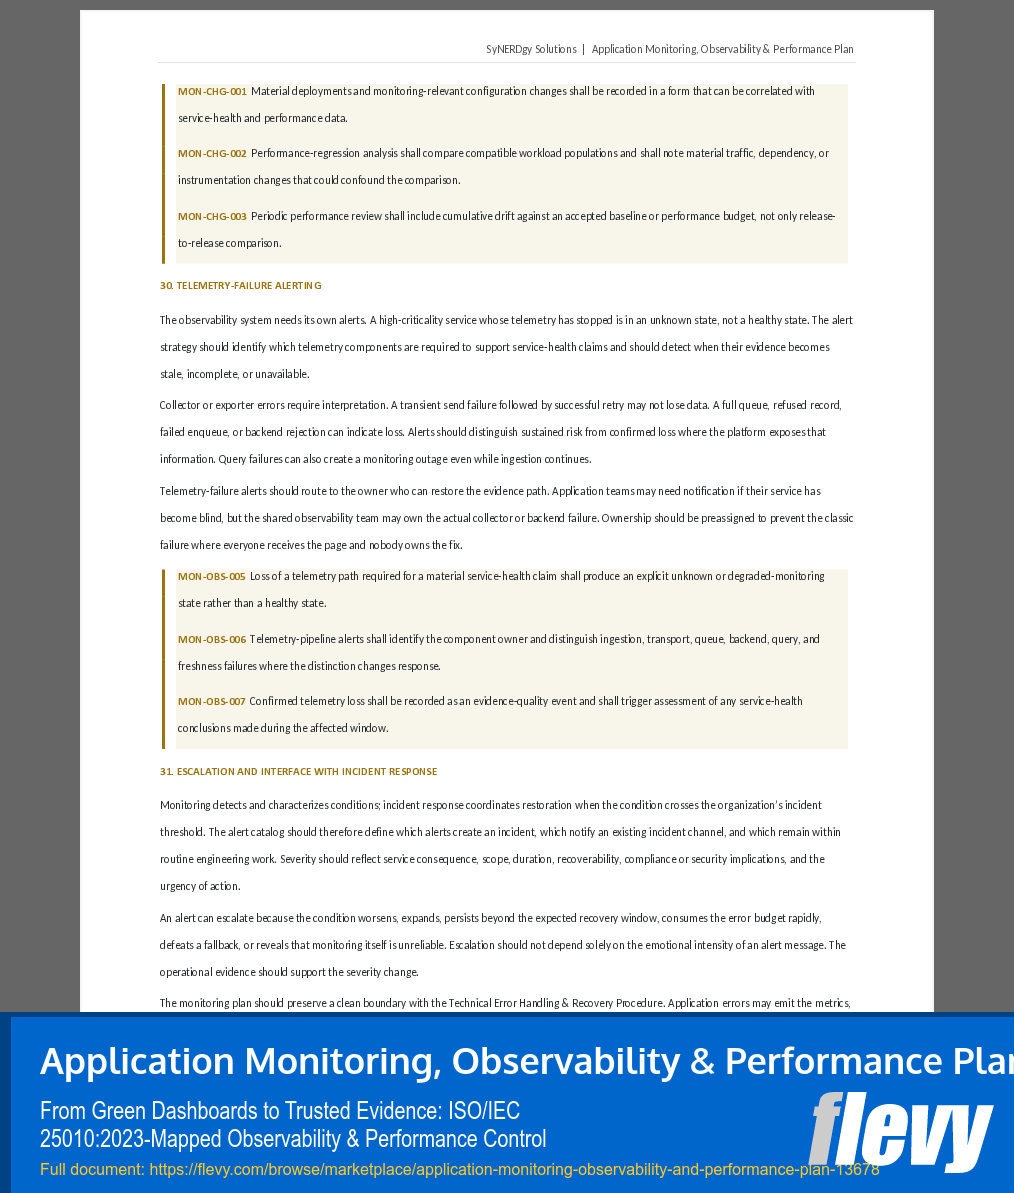
The plan gives particular attention to telemetry-pipeline health because the monitoring system can fail independently of the application. Agents, collectors, exporters, backend ingestion, queues, dashboards, query paths, clocks, and sampling behavior can all distort or remove evidence. A mature observability strategy therefore needs to monitor whether the monitoring system itself remains trustworthy.
The operating model is deliberately provider-neutral. It does not prescribe a particular cloud platform, application performance monitoring vendor, telemetry backend, dashboard product, logging stack, collector, exporter, query language, or tracing implementation. Teams can apply the plan with the tools that fit their architecture while preserving a common control model for service health, measurement, ownership, alerting, diagnosis, capacity, validation, and review.
It also avoids inventing universal latency limits, SLO percentages, alert thresholds, retention periods, sampling rates, or capacity targets simply to make a template appear complete. Those values remain implementation decisions that should be justified against user consequence, workload behavior, operating commitments, technical capacity, contractual requirements, telemetry quality, and available evidence.
For organizations working in standards-informed environments, the plan is designed to support monitoring, measurement, software-quality, and service-management practices associated with ISO/IEC 25010:2023, ISO/IEC 25023:2016, and ISO/IEC 20000-1:2018.
The ISO references provide professional alignment context only. This document does not represent ISO certification, third-party conformity assessment, or automatic compliance with any standard.
The buyer receives the operating plan plus 15 reusable implementation annexes designed to turn monitoring from a one-time instrumentation project into a maintainable operating system.
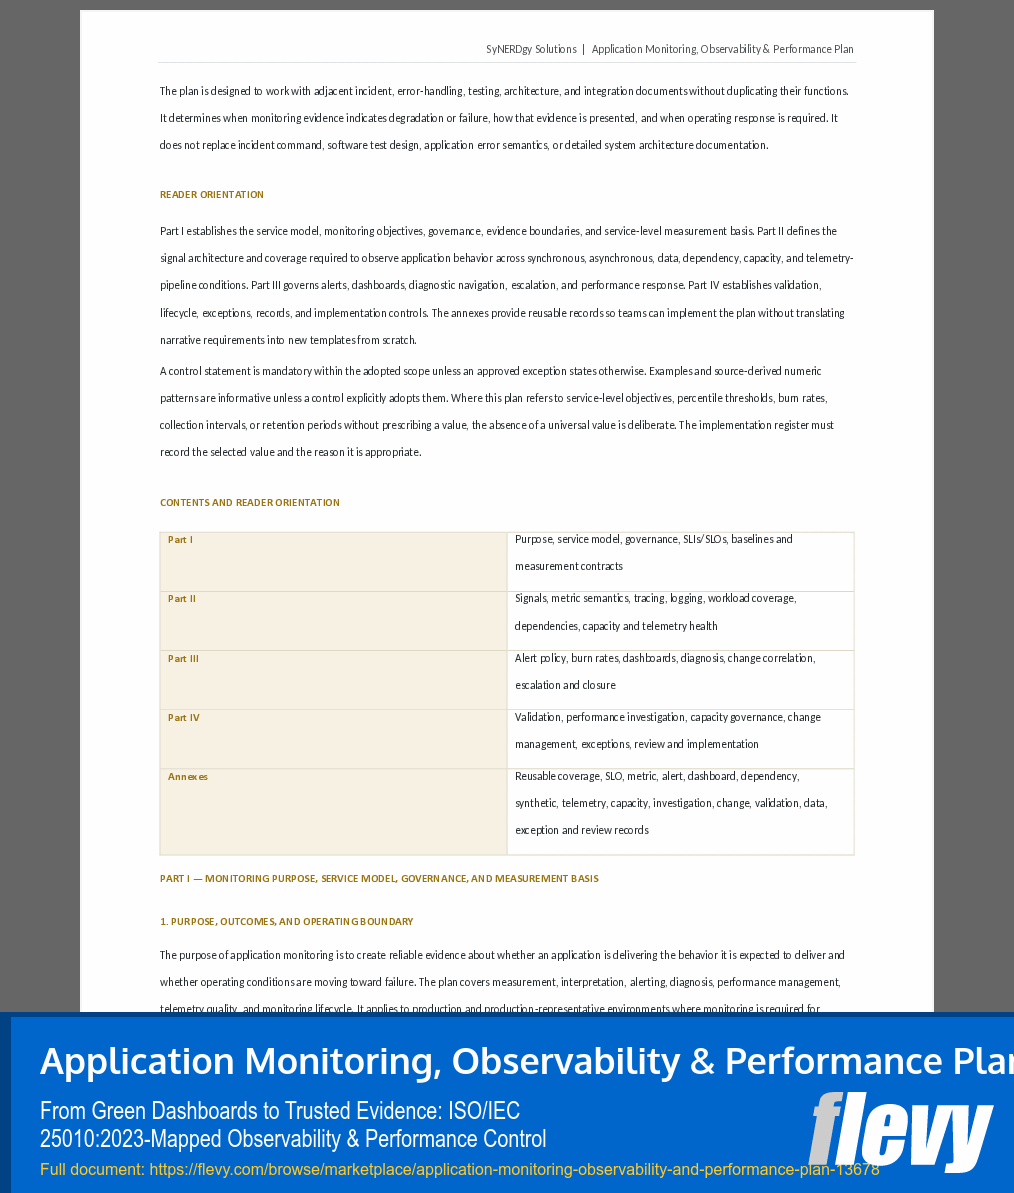
The annex set includes an Application/Service Monitoring Coverage Map, SLI/SLO and Error-Budget Register, Metric and Attribute Dictionary, Alert Catalog, Dashboard Inventory, Dependency Monitoring Matrix, Synthetic Monitoring Register, Telemetry-Pipeline Health Record, Capacity Register, Performance Investigation Record, Monitoring Change Impact Assessment, Validation and Drill Record, Telemetry Data Classification and Retention Matrix, Exception Record, and Periodic Monitoring Review.
Use the plan when establishing or redesigning an application monitoring plan, building an observability strategy, formalizing an SRE monitoring framework, implementing or governing SLIs, SLOs, and error budgets, reducing noisy or non-actionable paging, improving application performance monitoring, investigating latency or capacity degradation, monitoring APIs and dependencies, detecting telemetry blind spots, preparing applications for production acceptance, improving capacity visibility, validating monitoring before operational reliance, or standardizing monitoring across multiple services and teams.
The strongest fit is for application and platform teams, SRE and DevOps teams, engineering managers, service owners, enterprise architects, QA and assurance teams, technical consultants, operations leaders, and organizations that need monitoring evidence to support real operating decisions rather than merely prove that dashboards exist.
Works Well With Other SyNERDgy Resources
Application Monitoring, Observability & Performance Plan is designed to function as part of a broader technical reliability control system.
Pair it with System Integration Requirements & Control Specification when APIs, third-party systems, callbacks, message exchanges, and distributed workflows need clearly defined integration behavior, authority, failure states, recovery expectations, and acceptance conditions before those conditions can be meaningfully monitored.
Pair it with Technical Error Handling & Recovery Procedure when monitoring identifies a failure and the organization needs a controlled method for error classification, containment, retry behavior, escalation, fallback, recovery, and verification.
Pair it with Software Testing & Acceptance Protocol when monitoring, resilience, performance, and recovery expectations need to become testable verification evidence supporting an authorized release or acceptance decision.
Data Flow Documentation & Control Guide can further support environments where application data, telemetry flows, ownership, boundaries, transformations, and system interactions need to remain traceable across components.
Together, these resources form a practical technical reliability chain:
System Integration Requirements & Control Specification → Application Monitoring, Observability & Performance Plan → Technical Error Handling & Recovery Procedure → Software Testing & Acceptance Protocol
Or, operationally:
Define → Detect → Recover → Prove
The intended end state is straightforward: management and technical teams should be able to define what healthy service means, explain where and how it is measured, identify what conditions justify intervention, understand who owns the response, navigate from service symptom to diagnostic evidence, distinguish true recovery from disappearing alerts, and verify that the monitoring system itself is healthy enough to trust. The underlying plan is explicitly organized around that decision purpose.
Application Monitoring, Observability & Performance Plan provides that structure in a reusable, editable format, helping teams move from dashboard sprawl and reactive alerting toward traceable service-health evidence, governed observability, reliable SLI/SLO practices, disciplined performance monitoring, and decision-ready operational control.
Got a question about the product? Email us at support@flevy.com or ask the author directly by using the "Ask the Author a Question" form. If you cannot view the preview above this document description, go here to view the large preview instead.
Source: Best Practices in Information Technology, Incident Management Word: Application Monitoring, Observability & Performance Plan Word (DOCX) Document, SyNERDgy Solutions | R&D Systems
ABOUT THE AUTHOR

SyNERDgy Solutions develops proprietary enterprise frameworks and professional systems for complex organizational and technical environments.
Our work spans operational excellence, governance and risk, enterprise architecture, systems and AI, assurance, implementation, evidence analysis, and financial decision support.
SyNERDgy products are independently developed and subsequently cross-mapped
... [read more]
Ask the Author a Question
You must be logged in to contact the author.




























