This framework is developed by a team of former McKinsey and Big 4 consultants. The presentation follows the headline-body-bumper slide format used by global consulting firms.
This product (Profitability and Cost Structure Analysis: Internal Data Analysis Frameworks) is a 17-slide PPT PowerPoint presentation slide deck (PPT), which you can download immediately upon purchase.
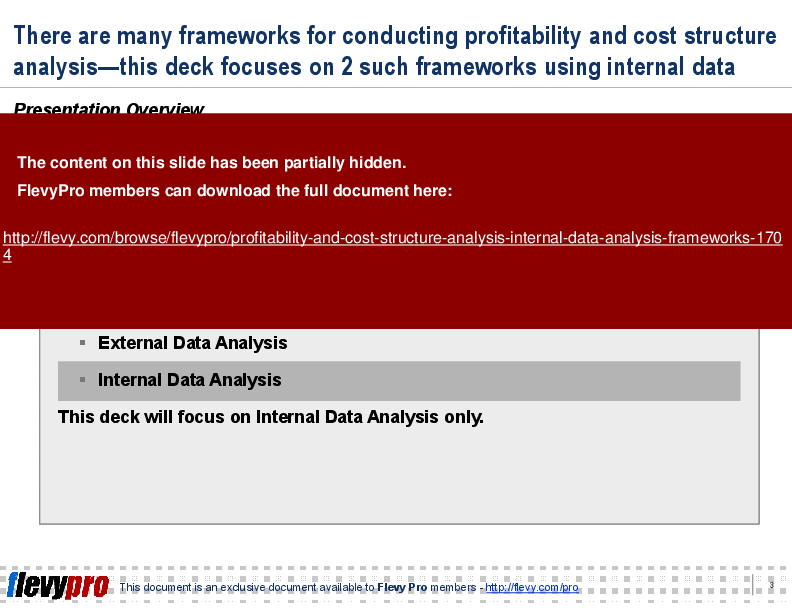
Profitability and cost structure analysis provides many invaluable insights. Obvious examples include identifying profitable products and projects and identifying key cost driving activities and resources—which lead to better strategic decisions.
There are a number of business frameworks to conduct profitability and cost structure analysis. In this consulting training series, we will discuss 4 common frameworks split into 2 categories:
1. External Data Analysis
2. Internal Data Analysis
This deck will focus on Internal Data Analysis only.
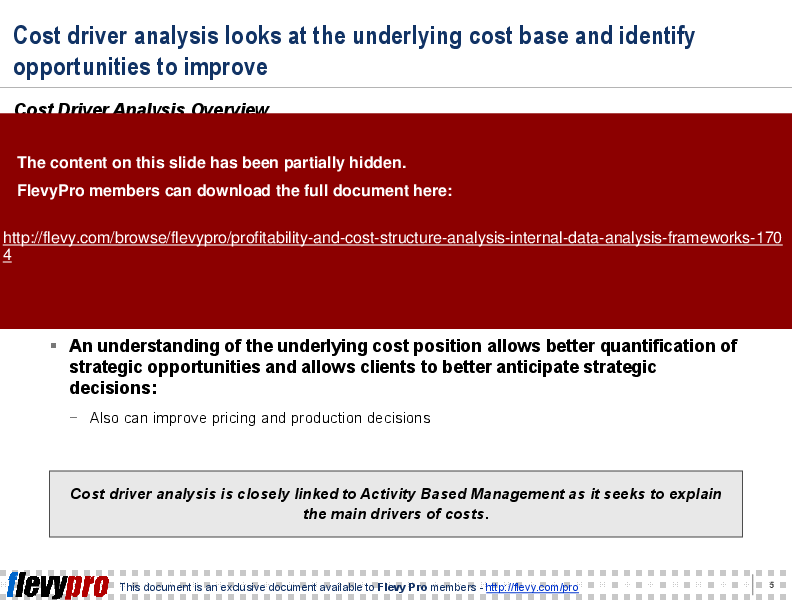
This PPT delves into cost driver analysis, providing a comprehensive understanding of the underlying cost base and identifying opportunities for improvement. It emphasizes the importance of quantifying strategic opportunities and enhancing pricing and production decisions. The analysis is closely linked to Activity Based Management, explaining the main drivers of costs.
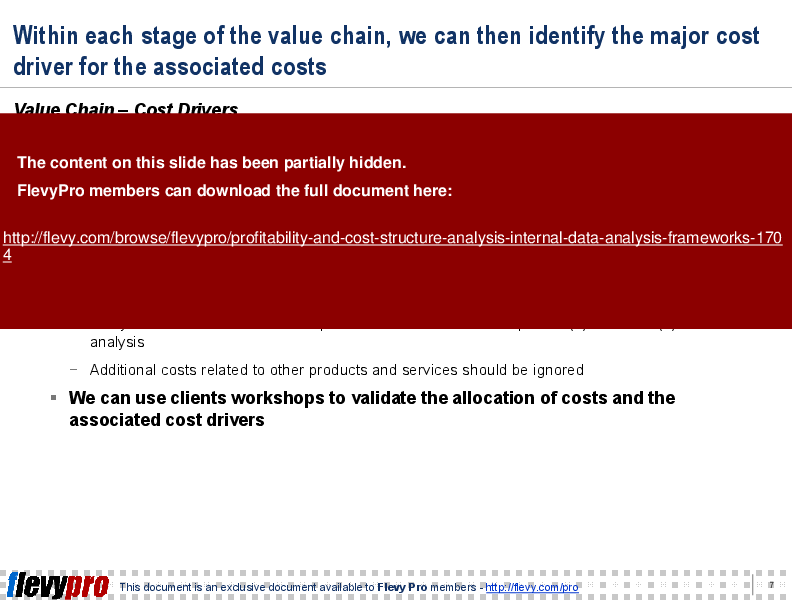
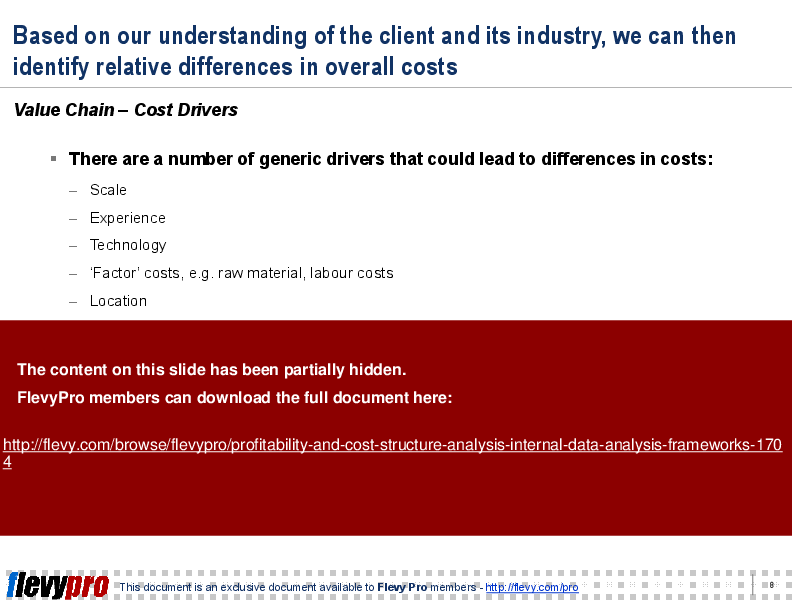
The presentation also covers the value chain approach, assigning costs to each step and identifying major activities. This method allows for a detailed examination of cost drivers at each stage, enabling businesses to validate cost allocations through client workshops. Understanding these drivers helps in pinpointing relative differences in overall costs based on scale, experience, technology, and location.
Activity Based Costing (ABC) is highlighted as a more effective tool than conventional costing systems. By focusing on business activities and corresponding activity drivers, ABC provides a clearer picture of product and customer profitability. This model traces the flow of resources to products and services, offering insights into resource allocation and cost management.
This PPT slide presents the ABC (Activity-Based Costing) model, illustrating how resources flow to products and services. It is structured into 2 main sections: the ABC Model and ABC Traces.
In the ABC Model section, the flow is depicted from the General Ledger to various components: Resources (R), Activities (A), and Cost Objects (CO). Each resource is linked to multiple activities, indicating that resources are consumed through various activities. The arrows suggest a complex interrelationship where resources are allocated based on their usage in different activities, which ultimately leads to the creation of cost objects. This model emphasizes the importance of understanding how resources are utilized across various activities to accurately assess costs.
The ABC Traces section elaborates on the implications of this model. It breaks down the flow into distinct categories: Resources, Resource Drivers, Activities, Activity Drivers, and Cost Objects. Each category is accompanied by a brief description. For instance, it notes that the cost of resources is tied to the time spent on activities, which are in turn driven by specific activity drivers. This highlights the sequential nature of cost accumulation, where costs are traced back through activities to their originating resources.
The overall message is clear: understanding this flow is crucial for effective cost management and decision-making. By tracing costs from resources to cost objects, organizations can gain insights into their operational efficiency and identify areas for improvement. This model serves as a foundational tool for businesses aiming to optimize their cost structures and enhance profitability.
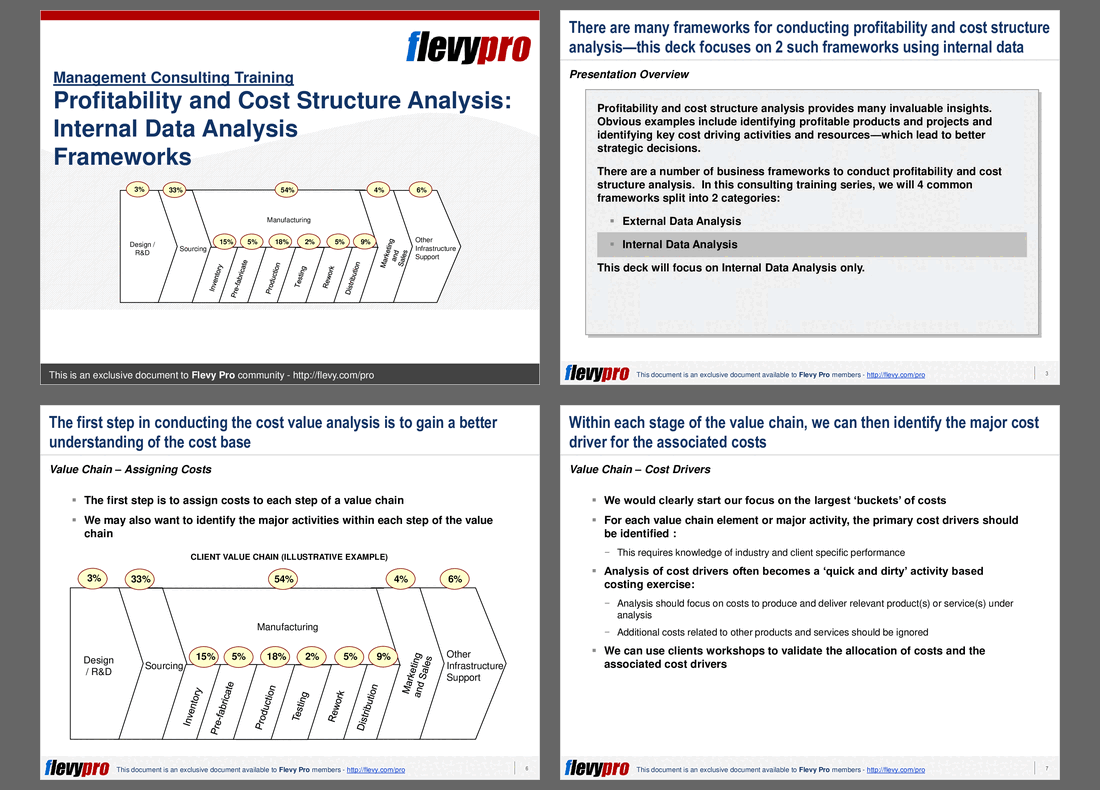
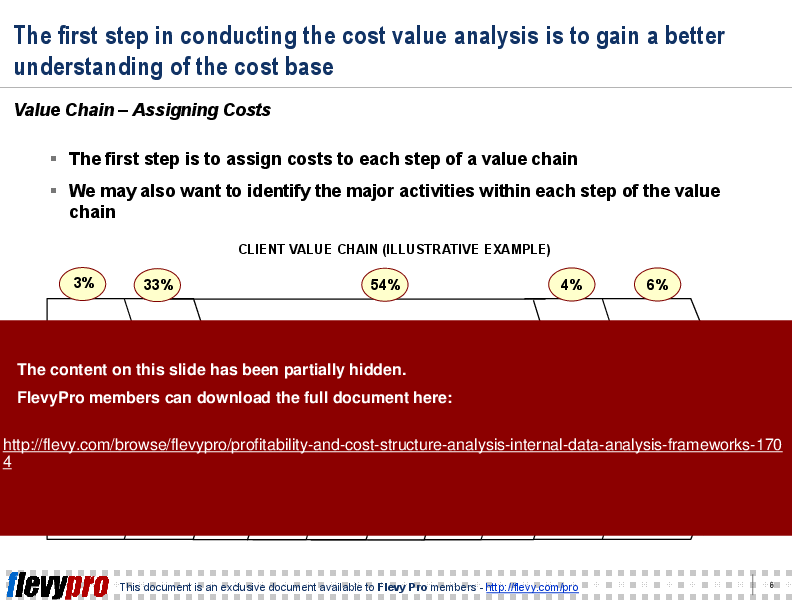
This PPT slide outlines a systematic approach to cost analysis within a client’s value chain. It emphasizes the importance of assigning costs to each segment of the value chain to gain a clearer understanding of the overall cost structure. The visual representation categorizes various activities, such as Design/R&D, Sourcing, Manufacturing, and Marketing and Sales, while providing percentage allocations that indicate the relative cost contribution of each segment.
The initial step highlighted is the assignment of costs, which serves as a foundational element for deeper analysis. By identifying major activities within each segment, organizations can pinpoint areas where efficiencies can be improved or costs can be reduced. For instance, the Manufacturing section shows a breakdown of costs associated with Inventory, Pre-fabricate, Production, Testing, Rework, and Distribution. Each of these activities has a specific percentage allocation, which helps in understanding where the bulk of costs are incurred.
The slide also suggests that understanding these allocations can lead to better decision-making regarding resource allocation and operational improvements. The percentages indicate that Sourcing and Manufacturing are significant cost drivers, accounting for a combined total of 48%. This insight can guide strategic initiatives aimed at optimizing these areas.
Overall, this slide serves as a practical tool for executives looking to enhance their understanding of cost structures and identify potential areas for operational efficiencies. It provides a clear framework for analyzing costs, which is crucial for informed strategic planning.
This PPT slide presents a framework for understanding activity drivers within the ABC (Activity-Based Costing) model. At the top, the General Ledger serves as the foundational element, linking to various resources indicated by the letter "R." These resources are essential for the subsequent layers of the model. Below the resources, resource drivers are depicted, which connect resources to activities, represented by the letter "A." This illustrates how resources are allocated and utilized in the execution of activities.
The central focus of the slide is on activity drivers, which are defined as events that initiate activities. These drivers are crucial as they trigger the use of activities associated with cost objects, shown at the bottom of the slide. The term "cost objects" refers to the specific items or services for which costs are measured and analyzed.
On the right side, the slide elaborates on the authorization process, which is a key mechanism through which activity drivers operate. It outlines how various proposals (W, X, Y) lead to the initiation of activities related to specific products. This connection emphasizes the importance of understanding how different proposals serve as activity drivers, ultimately influencing the cost structure of products.
The structure of the slide effectively communicates the relationships between resources, activities, and cost objects, providing a clear visual representation of how activity drivers function within the ABC model. This framework can aid executives in identifying and analyzing cost behaviors, enabling more informed decision-making regarding resource allocation and operational efficiency.
This framework is developed by a team of former McKinsey and Big 4 consultants. The presentation follows the headline-body-bumper slide format used by global consulting firms.
For $10.00 more, you can download this document plus 2 more FlevyPro documents. That's just $13 each.
ABOUT FLEVYPRO
This document is part of the FlevyPro Library, a curated knowledge base of documents for our FlevyPro subscribers.
FlevyPro is a subscription service for on-demand business frameworks and analysis tools. FlevyPro subscribers receive access to an exclusive library of curated business documents—business framework primers, presentation templates, Lean Six Sigma tools, and more—among other exclusive benefits.
Since 2012, we have provided best practices to over 10,000 businesses and organizations of all sizes, from startups and small businesses to the Fortune 100, in over 130 countries.
Read Customer Testimonials
"I have used FlevyPro for several business applications. It is a great complement to working with expensive consultants. The quality and effectiveness of the tools are of the highest standards."
– Moritz Bernhoerster, Global Sourcing Director at Fortune 500
"Flevy.com has proven to be an invaluable resource library to our Independent Management Consultancy, supporting and enabling us to better serve our enterprise clients.
The value derived from our [FlevyPro] subscription in terms of the business it has helped to gain far exceeds the investment made, making a subscription a no-brainer for any growing consultancy – or in-house strategy team."
– Dean Carlton, Chief Transformation Officer, Global Village Transformations Pty Ltd.
"FlevyPro provides business frameworks from many of the global giants in management consulting that allow you to provide best in class solutions for your clients."
– David Harris, Managing Director at Futures Strategy
"If you are looking for great resources to save time with your business presentations, Flevy is truly a value-added resource. Flevy has done all the work for you and we will continue to utilize Flevy as a source to extract up-to-date information and data for our virtual and onsite presentations!"
– Debbi Saffo, President at The NiKhar Group
"As a niche strategic consulting firm, Flevy and FlevyPro frameworks and documents are an on-going reference to help us structure our findings and recommendations to our clients as well as improve their clarity, strength, and visual power. For us, it is an invaluable resource to increase our impact and value."
– David Coloma, Consulting Area Manager at Cynertia Consulting
"I have found Flevy to be an amazing resource and library of useful presentations for lean sigma, change management and so many other topics. This has reduced the time I need to spend on preparing for my performance consultation. The library is easily accessible and updates are regularly provided. A wealth of great information."
– Cynthia Howard RN, PhD, Executive Coach at Ei Leadership
"Last Sunday morning, I was diligently working on an important presentation for a client and found myself in need of additional content and suitable templates for various types of graphics. Flevy.com proved to be a treasure trove for both content and design at a reasonable price, considering the time I
saved. I encountered a download issue during the ordering process. However, a quick email to Flevy's support team, even on a Sunday (!!!), resulted in assistance within less than an hour, allowing me to download the content I needed. Fantastic job, Flevy! I give 5 stars for both content/price and customer service. Thank you!
"
– M. E., Chief Commercial Officer, International Logistics Service Provider
"As a young consulting firm, requests for input from clients vary and it's sometimes impossible to provide expert solutions across a broad spectrum of requirements. That was before I discovered Flevy.com.
Through subscription to this invaluable site of a plethora of topics that are key and crucial to consulting, I
have been able to exceed expectations and deliver quality advice and solutions to my clients. The quality and expertise of the authors are exemplary and gives me great confidence to use as part of my service offerings.
I highly recommend this company for any consultant wanting to apply international best practice standards in their service offerings.
"
– Nishi Singh, Strategist and MD at NSP Consultants
Save with Bundles
This document is available as part of the following discounted bundle(s):
Download our free compilation of 50+ Strategy & Transformation slides and templates. Frameworks include McKinsey 7-S, Balanced Scorecard, Disruptive Innovation, BCG Curve, and many more.